
Abstract
Ten-Eleven Translocation (TET) proteins oxidize 5-methylcytosine (5mC) to 5-hydroxymethylcytonsie (5hmC). Our recent work found a decline in global 5hmC level in mouse kidney insulted by ischemia reperfusion (IR). However, the genomic distribution of 5hmC in mouse kidney and its relationship with gene expression remain elusive. Here, we profiled the DNA hydroxymethylome of mouse kidney by hMeDIP-seq and revealed that 5hmC is enriched in genic regions but depleted from intergenic regions. Correlation analyses showed that 5hmC enrichment in gene body is positively associated with gene expression level in mouse kidney. Moreover, IR injury-associated genes (both up- and down-regulated genes during renal IR injury) in mouse kidney exhibit significantly higher 5hmC enrichment in their gene body regions when compared to those un-changed genes. Collectively, our study not only provides the first DNA hydroxymethylome of kidney tissues but also suggests that DNA hyper-hydroxymethylation in gene body may be a novel epigenetic marker of IR injury-associated genes.
Introduction
Renal ischemia reperfusion (IR) injury happens frequently in the peri-operative patients undergoing kidney transplantation or nephrectomy.Citation1,Citation2 Although the direct cause of IR injury is clear, its underlying patho-physiological process is complicated and remains more extensive investigation.Citation3 Lots of work have revealed that IR injury induces dynamic changes in gene expression and that the up- or down-regulated genes contribute to inflammation, apoptosis, necrosis, tissue repair as well as other events associated with IR injury.Citation4 In addition to study the functional roles of the differential expressed genes, the dramatic changes in gene expression also give rise to another important question of how the epigenetic regulation corporate with the transcriptional machine to fine-tune the gene expression in the tissues/cells insulted by IR.Citation5,Citation6
Among the well-studied epigenetic modifications, DNA methylation (5mC) plays key roles in gene transcription, X-chromosome inactivation, gene imprinting and genomic stability.Citation7,Citation8 Although the DNA methylation patterns are relative stable in adult tissues or cells, recent research wok suggested that DNA methylation is physiologically reversible. Several groups identified that TET (Ten-eleven translocation) proteins oxidize 5mC into 5hmC, 5fC (5-formylcytosine), and 5caC (5-carboxylcytosine) and that those 5mC oxidative derivatives could be erased through active or passive ways.Citation9,Citation10 In addition to be the potential intermediate products of DNA demethylation, 5hmC/5fC/5caC are also regarded as new epigenetic modifications. Our recent work revealed that the global 5hmC level but not 5mC level in mouse kidney decreases upon ischemia reperfusion.Citation11 However, little is known about the genome-wide distribution pattern of 5hmC in mouse kidney and its relationship with gene expression.
Therefore, in the current study, we profiled the DNA hydroxymethylome of mouse kidney and analyzed the relationships between 5hmC enrichment and gene expression. Furthermore, we also analyzed the potential effect of 5hmC enrichment on gene expression dynamics during renal IR injury. Our results suggest that 5hmC is an abundant epigenetic modification in mouse kidney and its enrichment in gene body regions may be a novel epigenetic mark of IR injury-associated genes.
Materials and methods
Animal experiment
The animal experimental procedure was approved by Zhongshan Hospital, Shanghai Medical College of Fudan University. Six-week old male C57/B6 mice (Shanghai Laboratory Animal Center, CAS) were used in this study. The mouse model of acute renal ischemia reperfusion (IR) was established as described previously.Citation11
Genomic DNA preparation
The genomic DNA of mouse kidney tissue was prepared using Qiagen DNeasy Kit (Hilden, Germany) according to the manufacturer’s protocol.
High performance liquid chromatography
The gDNA samples (10 μg each) were digested by DNase I (NEB), intestinal phosphatase (NEB) and snake venom phosphodiesterase I (NEB) at 37 °C for 2 h. The digested gDNA samples were analyzed by High performance liquid chromatography (HPLC) as previously described.Citation10
Hydroxymethylated DNA Immunoprecipitation followed by High-Throughput Sequencing (hMeDIP-seq)
The kidney gDNAs from five mice were barcoded respectively and pooled together for hMeDIP and next generation sequencing as described previously.Citation12 Briefly, the sonicated gDNA samples (1 μg each mouse) were end repaired using Epicenter End-It DNA-Repair Kit (Southfield, MI), extended using a NEB Klenow fragment (3'-5' exo) (Ipswich, MA), and ligated to sequencing adaptor oligos containing different barcode. After the hMeDIP procedures as described elsewhere, the input and immunoprecipitated DNA were amplified by PCR and purified for next generation sequencing using Illumina GAII (San Diego, CA). The sequencing data have been deposited in the Gene Expression Omnibus database under accession number GSE79093.
RNA preparation and cDNA microarray
Total RNA of control and IR (24 h) kidneys were prepared using RNeasy Kit (Qiagen). The pooled RNA samples from three control or IR kidneys were used for Affimetrix ST1.0 mouse cDNA Microarray. The IR injury-associated differential expression genes (DEGs) were defined by the difference of log2 expression value >0.5 between control and IR kidneys.
Bioinformatics analysis
Illumina sequencing reads were aligned to the mm9/NCBI37 reference genome using bowtie version 0.12.7 with default parameter settings. Subsequently, reads were filtered for duplicates and extended by 350 bp.
MACS2 was used to identify the 5hmC peaks from hMeDIP-seq datasets. The location of 5hmC peaks in different genomic features (distal intergenic regions, promoter, exon, intron) was analyzed using CEASCitation13. 5hmC peaks were annotated to the gene promoters (TSS ±0.5 kb) or gene body regions (from TSS to TES). Gene ontology analysis was performed using DAVID functional annotation tools with Biological Process FAT and Molecular Function FAT datasets.Citation14
To analyze 5hmC enrichment profiles on different genomic features, the average 5hmC signals of all Refseq genes on these genomic features (promoter, gene body) were plotted using homemade software.Citation15 To analyze the relationship between 5hmC enrichment and gene expression, we separated genes into five groups according to their expression levels (from low to high: 0–20%, 20–40%, 40–60%, 60–80%, 80–100%). The average 5hmC signals of the five groups of genes were plotted across the promoter (TSS ±0.5 kb) and gene body (from TSS to TES) regions. To analyze the relationship between the 5hmC enrichment in mouse kidney and the gene expression dynamics during renal IR injury, we separated genes into unchanged genes, up-regulated genes, and down-regulated genes according to our microarray data. The average 5hmC signals of the three groups of genes were plotted across the promoter and gene body regions. Box plots and statistical analysis were performed using Prism GraphPad (La Jolla, CA).
Results
Genomic distribution of 5hmC in mouse kidney
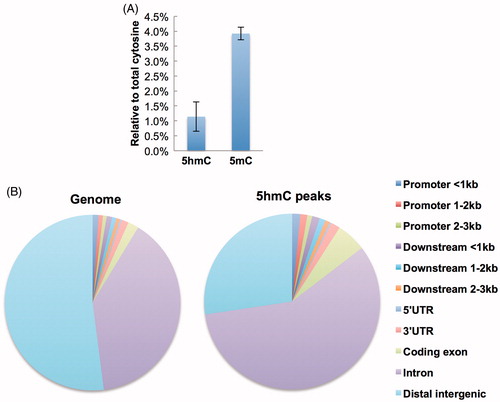
We first examined the abundance of 5hmC and 5mC in the genomic DNA of mouse kidney by HPLC. As shown in , the amount of 5hmC is 1.14% relative to total cytosine, more than 1/4 amount of 5mC (3.92%). Next, we explored hMeDIP-seq to profile the genome-wide distribution pattern of 5hmC in mouse kidney. In total, we identified 83212 5hmC-enriched regions (5hmC peaks) in whole genome. Interestingly, 5hmC peaks are enriched in genic regions (exons, introns, and proximal regulatory regions) but depleted from intergenic regions (). Thus, our data suggest that 5hmC is an abundant DNA epigenetic modification linked to genic regions in mouse kidney.
Figure 1. Genomic distribution of 5hmC in mouse kidney. (A) HPLC analysis of genomic 5hmC and 5mC levels in mouse kidney. Data represent as mean ± SD (n = 5). (B) Left pie chart showing the percentages of different genomic feature regions in mouse genome. Right pie chart showing the percentages of 5hmC peaks in different genomic feature regions.
Genic distribution of 5hmC in mouse kidney
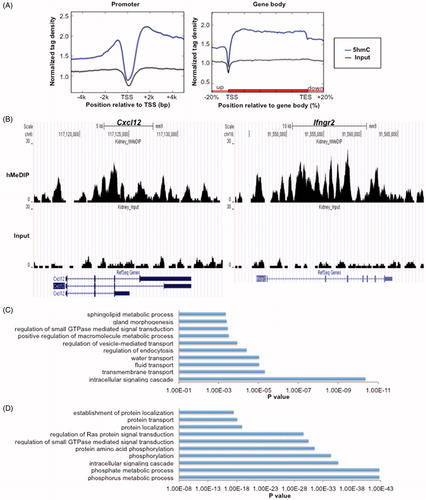
By plotting the 5hmC enrichment profiles of all refseq genes across promoter and gene body regions, we observed a dip of 5hmC signal around the transcriptional starting sites (TSS) but significant enrichment in gene body regions (). Consistently, we observed gene body enrichment of 5hmC in two representative gene loci (Cxcl12 and Ifngr2) (). Further gene annotation showed that only ∼11.57% genes have 5hmC peaks in their promoter (TSS ±0.5 kb) regions while ∼51.75% genes have 5hmC peaks in their gene body regions. Gene ontology analysis indicated that genes with 5hmC peak(s) in promoters (TSS ±0.5 kb) are related predominantly with intracellular signaling cascade, transmembrane transport, fluid transport, water transport, and regulation of endocytosis (), whereas genes with 5hmC peaks in gene body regions are enriched for phosphorylation and regulation of signal transduction ().
Figure 2. Genic distribution of 5hmC in mouse kidney. (A) 5hmC enrichment profiles of all Refseq genes across the promoter (left) and gene body (right) regions. (B) UCSC Genome Browser snapshots of Cxcl12 (left) and Ifngr2 (right). (C) Gene ontology analysis of genes with 5hmC peaks in promoters (TSS ±0.5 kb). (D) Gene ontology analysis of genes with 5hmC peaks in gene body regions.
Relationship between 5hmC enrichment and gene expression status in mouse kidney
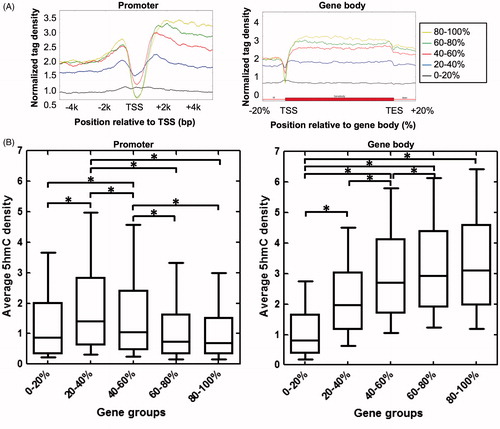
To analyze the relationship between 5hmC enrichment and gene expression status, we separated genes into five groups according to their expression levels (from low to high: 0–20%, 20–40%, 40–60%, 60–80%, and 80–100%) and plotted their 5hmC enrichment profiles across promoter and gene body regions. As shown in , highly expressed genes (80–100% group) exhibit extremely low 5hmC signal around TSS but highest 5hmC signal in gene body regions. In contrast, other groups show increased 5hmC signal around TSS but decreased 5hmC signal in gene body regions. Interestingly, the “0–20%” group has low 5hmC signal in both TSS and gene body regions. Box plot analyses confirm that the 20–40% group (lowly expressed genes) has the highest 5hmC density in TSS ±0.5 kb regions among the five groups of genes ( left). In gene body regions, the average 5hmC density is positively associated with gene expression level among the five groups of genes ( right). Thus, intragenic 5hmC enrichment has an intimate correlation with gene expression in mouse kidney.
Figure 3. Relationship between 5hmC enrichment and gene expression status in mouse kidney. (A) 5hmC enrichment profiles of genes separated into five groups according to expression in mouse kidney (from low to high: 0–20%, 20–40%, 40–60%, 60–80%, and 80–100%) across promoter (left) and gene body (right) regions.(B) Box plots showing the average 5hmC density of five groups of genes in promoter (TSS ±0.5 kb) (left) and gene body (right) regions. *P<0.05.
Relationship between 5hmC enrichment and gene expression dynamics during renal IR injury
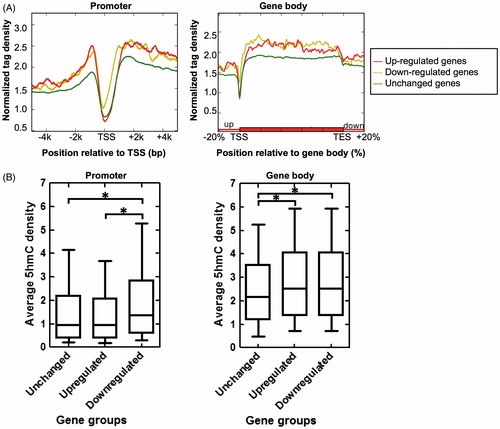
It has been reported that IR injury influences the gene expression of the insulted organs. To gain insight into the relationship between 5hmC enrichment and gene expression dynamics during renal IR injury, we performed microarray assay for control and IR kidneys (24 h post reperfusion). We identified 869 up-regulated genes and 1223 down-regulated genes in mouse kidney upon IR injury. These differential expressed genes (DEGs) during renal IR injury were defined as IR injury-associated genes. We compared the 5hmC enrichment profiles of IR injury-associated genes and unchanged genes. As shown in , the down-regulated genes exhibit higher 5hmC enrichment in promoter regions (especially from TSS to +0.5 kb) than the up-regulated and unchanged genes. Intriguingly, both the up- and down-regulated genes have much higher 5hmC enrichment in their gene body regions compared to the unchanged genes (). Taken together, our data suggest that gene body enrichment of 5hmC may be a novel epigenetic mark of IR injury-associated genes in mouse kidney.
Figure 4. Relationship between 5hmC enrichment and gene expression dynamics during renal IR injury. (A) 5hmC enrichment profiles across the promoter (left) and gene body (right) regions of unchanged, up-regulated, and down-regulated genes. (B) Box plots showing the average 5hmC density of unchanged, up-regulated, and down-regulated genes in promoter (TSS ±0.5 kb) (left) and gene body (from TSS to TES) (right) regions. *P<0.05.
Discussion
In this study, we examined the global abundance and genome-wide distribution pattern of 5hmC in mouse kidney. Although the 5hmC levels in most cells cultured ex vivo (except for ESCs and neurons) are very low, most tissues/organs of mouse and human contain high-level 5hmC in their genomic DNA.Citation16–19 Our HPLC data confirmed that mouse kidney also contains abundant 5hmC, suggesting that 5hmC is an important epigenetic modification in vivo rather than an intermediate product of DNA demethylation.
Our hMeDIP data demonstrate that 5hmC peaks prefer to locate in genic regions rather than intergenic regions. This observation is consistent to many reports that DNA hydroxymethylation occurs in euchromatin but not 5mC-enriched heterochromatin.Citation15,Citation20 Nakamura et al. also described that not all 5mC regions (e.g. constitutive heterochromatin domains) are accessible for TET proteins and that H3K9me2 and its reader PGC7 could protect these 5mC-enriched regions from TET-catalyzed oxidation.Citation21 In line with several recent studies in mouse and human ESCs, our analyzes in mouse kidney also point toward an obvious enrichment of 5hmC in gene body regions but a depletion around TSS. Citation15,Citation20,Citation22 Gene body enrichment of 5hmC suggests that DNA hydroxymethylation may be associated with the activities of gene transcription such as initiation, elongation, termination, and RNA splicing. Indeed, our analysis of genes expressed at differential levels showed that 5hmC enrichment in gene body regions is positively associated with gene expression in mouse kidney. However, it is still unknown whether DNA hydroxymethylation regulates gene expression or vice versa.
The most intriguing finding of our work is that the IR injury-associated genes exhibit higher 5hmC enrichment in their gene body regions compared to unchanged genes. Since rapid chromatin remodeling is a prerequisite for dynamic regulation of gene expression, 5hmC enrichment in gene body regions may indicate a flexible chromatin structure of these genes, poised for transcriptional activation or silencing upon IR insult or other stress stimuli. Interestingly, a recent work also showed that oxidative stress could influence 5hmC enrichment and that many differential 5hmC-enriched regions (DHMRs) were located in genes associated with the gene ontology term of “renal ischemia reperfusion”.Citation23 Since 5hmC is one of the oxidative derivatives of 5mC, it will be of great interest to investigate whether 5mC and other 5mC oxidative derivatives such as 5fC and 5caC could be used as epigenetic marks of IR injury-associated genes.
Tampe et al. found that Tet3 could demethylate the promoter of Rasbp2, a key anti-fibrosis gene, which functions as an important regulator of BMP7-mediated protection against acute kidney injury (AKI)-induced fibrosis.Citation24 Miao et al. reported that Tet2-mediated DNA hyroxymethylation is activated during brain ischemia injury and plays a protective role against stroke.Citation25 However, neither Tet1 nor Tet2 knockout has any significant influence on mouse embryonic or postnatal development (including the anatomic structures and physiological functions of kidney).Citation26,Citation27 Considering the controversial results of Tet family genes in tissue homeostasis and oxidative stress, we are currently using Tet gene knockout mice to explore the functional role of Tet family genes in stress response including renal IR injury.
It should also be noted that our research has some limitations. For example, our genome-wide data were generated from the heterogeneous mixture of kidney cells including multiple types of cells such as endothelial cells, mesenchymal cells, and hematopoietic cells. Since different cell types may have distinct genome-wide patterns of 5hmC, it will be of great interest to perform single-cell sequencing for different types of cells in mouse kidney. In addition, it will also be informative to examine the genome-wide changes of 5hmC in mouse kidney during IR injury.
In summary, we profiled the first DNA hydroxymethylome of mouse kidney, providing a foundation for future study of chromatin structure and gene regulation in renal pathophysiology. Moreover, our data suggest that gene body DNA hyper-hydroxymethylation may be a novel epigenetic mark of IR injury-associated genes. However, the functional role of DNA hydroymethylation in the dynamic regulation of gene expression during renal IR injury requires further investigation.
Funding information
This work was supported by National Natural Scientific Foundation of China [81301615] and Shanghai Natural Scientific Foundation [14ZR1406900].
Acknowledgements
We thank Li Tan, Lijun Xiong, Feizhen Wu, Ruitu Lv, and Wenqi Xu for their help in next generation sequencing and data analysis.
Disclosure statement
The authors report no conflicts of interest. The authors alone are responsible for the content and writing of the paper.
References
- Malek M, Nematbakhsh M. Renal ischemia/reperfusion injury; from pathophysiology to treatment. J Renal Inj Prev. 2015;4:20–27.
- Salvadori M, Rosso G, Bertoni E. Update on ischemia-reperfusion injury in kidney transplantation: Pathogenesis and treatment. World J Transplan. 2015;5:52–67.
- Eltzschig HK, Eckle T. Ischemia and reperfusion–from mechanism to translation. Nature Med. 2011;17:1391–1401.
- Perco P, Pleban C, Kainz A, Lukas A, Mayer B, Oberbauer R. Gene expression and biomarkers in renal transplant ischemia reperfusion injury. Transpl Int. 2007;20:2–11.
- Tang J, Zhuang S. Epigenetics in acute kidney injury. Curr Opin Nephrol Hypertens. Jul 2015;24:351–358.
- Mas VR, Le TH, Maluf DG. Epigenetics in kidney transplantation: Current evidence, predictions, and future research directions. Transplantation. 2016;100:23–38.
- Jones PA. Functions of DNA methylation: Islands, start sites, gene bodies and beyond. Nature Rev Genetics. 2012;13:484–492.
- Feng S, Jacobsen SE, Reik W. Epigenetic reprogramming in plant and animal development. Science. 2010;330:622–627.
- Tan L, Shi YG. Tet family proteins and 5-hydroxymethylcytosine in development and disease. Development. 2012;139:1895–1902.
- He YF, Li BZ, Li Z, et al. Tet-mediated formation of 5-carboxylcytosine and its excision by TDG in mammalian DNA. Science. 2011;333:1303–1307.
- Huang N, Tan L, Xue Z, Cang J, Wang H. Reduction of DNA hydroxymethylation in the mouse kidney insulted by ischemia reperfusion. Biochem Biophys Res Commun. 2012;422:697–702.
- Tan L, Xiong L, Xu W, et al. Genome-wide comparison of DNA hydroxymethylation in mouse embryonic stem cells and neural progenitor cells by a new comparative hMeDIP-seq method. Nucleic Acids Res. 2013;41:e84.
- Shin H, Liu T, Manrai AK, Liu XS. CEAS: Cis-regulatory element annotation system. Bioinformatics. 2009;25:2605–2606.
- Huang da W, Sherman BT, Lempicki RA. Bioinformatics enrichment tools: Paths toward the comprehensive functional analysis of large gene lists. Nucleic Acids Res. 2009;37:1–13.
- Xu Y, Wu F, Tan L, et al. Genome-wide regulation of 5hmC, 5mC, and gene expression by Tet1 hydroxylase in mouse embryonic stem cells. Molr Cell. 2011;42:451–464.
- Ito S, D'Alessio AC, Taranova OV, Hong K, Sowers LC, Zhang Y. Role of Tet proteins in 5mC to 5hmC conversion, ES-cell self-renewal and inner cell mass specification. Nature. 2010;466:1129–1133.
- Tahiliani M, Koh KP, Shen Y, et al. Conversion of 5-methylcytosine to 5-hydroxymethylcytosine in mammalian DNA by MLL partner TET1. Science. 2009;324:930–935.
- Kriaucionis S, Heintz N. The nuclear DNA base 5-hydroxymethylcytosine is present in Purkinje neurons and the brain. Science. 2009;324:929–930.
- Nestor CE, Ottaviano R, Reddington J, et al. Tissue type is a major modifier of the 5-hydroxymethylcytosine content of human genes. Genome Res. 2012;22:467–477.
- Ficz G, Branco MR, Seisenberger S, et al. Dynamic regulation of 5-hydroxymethylcytosine in mouse ES cells and during differentiation. Nature. 2011;473:398–402.
- Nakamura T, Liu YJ, Nakashima H, et al. PGC7 binds histone H3K9me2 to protect against conversion of 5mC to 5hmC in early embryos. Nature. 2012;486:415–419.
- Stroud H, Feng S, Morey Kinney S, Pradhan S, Jacobsen SE. 5-Hydroxymethylcytosine is associated with enhancers and gene bodies in human embryonic stem cells. Genome Biol. 2011;12:R54.
- Delatte B, Jeschke J, Defrance M, et al. Genome-wide hydroxymethylcytosine pattern changes in response to oxidative stress. Sci Rep. 2015;5:12714.
- Tampe B, Tampe D, Muller CA, et al. Tet3-mediated hydroxymethylation of epigenetically silenced genes contributes to bone morphogenic protein 7-induced reversal of kidney fibrosis. JASN May 2014;25:905–912.
- Miao Z, He Y, Xin N, et al. Altering 5-hydroxymethylcytosine modification impacts ischemic brain injury. Hum Mol Gen. 2015;24:5855–5866.
- Dawlaty MM, Ganz K, Powell BE, et al. Tet1 is dispensable for maintaining pluripotency and its loss is compatible with embryonic and postnatal development. Cell Stem Cell. 2011;9:166–175.
- Moran-Crusio K, Reavie L, Shih A, et al. Tet2 loss leads to increased hematopoietic stem cell self-renewal and myeloid transformation. Cancer Cell. 2011;20:11–24.