
Abstract
Epstein–Barr virus (EBV) is a ubiquitous virus that infects most adults latently. It persists in B lymphocytes and reactivates occasionally. Graves' disease is an autoimmune hyperthyroidism caused by thyrotropin receptor antibodies (TRAbs). We have reported that Graves' disease patients and healthy controls have EBV-infected lymphocytes that have TRAbs on their surface (TRAb(+)EBV(+) cells) in peripheral blood mononuclear cells (PBMCs). EBV reactivation is known to be associated with plasma cell differentiation and antibody production of B cells. In this study, we investigated whether TRAb(+)EBV(+) cells really produce TRAbs or not when persistent EBV is reactivated. We cultured PBMCs from 12 Graves' disease patients and 12 healthy controls for several days with cyclosporine A to expand the EBV-infected cell population, and then compared TRAb levels between EBV reactivation by 33 °C culture and EBV nonreactivation by 37 °C culture of PBMCs.
Flow cytometry confirmed that all samples at day 0 (reactivation starting point) contained TRAb(+)EBV(+) cells. During 33 °C culture, EBV-reactivated cells with EBV-gp350/220 expression increased from about 1 to 4%. We quantified TRAb levels in culture fluids by radio-receptor assay, and detected an increased concentration for at least one sampling point at 33 °C (from days 0 to 12) for all patients and healthy controls. TRAb levels were significantly higher in supernatants of 33 °C culture than of 37 °C culture, and also significantly higher in supernatants from patients than those from controls. This study revealed TRAb production from TRAb(+)EBV(+) cells in response to reactivation induction of persistent EBV in different efficiencies between patients and controls.
Introduction
Epstein–Barr virus (EBV) is a common latent virus. Many people experience its primary infection in infancy or childhood, and most adults have been infected. EBV persists in human B cells and replicates simultaneously with the cell cycle of its host; occasionally, it also reactivates to produce a lot of viruses [Citation1]. EBV has been suggested to be relevant to various autoimmune diseases including rheumatoid arthritis, multiple sclerosis and systemic lupus erythematosus [Citation2].
Thyrotropin receptor antibodies (TRAbs) are heterogeneous autoantibodies against the thyrotropin (thyroid stimulating hormone, TSH) receptor on thyroid follicular cells; they block TSH binding to the TSH receptor and stimulate follicular cells to produce thyroid hormone excessively in Graves' disease [Citation3–5]. Many reports have shown genetic factors related to the susceptibility to Graves' disease, including cytotoxic T-lymphocyte antigen (CTLA)4-polymorphism and disease-specific human leukocyte antigen (HLA) genes [Citation5–7]. However, it is difficult to explain the entire mechanisms of Graves' disease by these genetic factors, so we should consider the effect of environmental factors, especially viral infection.
On the basis of the clinical observation of Graves' disease patients, we hypothesized that in EBV-infected TRAb-predisposed B cells (TRAb-predisposed B cells, which were infected by chance with EBV, can produce TRAbs when they differentiate to plasma cells), the reactivation of persistent EBV would stimulate the host B cell to increase TRAb production, which may cause the development or exacerbation of Graves' disease [Citation8]. We have reported that Graves' disease patients have EBV-infected B cells that have TRAbs as the surface globulin (TRAb(+)EBV(+) cells), and the same cells exist in the peripheral blood of healthy controls [Citation9]. The terminal differentiation from B cells to plasma cells has been shown to occur with the reactivation of persistent EBV [Citation10,Citation11].
In this study, we induced EBV reactivation in peripheral blood mononuclear cells (PBMCs) including TRAb(+)EBV(+) cells, and detected TRAbs in culture supernatants of sampled PBMCs from all Graves' disease patients and healthy controls.
Methods
Subjects
Twelve Graves' disease patients and 12 healthy controls participated in this study (). All subjects provided written informed consent for participation in the study, and the study protocol was approved by the Medical Ethics Committee for Human Subject Research at the Faculty of Medicine, Tottori University, Yonago, Japan.
Table 1. Clinical and flow cytometric profiles.
The mean ages (±SD) of the Graves' disease patients and healthy controls were 42.00 ± 8.35 and 31.17 ± 11.22 years, respectively.
At the time of diagnosis, the patients had symptoms and laboratory data that included at least one of the following: (1) signs of thyrotoxicosis such as tachycardia, weight loss, finger tremor and sweating; (2) diffuse enlargement of the thyroid gland and (3) exophthalmos and/or specific ophthalmopathy. All of the patients also met the following criteria: (1) elevated serum levels of free T4 and/or free T3; (2) suppression of serum TSH (<0.1 μU/ml) and (3) positivity for TRAbs or thyroid-stimulating antibody.
Nine of the 12 patients were undergoing treatment with antithyroid drugs (methimazole or propylthiouracil), one of the patients (No. 10) had undergone radioiodine treatment and two of the patients (Nos. 4 and 8) were in remission.
Control subjects were selected from healthy laboratory staff. Their thyroid functions were normal and they had no family history of thyroid disease.
PBMC preparation and positive control cells
Peripheral blood samples were obtained from 12 Graves' disease patients and 12 healthy controls. PBMCs were separated using a Ficoll–Conray density gradient and stored at −80 °C until use.
We used P3HR-1 cells as a positive control for 72A1 fluorostain. P3HR-1 is an EBV-infected Burkitt's lymphoma cell line.
PBMC culture
PBMCs were cultured for several days in RPMI1640 with 0.1 μg/ml cyclosporin A at 37 °C, as described in our previous report [Citation9]. Lymphocytes cannot usually be maintained without sufficient growth factors; in particular, EBV-infected (EBV(+)) B cells die easily because of T-cell cytotoxic functions. However, as cyclosporine A inhibits T-cell function (see discussion), EBV(+) cells are able to survive and multiply [Citation1].
The frequency of EBV(+) cells in peripheral blood is too low for flow cytometric analysis, but during culture, the population of EBV(−) lymphocytes decreases, and only EBV(+) B cells expand.
Sampling protocol
The cultured PBMCs were introduced to conditions of 33 °C to induce EBV reactivation [Citation13–15], which was regarded as day 0. Every 5 days, half of the culture fluid was collected and replaced by fresh medium.
Some of the same cells were maintained under culture at 37 °C, and we sampled the culture fluid by the same protocol as for the 33 °C culture.
We collected cells cultured at 33 °C on days 0 and 12, and fixed them using 2% paraformaldehyde for flow cytometry (FCM).
FCM analysis
Collected and fixed PBMCs were washed with PBS, and their surface TRAbs were fluorostained as per our previous report [Citation8]. In brief, the PBMCs were incubated with 0.1 μg/106 cells of full-length recombinant human TSHR (Abnova, Taipei, Taiwan) for 30 min at 4 °C. After incubation, the cells were washed and incubated with 1 μg/106 cells of biotinylated goat anti-TSHR IgG (Santa Cruz Biotechnology, Santa Cruz, CA) for 30 min at 4 °C. The cells were again washed and then incubated with 0.5 μg/106 cells of allophycocyanin (APC)–streptavidin (Beckman Coulter, Fullerton, CA) for 30 min at 4 °C.
We utilized the procedure of flow cytometric in situ hybridization of EBV-encoded small RNA1 (EBER1) to detect EBV(+) cells, as per a previous report [Citation16]. In brief, fixed PBMCs were permeabilized in 50 μl of 0.5% Tween20/PBS at room temperature. The cells were resuspended in 45 μl of hybridization solution containing 12 nmol/l EBER1 peptide nucleic acid probe (Dako, Glostrup, Denmark). The probe had been labeled with fluorescein isocyanate (FITC). Hybridization was performed for 1 h at 56 °C. The cells were then washed twice with 0.5% Tween20/PBS at 56 °C. The Alexa Fluor® 488 Signal Amplification Kit (Molecular Probes, Eugene, OR) was used to enhance fluorescence.
We used a mouse monoclonal antibody called 72A1 to detect EBV-reactivated cells [Citation15,Citation17]. 72A1 is an antibody against gp350/220, a late protein of EBV reactivation.
PBMCs were incubated with 3 μl/106 cells of 72A1 mouse anti-EBV monoclonal antibody (Millipore, Temecula, CA) for 30 min at 4 °C. After incubation, the cells were washed and incubated with 1 μg/106 cells of goat anti-mouse IgG H&L (Alexa Fluor® 488, Abcam, Cambridge, UK).
Fluorostained samples were analyzed and sorted with a flow cytometer (MoFlo XDP; Beckman Coulter, Fullerton, CA).
Confocal laser microscopy
TRAb(+) 72A1(+) cells were sorted on silane-coated glass slides and examined by confocal laser microscopy (TCS SP-2; Leica, Wetzlar, Germany). 4′,6-Diamidino-2-phenylindole (DAPI: Molecular Probes/Invitrogen, Eugene, OR) was used as a nuclear marker.
We confirmed that TRAbs were represented as the red spots of APC, and non-specific binding showed diffuse dim fluorescence. These findings were shown in our previous paper [Citation9].
Determination of TRAb concentration
We quantified the TRAb concentration in culture fluids by radio-receptor assay according to the manufacturer's instructions (DYNOtest TRAb Human; Yamasa Corporation, Choshi, Japan), and then calculated the change over 5 days, and for the last term, over 2 days.
Statistical analysis
Statistical analysis was performed using SPSS Statistics 21 (IBM, Armonk, NY). We adopted the Mann–Whitney test for comparison between patients and controls. The Wilcoxon test was used for comparison between cultures at 33 and 37 °C.
Results
Increased frequencies of EBV-reactivated cells during culture at 33 °C
The frequencies of EBV-infected cells represented by EBER1(+) cells were 80.54% in patients and 87.95% in controls at day 0, and 93.15% in patients and 93.37% in controls at day 12 ().
The frequencies of 72A1 (anti-gp350/220) (+) cells in the same samples were 0.81% in patients and 1.31% in controls at day 0, and 3.94% in patients and 3.93% in controls at day 12; thus, the frequency of EBV-reactivated cells increased during 33 °C culture (, ).
Figure 1. Frequencies of EBV-reactivated cells increased during 33 °C culture. Precultured PBMCs were further cultured at 33 °C from days 0 to 12 for EBV reactivation. The cells were collected at days 0 and 12 and analyzed by flow cytometry. We used anti-EBV-gp350/220 antibody called 72A1 and Alexa Fluor488 to detect EBV-reactivated cells. TRAb-positive cells were shown by APC. Compared with day 0, the frequencies of 72A1(+) cells increased at day 12, in both patients and controls.
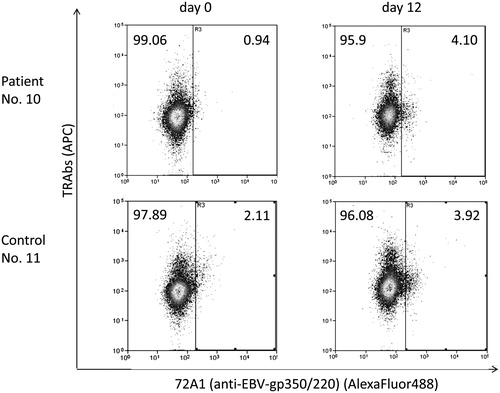
We detected TRAb(+) 72A1 (anti-gp350/220) (+) cells at 0.07% in patients and 0.18% in controls at day 0, and 1.16% in patients and 0.79% in controls at day 12 (, ).
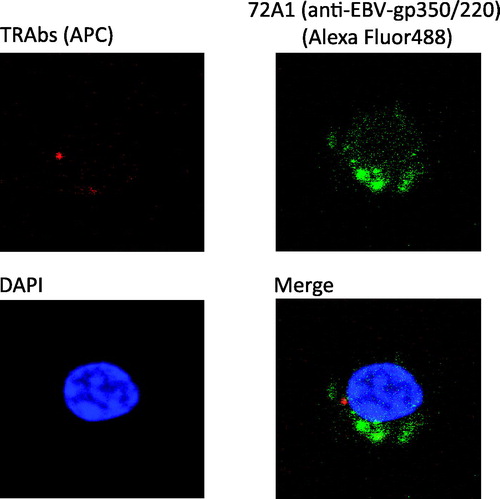
Figure 2. TRAb(+) 72A1(+) cells had characteristics of antibody-producing cells. TRAb(+) 72A1(+) cells were sorted and observed through a confocal laser microscope. Red spots of APC representing TRAbs were observed inside the cells, and green signals of Alexa Fluor488 representing 72A1 were detected inside or on the surface of the cells. The cytoplasm was abundant, and the nucleus was slightly deformed.
TRAbs(+) 72A1(+) cells have characteristics of antibody-producing cells
Observation of sorted TRAb(+) 72A1(+) double-positive cells by confocal laser microscopy revealed the presence of red spots of APC representing TRAbs inside the cells (). Mature B cells have immunoglobulins on their surface, but during their development toward antibody-producing cells, the immunoglobulins are expressed in the cytoplasm, which corresponds to our findings.
TRAb(+) 72A1(+) cells had abundant cytoplasm and the cell nuclei represented by blue DAPI were not round and had irregular edges.
Patchy and granular green signals of Alexa Fluor488 representing 72A1 were seen inside or on the surface of the cells in this experiment () and in 33 °C-reactivated P3HR-1 cells as a positive control (Supplementary Figure 1). P3HR-1 is an EBV-infected B-cell line.
Culture at 33 °C stimulated TRAb secretion from PBMCs including TRAb(+)EBV(+) cells
We quantified TRAbs in the culture fluids by radio-receptor assay and calculated the increase from half of the concentration at one point before the sampling term to the concentration of the day, which was regarded as delta (Δ) ().
Figure 3. Schedule of culture fluid sampling and definition of delta (Δ). We transferred 37 °C precultured PBMCs to 33 °C at day 0. On days 0, 5, 10 and 12, we collected half of each culture fluid and replaced it with fresh medium. Upon this change of half of the medium, the TRAb concentration of the culture fluid was halved. We calculated the increase of TRAb concentration from half of that at one term before the sampling day, which we regarded as delta (Δ).
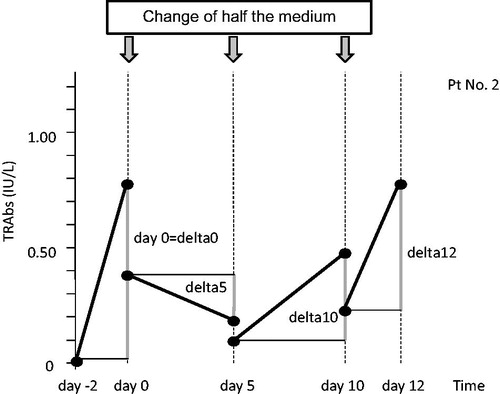
We observed an increase of TRAb concentration (positive Δ) for at least one sampling point (from days 0 to 12) in every sample cultured at 33 °C (). In contrast to the 33 °C culture, no TRAbs were detected in two controls in 37 °C culture (control 4 and control 5) during the observation period.
Table 2. (A) TRAb levels in 33 °C culture fluid (IU/l) and (B) TRAb levels in 37 °C culture fluid (IU/l).
We compared the sum of Δ of each sample between 33 and 37 °C ().
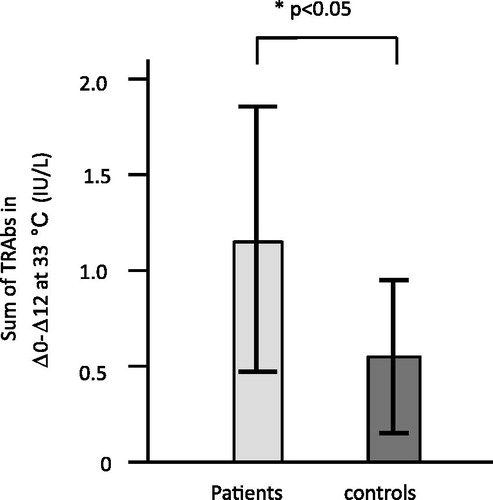
Figure 4. TRAbs released from PBMCs cultured at 33 °C (EBV reactivation) and 37 °C (no induction of EBV reactivation). We compared the sum of Δ of the TRAb concentration in culture fluids at 33 and 37 °C. In three analyses of Δ0–Δ12 (Δ0 + Δ5 + Δ10 + Δ12), Δ5–Δ12 (Δ5 + Δ10 + Δ12) and Δ10–Δ12 (Δ10 + Δ12), the sums of Δ of TRAb concentration at 33 °C were significantly higher than those at 37 °C.
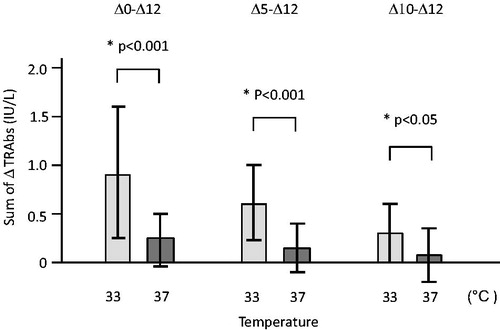
The sums of Δ0–Δ12 (Δ0 + Δ5 + Δ10 + Δ12) at 33 °C were significantly higher (p < 0.001) than those at 37 °C.
The TRAb levels at day 0 are influenced by the conditions of pre-culture rather than 33 °C culture because we transferred the PBMCs from pre-culture to 33 °C culture at day 0. Thus, we excluded Δ0 and compared the sums of Δ5–Δ12 (Δ5 + Δ10 + Δ12); the sums of Δ5–Δ12 at 33 °C were still significantly higher (p < 0.001) than those at 37 °C.
When we compared the sums of Δ10–Δ12 (Δ10 + Δ12) for confirmation, those at 33 °C were significantly higher (p < 0.05) than those at 37 °C; thus, we considered that 33 °C culture had stimulated the secretion of TRAbs.
Total TRAb release by patient PBMCs was greater than by control PBMCs
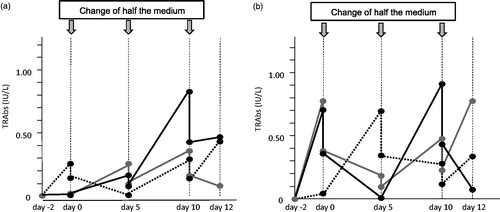
shows representative courses of the TRAb concentration of three PBMCs from patients (B) and of three PBMCs from controls (A) in 33 °C culture.
Figure 5. Representative courses of the TRAb concentration changes by EBV-reactivation induction in 33 °C culture fluids of three patient PBMCs and three control PBMCs. (a) Controls and (b) patients.
In order to evaluate the total TRAbs secreted by PBMCs after preculture, we compared the sums of Δ0–Δ12 (Δ0 + Δ5 + Δ10 + Δ12) at 33 °C between patients and controls; those of patients were significantly higher (p < 0.05) than those of controls ().
Figure 6. Difference of TRAb levels released from 33 °C PBMC culture (EBV-reactivation induction) between patients and controls. The sums of Δ0–Δ12 (Δ0 + Δ5 + Δ10 + Δ12) of TRAb concentration were significantly higher in patients than in controls (p < 0.05).
PBMCs from patients showed greater reactive TRAb release than control PBMCs
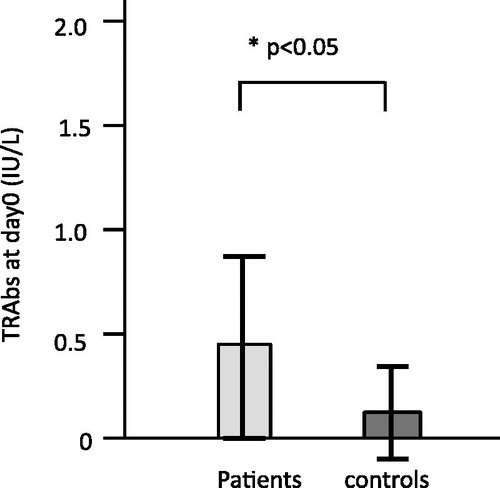
The TRAb secretion at day 0 observed in 10 patients and 5 controls was supposed to be influenced by preculture. We compared the TRAb levels at day 0 (=Δ0) between patients and controls, and those of patients were significantly higher (p < 0.05) ().
Figure 7. TRAb release in PBMC culture for patients and controls at day 0 (preinduction stage of EBV reactivation). The TRAb secretion at day 0 was supposed to be influenced by preculture, especially the added cyclosporine A. We compared the TRAb concentrations at day 0, and the concentration in patients was significantly higher (p < 0.05) than in controls.
Discussion
We induced EBV reactivation in PBMCs including TRAb(+)EBV(+) cells, under the hypothesis that, in EBV-infected TRAb-predisposed B cells, the reactivation of persistent EBV would stimulate the host B cells to increase the production of TRAbs, which may cause the development or exacerbation of Graves' disease [Citation8,Citation9]. We detected TRAbs in 33 °C culture fluids of every sample of PBMCs from Graves' disease patients and healthy controls.
We used the culture at 33 °C to induce EBV reactivation [Citation13–15], although the most common inducer is phorbol ester. Reactivation by culture at 33 °C is not efficient, but is likely to be physiological because no chemicals are required. Furthermore, it is suitable for preparing samples for flow cytometric analyses because the injury of the cellular membrane is considered to be minimal until the cells become lytic and we can avoid non-specific binding of fluorochromes.
In these flow cytometric analyses, we used the antibody called 72A1 against EBV gp350/220, a late antigen of EBV reactivation [Citation15,Citation17]. EBV gp350/220 is a viral glycoprotein, but the plasma membrane as well as the virus envelope is rich in it because the virus acquires its envelope at the plasma membrane [Citation1]. Therefore, 72A1 antibody is available for the staining of EBV-reactivated cells. We can consider 72A1(+) cells to be in the late phase of EBV reactivation.
In this way, we induced EBV reactivation in PBMCs, and detected approximately 4% of sample cells from both patients and controls that were 72A1-positive at day 12, considered to be in the late phase of EBV reactivation ().
The comparison with cells cultured at 37 °C showed that the induction of EBV reactivation by culture at 33 °C could stimulate TRAb production more efficiently ().
Observation through a confocal laser microscope revealed the green signal of 72A1 on the surface and inside of the cells (). In our previous study [Citation9], red spots of APC representing TRAbs were observed on the cell surface and somewhat in projections from the surface, but in the TRAb(+) 72A1(+) cells shown in , they were seen inside the cells. Immunoglobulins were not expressed on the cell surface when B cells differentiate to antibody-producing cells and the immunoglobulins remain inside.
Therefore, the sorted TRAb(+) 72A1(+) cells were thought to be antibody-producing cells with abundant cytoplasm, slightly deformed nuclei and TRAb spots inside. The staining of intracellular globulins usually requires a permeabilizing process of the cellular membrane, but the membrane of EBV-reactivated cells in the late phase becomes lytic [Citation1,Citation18], so fluorochromes can enter and stain the TRAbs inside.
We could detect TRAb protein in 33 °C culture fluids of PBMCs including the TRAb(+) 72A1(+) cells, which suggested that TRAb production and EBV reactivation occurred simultaneously. These observations are consistent with reports describing that terminal differentiation into plasma cells occurs with EBV reactivation [Citation10,Citation11]. We could not obtain sufficient PBMCs to investigate antibody production exclusively from 72A1(+) cells, or TRAb(+) 72A1(+) cells. Thus, in our next study, we are going to investigate this in detail using more cells.
The total amount of TRAbs detected during 33 °C culture was significantly higher (p < 0.05) in patients than in controls ().
We found TRAb secretion already at day 0, and considered the influence of cyclosporin A used in preculture. TRAb secretion at day 0 was observed in 10 patients and 5 controls, and the levels of TRAbs were significantly higher (p < 0.05) in patients than in controls (, ). These results show that PBMCs from patients secreted more TRAbs than those from controls in response to 33 °C culture or cyclosporin A, and suggest that PBMCs from patients are more sensitive to the stimulation of cyclosporin A as well as EBV reactivation by 33 °C culture than those from controls.
Cyclosporin A inhibits calcineurin, which is important in T-cell signal transduction [Citation19,Citation20] and thus is commonly used in B-lymphocyte culture in order to inhibit cytotoxicity from T cells [Citation12].
However, B cells are not always naive to cyclosporine A, and its stimulatory effect for EBV-induced cell transformation has been reported [Citation21]. Cyclosporin A has also been reported to block the EBV activation induced by immunoglobulin cross-linking [Citation22]. Although it requires more investigation, EBV reactivation at day 0 in our study suggests the influence of cyclosporine A to reactivate EBV.
While we previously reported the presence of TRAb(+)EBV(+) cells in PBMCs from Graves' disease patients and healthy controls, this study revealed that EBV reactivation by 33 °C culture of the precultured PBMCs including TRAb(+)EBV(+) cells induced TRAb release in culture fluids of PBMCs from Graves' disease patients and healthy controls.
These results support our hypothesis that the reactivation of persistent EBV in TRAb(+)EBV(+) cells would stimulate the host B cells to increase the production of TRAbs, and may cause the development or exacerbation of Graves' disease.
Supplementary material available online
Supplementary Figure 1.
Supplemental Material.pdf
Download PDF (35.8 KB)Acknowledgements
We thank Dr. Shuji Fukata (Kuma Hospital) and Professor Takeshi Sairenji (EM Research Organization) for their kind guidance and discussions. We also thank Medical English Service (Kyoto, Japan) for proofreading this manuscript.
Declaration of interest
The authors report no conflicts of interest. The authors alone are responsible for the content and writing of this paper.
References
- Kieff, E. D., and A. B. Rickinson. 2006. Epstein–Barr virus and its replication. In Fields Virology, 5th ed. Vol. 2. D. M. Knipe, and P. M. Howley, eds. Lippincott Williams & Wilkins, Philadelphia, PA. p. 2603–2654
- Rickinson, A. B., and E. Kieff. 2006. Epstein–Barr virus. In Fields Virology, 5th ed. Vol. 2. D. M. Knipe, and P. M. Howley, eds. Lippincott Williams & Wilkins, Philadelphia, PA. p. 2655–2700
- Davies, P., and T. Larsen. 2007. Thyrotoxicosis. In Williams Textbook of Endocrinology, 11th ed. H. M. Kronenberg, S. Melmed, K. S. Polonsky, and P. R. Larsen, eds. Saunders, Philadelphia, PA. p. 333–376
- Weetman, A. P., and A. M. McGregor. 1994. Autoimmune thyroid disease: further developments in our understanding. Endocr. Rev. 15: 788–830
- Tomer, Y., and A. Huber. 2009. The etiology of autoimmune thyroid disease: a story of genes and environment. J. Autoimmun. 32: 231–239
- Tomer, Y., A. Greenberg, G. Barbesino, et al. 2001. CTLA-4 and not CD28 is a susceptibility gene for thyroid autoantibody production. JCEM. 86: 1687–1693
- Ueda, H., J. M. M. Howson, L. Esposito, et al. 2003. Association of the T-cell regulatory gene CTLA4 with susceptibility to autoimmune disease. Nature 423: 506–511
- Nagata, K., S. Fukata, K. Kanai, et al. 2011. The influence of Epstein–Barr virus reactivation in patients with Graves' disease. Viral Immunol. 24: 143–149
- Nagata, K., K. Higaki, Y. Nakayama, et al. 2014. Presence of Epstein–Barr virus-infected B lymphocytes with thyrotropin receptor antibodies on their surface in Graves' disease patients and in healthy individuals. Autoimmunity 47: 193–200
- Crawford, D. H., and I. Ando. 1986. EB virus induction is associated with B-cell maturation. Immunology 59: 405–409
- Laichalk, L. L., and D. A. Thorley-Lawson. 2005. Terminal differentiation into plasma cells initiates the replicative cycle of Epstein–Barr virus in vivo. J. Virol. 79: 1296–1307
- Frisan, T., V. Levitsky, and M. Masucci. 2001. Generation of lymphoblastoid cell lone (LCLs). In Epstein–Barr Virus Protocols (Method in Molecular Biology), Vol. 174. J. Wilson, and G. H. W. May, eds. Humana Press, Totowa, NJ. p. 125–127
- Hinuma, Y., M. Konn, J. Yamaguchi, et al. 1967. Immunofluorescence and herpes-type virus particles in the P3HR-1 Burkitt lymphoma cell line. J. Virol. 1: 1045–1051
- Sairenji, T., and Y. Hinuma. 1980. Re-evaluation of a transforming strain of Epstein–Barr virus from the Burkitt lymphoma cell line, Jijoye. Int. J. Cancer 26: 337–342
- Sairenji, T., G. Bertoni, M. M. Medveczky, et al. 1988. Inhibition of Epstein–Barr virus (EBV) release from P3HR-1 and B95-8 cell lines by monoclonal antibodies to EBV membrane antigen gp350/220. J. Virol. 62: 2614–2421
- Kimura, H., K. Miyake, Y. Yamauchi, et al. 2009. Identification of Epstein–Barr virus (EBV)-infected lymphocyte subtypes by flow cytometric in situ hybridization in EBV-associated lymphoproliferative disease. J. Infect. Dis. 200: 1073–1087
- Hoffman, G. J., S. G. Lazarowits, and S. D. Hayward. 1980. Monoclonal antibody against a 250,000-dalton glycoprotein of Epstein–Barr virus identifies a membrane antigen and a neutralizing antigen. Proc. Natl. Acad. Sci. USA 77: 2979–2983
- Pellett, P. E., and B. Roizman. 2006. The family Herpesviridae: a brief introduction. In Fields Virology, 5th ed. Vol. 2. D. M. Knipe, and P. M. Howley, eds. Lippincott Williams & Wilkins, Philadelphia, PA. p. 2479–2499
- Liu, J., J. D. FarmerJr, W. S. Lane, et al. 1991. Calcineurin is a common target of cyclophilin-cyclosporin A and FKBP-FK506 complexes. Cell 66: 807–815
- Clipstone, N. A., and G. R. Crabtree. 1992. Identification of calcineurin as a key signaling enzyme in T-lymphocyte activation. Nature 357: 695–697
- Chen, C., T. D. Johnston, H. Jeon, et al. 2009. Cyclosporine promotes Epstein–Barr virus-infected human B-cell transformation assayed by three correlated assay methods. Transplant. Proc. 41: 366–370
- Bryant, H., and P. J. Farrell. 2002. Signal transduction and transcription factor modification during reactivation of Epstein–Barr virus from latency. J. Virol. 76: 10290–10298