Abstract
Methodologies have been developed, described and demonstrated that convert mouth exposure estimates of cigarette smoke constituents to dose by accounting for smoke spilled from the mouth prior to inhalation (mouth-spill (MS)) and the respiratory retention (RR) during the inhalation cycle. The methodologies are applicable to just about any chemical compound in cigarette smoke that can be measured analytically and can be used with ambulatory population studies. Conversion of exposure to dose improves the relevancy for risk assessment paradigms. Except for urinary nicotine plus metabolites, biomarkers generally do not provide quantitative exposure or dose estimates. In addition, many smoke constituents have no reliable biomarkers. We describe methods to estimate the RR of chemical compounds in smoke based on their vapor pressure (VP) and to estimate the MS for a given subject. Data from two clinical studies were used to demonstrate dose estimation for 13 compounds, of which only 3 have urinary biomarkers. Compounds with VP > 10−5 Pa generally have RRs of 88% or greater, which do not vary appreciably with inhalation volume (IV). Compounds with VP < 10−7 Pa generally have RRs dependent on IV and lung exposure time. For MS, mean subject values from both studies were slightly greater than 30%. For constituents with urinary biomarkers, correlations with the calculated dose were significantly improved over correlations with mouth exposure. Of toxicological importance is that the dose correlations provide an estimate of the metabolic conversion of a constituent to its respective biomarker.
Introduction
Risk assessment paradigms for chemical and/or particle exposure are applicable over a wide range of sources from occupational and environmental exposure to the use of consumer products. Tobacco smoke can be primarily considered as an inhalation exposure and represents a significant elective source of particle and chemical intake in the population, despite its well-documented adverse health effects. It also represents a significant exposure route to a complex chemical mixture, and thus there is a need to try to de-convolute and understand the dose and impact of individual constituents, before re-applying the risk assessment paradigm to the mixture. A risk assessment paradigm for inhalation exposure to ambient aerosols has been widely adopted and can be outlined as shown in (adapted from NRC, Citation1998). Tobacco smoke naturally fits into this paradigm with the simplification that the source segment is identified.
Figure 1. Risk assessment paradigm for inhalation exposure to ambient particles (adapted from NRC, 1998).
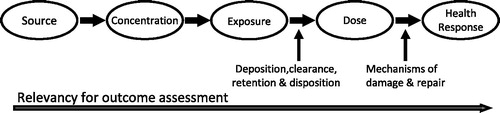
Machine-generated cigarette smoke has been the subject of intense analysis for many decades; but since fixed machine-smoking methods cannot predict actual human exposure, the analytical results from these analyses would lie within the concentration segment of the NRC risk assessment paradigm shown in . Exposure methods for cigarette smoke constituents have been developed and applied in human population studies, which improve the relevancy for outcome assessment by moving into the exposure segment of the paradigm. The detrimental health consequences of smoking have been documented with equivalent intensity by clinicians and would fall within the health response segment of . But the dose segment in the risk assessment paradigm remains to be quantitatively characterized and defined. We believe that the three methodologies that we present to allow exposure estimates to be converted to dose estimates are new to the literature. This topic is of potential current interest to academic, regulatory and industry scientists for current products as well as novel alternative products and may contribute to a more fundamental basis for science-based regulatory oversight.
We have attempted to re-state the smoking process in the context of the risk assessment model with dose being the primary outcome of this work. helps to clarify many of the terms used in this article and tie the smoking process to the risk assessment model. The action of smoking is a multi-phase event. When a smoker takes a puff on a cigarette, the smoke exits the smoking article and enters the front portion of the mouth. The puffing maneuver is similar to drinking a liquid through a straw. The lips seal around the article (cigarette or straw), and the tongue seals the front portion of the mouth by bending to contact the palate and the teeth. Suction is created by dropping the jaw while flexing the tongue backward (Rodenstein & Stănescu, Citation1985). Liquid or smoke, from the straw or cigarette, respectively, is then drawn into the isolated front portion of the mouth. For cigarettes, the mass of smoke and associated chemical constituents drawn into the front portion of the mouth is referred to as mouth-level exposure (MLE). Following the puff, the smoking article is removed from the lips, which can pull some of the undiluted smoke out as well. In addition, some or all of the undiluted smoke can be spilled out (consciously or not) or even blown from the mouth prior to inhalation. This is referred to as mouth-spill (MS). A portion of the constituents in smoke are also deposited in the mouth. The proportion retained is referred to as mouth retention (Baker & Dixon, Citation2006). The remaining smoke in the mouth is then inhaled into the respiratory tract with dilution by inspired air. Mean inhalation volumes (IVs) from numerous studies range from 649 to 841 mL with standard deviations of about 33% of the mean (St. Charles et al., Citation2009a and references therein). While in the respiratory tract, smoke constituents can be deposited by a combination of direct gas or vapor transport, evaporation from smoke particles and subsequent vapor transport to the mucous lining as well as direct deposition of smoke particles (Baker & Dixon, Citation2006). The remaining particles, stripped of some portion of the smoke constituents, are then exhaled. Respiratory retention (RR) is the fraction of a smoke constituent retained and has been reviewed by Baker & Dixon (Citation2006). For the purposes of this article, this includes both mouth and lung retention. It is noted that the morphometry of the lung and its constituent cell population changes significantly with increasing depth of volume from the oral cavity to the alveoli, where gas exchange occurs. This may have a further impact on bioavailability and kinetics but is beyond the scope of this analysis.
Figure 2. Disposition of smoke constituents from smoking article through the human body.
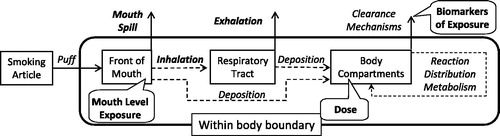
The smoke constituents deposited in the respiratory tract can then undergo any combination of reaction with the body fluids and tissues, distribution throughout the body or metabolism. Eventually, the constituents or their metabolites are eliminated from the body by a number of clearance mechanisms such as through urine, sputum, saliva and exhaled breath. Carbon monoxide, for example, diffuses unchanged from the lungs into the blood where it binds with hemoglobin to form carboxyhemoglobin. Over time, the carbon monoxide is released unchanged back into the lungs where it is exhaled. In contrast, nicotine enters the blood stream from the lungs where it undergoes metabolism in the liver to a well-characterized series of metabolites (Hukkanen et al., Citation2005; Tricker, Citation2006). Nicotine and metabolites are cleared from the body primarily in the urine. For the purposes of this article, the compounds deposited in the mouth and respiratory tract are considered to be the dose to the smoker as a whole. This is a simplification since the distribution and reaction of compounds within the respiratory tract, or even the human body, is not uniform. For example, smoke particulate deposition is more concentrated at bifurcations within the lung compared to the conducting airways (Martonen, Citation1992). As noted previously, this article does not consider this finer cut of localized dose or even generalized reaction with body tissues.
For population studies, the dose estimate should ideally be for smokers using their product in their everyday environment. Three methodologies are typically used to estimate the exposure of smokers to smoke constituents. One is the analysis of biomarkers in human body fluids or expired breath. A second involves puffing behavior measurement using a special cigarette holder with associated transducers to measure and record puff volume, duration and frequency. This is followed by using a smoking machine programmed to duplicate the recorded human puffing profile to estimate MLE. The third is the analysis of filters from smoked cigarettes (i.e. spent filters) and the calculation of MLE from the filter efficiency. These methods have primarily been used for estimating tar and nicotine exposure. The measurement of smoking behavior and the analysis of blood/plasma are usually carried out in a laboratory environment and are generally not practical for large population studies. In addition, laboratory studies have been shown to distort smoking behavior from normal use (Comer & Creighton, Citation1978; Ossip-Klein et al., Citation1983). However, an advantage of the measurement of smoking behavior with subsequent machine duplication is that it can be applied to any compound that can be measured in cigarette smoke. With the development of more portable versions of recording devices, ambulatory population studies may be more feasible (Hammond et al., Citation2005). The influence on smoking behavior would need to be determined.
For biomarkers, urine or saliva can be collected by the smoker in their everyday environment. This should have much less influence on smoking behavior than laboratory procedures and can be used for population studies. But, with one exception, none of the biomarker methods provide a quantitative estimate of the dose of a chemical compound to the smoker. This exception is the measurement of nicotine plus metabolites in 24-h urine samples. Nicotine, plus the 5–9 metabolites routinely measured in 24-h urine samples, can account for 80–90%, respectively, of the nicotine dose (Benowitz et al., Citation1994; Hukkanen et al., Citation2005). The five metabolites that account for 80% of the dose are nicotine glucuronide, cotinine, cotinine glucuronide, trans-3′-hydroxycotinine and trans-3′-hydroxycotinine glucuronide. The other four metabolites that account for the additional 10% of the dose are nicotine-N-1′-oxide, cotinine-N-1-oxide, nornicotine and norcotinine. Given this degree of mass balance, the daily nicotine dose can be quantitatively estimated from 24-h urine samples, and the urine collection can be adapted to population and ambulatory studies.
Other urinary or salivary biomarkers for other chemical species do not provide quantitative estimates of dose. This can be due to factors such as half-life of the biomarker, individual variations in metabolism of the compound to the biomarker, environmental exposure to the compound through diet or other sources or even multiple compounds being metabolized to the same biomarker. If the background level of a biomarker is appreciable compared to the level formed from exposure to smoke, the relative difference in exposure from differing products will be much larger than the ratio of biomarkers would indicate. For example, in Shepperd et al. (Citation2009), the mean 24-h urinary 1-hydroxypyrene (a biomarker for pyrene) level for non-smokers was between 24 and 51% of the mean level for the different smoker groups measured. In addition, biomarkers are only available for a limited number of the constituents found in cigarette smoke.
The analysis of filters from human-smoked cigarettes allows estimates of MLE to compounds in cigarette smoke (see e.g. St. Charles et al., Citation2009b for a detailed description of methodology). The basic premise it that the amount of a given constituent or surrogate compound deposited on the mouth-end of a cigarette filter is proportional to the amount of a constituent entering the mouth. Typical surrogates measured from the filter include ultraviolet absorbance of filter extracts, nicotine and solanesol (Polzin et al., Citation2009; St. Charles et al., Citation2009b). MLE using filter analysis has also been estimated for a number of compounds in cigarette smoke besides tar and nicotine. Moldoveanu et al. have estimated the MLE for a number of compounds including 8 carbonyl compounds (Moldoveanu et al., Citation2007), 20 polycyclic aromatic hydrocarbons (Moldoveanu et al., Citation2008a), 26 hydroxybenzenes (Moldoveanu et al., Citation2008b), benzene and toluene (Moldoveanu et al., Citation2008c) and solanesol (Moldoveanu & Coleman, Citation2008a,Citationb, Citation2009). Biomarkers are not available for the majority of these compounds. Linear regressions of the smoke yields of these compounds with the amount of nicotine on a 1-cm portion of the filter tip gave R2 values greater than 0.95 except for three of the compounds, which had R2 values of 0.92. MLE has also been estimated for tobacco-specific nitrosamines (TSNAs; Ashley et al., Citation2010; Morin et al., Citation2011; Polzin et al., Citation2009; Shepperd et al., Citation2009, Citation2011); acrolein and pyrene (Morin et al., Citation2011; Shepperd et al., Citation2009, Citation2011); and benzo[a]pyrene (Ding et al., 2012). Clearly, this method has the potential to be expanded to just about any compound of toxicological interest. Furthermore, since the method only requires the analysis of filters from smoked cigarettes, MLE estimates can be made for smokers using their product in their everyday environment. However, the MLE only gives an upper limit to toxicant dose estimation since, as described previously, constituents can be spilled from the mouth prior to inhalation as well as exhaled.
Exposure measurements are converted to dose by considering additional loss mechanisms such as smoke spilled from the mouth prior to inhalation and the RR of individual volatile, involatile and semi-volatile components of the smoke mixture.
Knowledge of the RR of a compound, combined with an estimate of MS, allows an estimate of the dose (i.e. mass of a given compound retained in the body) to be calculated from the MLE according to the equation:
The methodologies described in this article allow conversion of MLE to dose. Two separate factors need to be determined to allow this conversion; the RR and the MS. The methods to determine both of these factors will be described and demonstrated.
First, a method is described that allows an estimate of the RR of smoke constituents. The manuscript reviews prior literature on lung deposition and retention of cigarette smoke constituents and then synthesizes this knowledge base by utilizing the vapor pressure (VP) of the pure compound to develop a general model that offers reasonable prediction of the retention data. In actuality, the VP of a pure compound is almost assured to be different from the actual VP of that compound in the complex mixture of smoke. However, since the logarithm of the VP is used for the model, this gives an order of magnitude measure of the volatility of a given constituent relative to the other constituents. This approach will be shown to be sufficient to estimate RR. The estimated RR represents a mean value for a population that is constituent specific.
Second, a method is described that allows MS (i.e. the amount of smoke spilled from the mouth prior to inhalation) to be calculated for a given subject. The method uses difference between the individual subject estimates of the MLE of nicotine from filter analysis and the nicotine dose calculated from nicotine and metabolites measurements from 24-h urine samples. Finally, the data from two previously published clinical studies (Morin et al., Citation2011; Shepperd et al., Citation2009) will be used to demonstrate the use of the methodologies by estimating the dose for 13 compounds, of which only 3 have urinary biomarkers. Where these urinary biomarkers do exist, the correlations of the biomarkers with calculated dose are compared to previous correlations with MLE. Improvements in the correlations of biomarkers with dose, compared to correlations with MLE, would indicate that MS is a source of variability that has been accounted for.
Methods
Respiratory retention model
RR is the difference between inhaled and exhaled smoke expressed as a percentage and represents the percentage of a smoke component remaining in the respiratory tract. To estimate RR, measurements need to be made of the mass of a compound inhaled and the mass exhaled. The mass inhaled is estimated by a secondary method since a direct method would require sampling prior to inhalation, which could perturb either behavior or smoke particle size. The mass exhaled can be measured directly. Methods for measuring MLE using both filter analysis and puff profile duplication were described in the Introduction.
The measurement of RR is not a precise method. The secondary method for estimating inhaled mass involves the combination of multiple measurements and therefore is subject to propagation of errors. In addition, a result based on the difference in two numbers is an experimental methodology that is best avoided, but for RR, it is a necessity. However, the largest source of variability is subject-to-subject variability. Most experiments use a small number of subjects. Sources of variability include natural differences in inhalation patterns as well as the potential for MS of smoke after puffing and before inhaling. Corrections also need to be made for endogenous breath volatile organic compounds (VOC’s) being exhaled by the subjects in order to keep from being apportioned as coming from smoke. Normal breath includes many VOCs including isoprene, aldehydes, ketones and hydrocarbons (Karl et al., Citation2001; Phillips et al., Citation1999). Research into the compounds in breath form a field unto itself (see e.g. Journal for Breath Research).
The method chosen for modeling the RR as a function of the logarithm of VP allowed for averaging to minimize variability. RR values were compiled from the literature. VP data for each compound at 25 °C were then compiled from the literature sources as detailed below. The log (VP) values were then rounded to one significant figure (i.e. VP was rounded to the nearest order of magnitude) to form a group, which allowed averaging for multiple compounds from multiple studies. The exception to this was for nicotine where the actual log (VP) of 0.7 (Norton et al., Citation1940; SRC PhysProp database), rounded to one significant figure, was used. The reason for this was that there have been multiple studies that measured the retention of nicotine. The group that contained retention data with a rounded log (VP) = 1 was the most heavily weighted with 27 data points of which 11 were for nicotine and the rest were for 16 other compounds. Since there were so many measurements for nicotine, this was used as an individual group for averaging, and the retention data for the other 16 compounds were averaged with the log (VP) = 1 group. Once the groups were formed, the actual log (VP) values for a given group were averaged as well as the retention values.
Retention data sources
The seven articles by Moldoveanu et al. (Citation2007, Citation2008a,Citationb,Citationc) and Moldoveanu & Coleman (Citation2008a,Citationb, Citation2009) contributed the greatest number of compounds. Other references used were results by Armitage et al. (Citation2004a,Citationb), Ingebrethsen (Citation1989) and Feng et al. (Citation2007). Retention data for two of the studies reviewed in Baker & Dixon (Citation2006) were also used. One was the Hazelton study (Richardson, Citation1986), which had a unique design. Retention was measured for four different cigarette types (blend and yield) to which three alkanes with carbon chain lengths of 16, 22 and 32 had been added. This covered a range of VP for which little data were available. The other was the study on solanesol retention by Frost et al. (1987), which provided additional data to probe the effect of IV and breath-hold (BH) time on retention of this non-volatile compound. The vapor phase retention data from Feng et al. (Citation2007) were not used because only 50 mL at the end of exhalation was sampled to estimate a value for the total amount of vapor phase compounds exhaled. Although retention data for a great number of compounds were presented in Moldoveanu & St. Charles (Citation2007), these were not used because the results were only considered semi-quantitative due to the method of estimating the mass inhaled. In addition, many of the early studies on retention reviewed by Baker & Dixon (Citation2006) were not used because the method for determining inhaled mass was either not specified or based on machine yields.
Vapor pressure data sources
The following online databases were primarily used for VP data; Chemspider, ESIS (including IUCLID Data Sheets), OECD SIDS, INCHEM, NIOSH, NIST Chemistry Webbook, SRC, The Good Scents Company and TOXNET. Other sources included an ATSDR (Citation1995) monograph on polycyclic aromatic hydrocarbons, Montgomery & Welkon (Citation1990), Chickos & Handshaw (Citation2004), Norton et al. (Citation1940), Site (Citation1997), and Tatavarti et al. (Citation2002). VP at 25 °C was used. It was discovered that published VPs for a given compound could vary significantly. Therefore, at least two sources with similar VPs were required before the data were considered reliable. If no data were available, the SIMPOL.1 group contribution method (Pankow & Asher, Citation2008) was used to estimate a VP. This was also used to check published VPs when only one value could be found or if two widely varying values were found. The VP of solanesol is so low that it was calculated. A value of 10−15 Pa was calculated using the SIMPOL.1 method, and a calculated value of 10−19 Pa was from the Chemspider, predicted/ACD Labs tab. A log (VP) = −17 was used for this compound.
Vapor transport region
For VPs ≥ 10−5 Pa, a linear regression was calculated for retention as a function of log (VP) for the pooled data. The regression had a R2 = 0.758, and both coefficients were significant (p < 0.0003). The equation is shown below.
Particulate retention
Solanesol is an extremely non-volatile compound found in tobacco and other solanaceae. In spite of the low volatility at room temperature, it is also found in cigarette smoke. Because of the low volatility, it has been used to represent the non-volatile particulate portion of smoke in RR experiments (Baker & Dixon, Citation2006). There have been two types of experiments published with solanesol retention data. In one type, the subjects used their natural inhalation pattern (Moldoveanu & Coleman, Citation2008a,Citationb,Citationc). In the other, the subjects performed inhalation maneuvers with controlled IV and BH times (Armitage et al., Citation2004a,Citationb; Frost et al., Citation1988). For the controlled experiments, measurements were made at differing IVs, all with a 2-s BH, and also with differing BH times, all at a 500 mL IV. These results from the literature are summarized in . Solanesol retention does not increase appreciably with IVs between 75 and 250 mL and then increases with increasing IV. The BH time significantly affects retention. The wide range of retention values shown in reflect these controlled experiments with wide ranging inhalation factors, ranging from 49% for a 75 mL IV, 2-s BH to 88% with a 500 mL IV and 10-s BH. As would be expected, these data show that both IV and respiratory residence time are significant contributors to particulate retention. This is consistent with sedimentation and diffusion being the principal deposition mechanisms for a sub-micron sized aerosol (ICRP, Citation1994).
Table 1. Solanesol retention for studies with controlled inhalation volume and breath-hold times.
The data from the controlled experiments were used to calculate a multiple regression for solanesol retention as a function of BH and IV according to the equation:
The coefficients were all statistically significant (p < 10−4) with A = 45%, B = 3.26%/s and C = 0.0221%/mL. The R2 value was 0.84, and the standard error of prediction was 4.5% retention. shows the calculated values from this multiple regression. The calculated retention increases slightly for the low IV, whereas experimentally, this was not differentiated. Overall, given the precision of retention measurements and the small number of subjects, the regression appears acceptable. It is unfortunate that the total lung exposure time was not measured in these experiments as it may have been a more relevant measure than BH. For validation, the regression was used to estimate the natural solanesol retention values reported by Moldoveanu & Coleman (Citation2008a,Citationb, Citation2009). Since respiratory measurements were not reported in the studies, a 1-s BH time was estimated due to the time lag in the experiment for the subjects to place the exhalate collector to their lips after inhalation. Since IV was not measured, the value chosen was the average of 833 mL± 1 standard deviation (279 mL) from a separate study of 74 subjects smoking their own brands (St. Charles et al., Citation2009a).
Transition region between vapor transport and particle deposition
For VPs between 10−5 and 10−7 Pa, the retention can be interpolated. Compounds that fall into this VP range (log VP, measured retention in parentheses) include chrysene (−6.08, 84%), benzo[e]pyrene (−6.12, 77%), benzo[a]pyrene (−6.13, 72%), perylene (−6.29, 70%) and benzo[b]fluoranthene (−6.30, 63%). As can be seen, the measured retention drops significantly across this small VP range. Chrysene, with a VP of 8.3 × 10⁻⁷ Pa had a retention similar to the vapor transport compounds while benzo[b]fluoranthene with a VP of 5.0 × 10⁻⁷ Pa had a retention similar to the non-volatile compounds (Moldoveanu & Coleman, Citation2008a).
Estimation of semi-volatile retention at different inhalation parameters
For retention estimates at other than the baseline IV of 833 mL, the following scaling technique can be applied as shown below. (1) The particulate retention is calculated using the multiple regression shown in Equation (3). (2) A scaling factor is calculated for the retention difference relative to the baseline 67% and 100%. (3) The baseline retention is calculated for compounds with log (VP) ≥ −5.0 using the linear regression Equation (2). (4) The scaling factor is applied to the baseline retention for compounds with log (VP) ≥ −5.0. Finally, interpolate if needed between 10−5 and 10−7 Pa. An example is shown for pyrene retention (VP =5.4 × 10⁻⁴ Pa, log (VP) = −3.27) (ASTDR, 2009, Site, Citation1997, SRC) with an IV of 1250 mL and no BH.
Particulate retention = 45% + (3.26%/s × 0 s) + (0.0221%/mL × 1250 mL) = 73%
Scaling factor relative to baseline = (100% − 73%)/(100% − 67%) = 0.82
Baseline retention for pyrene = 100% × [0.0100 ×(−3.27) + 0.929] = 89.6%
Scaled retention for pyrene = 100% − [(100% − 89.6%)× 0.82] = 91.5%
As can been seen from this example, a change in IV of greater than 50% from baseline only increased the calculated pyrene retention by about 2%. This implies that compounds with VPs > 10−5 Pa are relatively insensitive to IV, and inhalation maneuvers only affect the retention of the non-volatile compounds in any appreciable manner.
Mouth-spill estimation
To demonstrate the methodology for determining MS, data were used from two different clinical studies conducted in Canada and Germany (Morin et al., Citation2011; Shepperd et al., Citation2009). Both studies were conducted in accordance with the World Medical Association Declaration of Helsinki (World Medical Association, Citation2008). Protocol and informed consent forms were approved by an Institutional Review Board or Ethics Committee. For these studies, subjects were admitted to the clinic for two 2-day periods. Three different smoker groups were included in each study segregated by the International Organization for Standardization (ISO) tar yield of their usual product, with about 50 subjects per group. The subjects smoked a product with the equivalent ISO tar yield of their usual brand, but it was not necessarily their usual brand.
During each 2-day clinical admittance period, filters from smoked cigarettes were collected for the estimation of daily nicotine MLE for each subject in the study. Simultaneously, 24-h urine samples were collected from each subject for measurement of urinary nicotine plus the five metabolites: nicotine glucuronide, cotinine, cotinine glucuronide, trans-3′-hydroxycotinine and trans-3′-hydroxycotinine glucuronide. The mass of the metabolites were converted to nicotine mass equivalents by multiplying by the molecular weight of nicotine (162.1 g/mol) and dividing by the molecular weight of the metabolite. Then, for each subject, the nicotine equivalents were summed with the urinary nicotine to give total urinary nicotine equivalents. The total nicotine equivalents (TNE) represented by nicotine plus these five metabolites have been reported to account for about 80% of the nicotine dose retained (Benowitz et al., Citation1994; Hukkanen et al., Citation2005). Equation (4) shows the relationship between urinary TNE and nicotine dose (Dose) where Fmetab represents the fraction of nicotine dose accounted for by the urinary TNE (0.80 in this instance). Equation (5) is a rearranged version of Equation (4), which allows calculation of nicotine dose from urinary TNE.
Substituting Equation (5) for Dose into Equation (1) and rearranging gives the following relationship for MS.
The mean RR for nicotine from four studies (Armitage et al., Citation2004a,Citationb; Feng et al., Citation2007; Ingebrethsen, Citation1989) was 98% for inhaling subjects. Using the 24-h urinary TNE and daily nicotine MLE for each subject in the clinical studies, combined with a nicotine RR of 98%, Equation (6) was used to calculate the MS for each subject in the clinical studies. Due to the half-life of the nicotine metabolites, the 24-h urinary TNE essentially represents a 2-day moving average of nicotine dose (St. Charles et al., Citation2006). Therefore, the TNE from the second day in the clinic was used to negate the unknown exposure from the day prior to entering the clinic. Ideally, the MLE would be averaged for 2 days for comparison with the TNE from a 24-h urine collection from the second day. Because of the experimental design of the clinical studies, this calculation was performed and compared to the use of MLE and TNE from a single day. Method 1 for the MS calculation used the average MLE for 2 consecutive days combined with the urinary TNE for the second day. Method 2 for the MS calculation used the MLE and urinary TNE for only the second clinical day.
Dose estimation
Mouth-level exposure
In the previously published results of the two clinical studies (Morin et al., Citation2011; Shepperd et al., Citation2009), MLE of the biomarker precursor in smoke was correlated to urinary biomarkers for the following compounds: acrolein MLE to urinary hydroxypropyl mercapturic acid (HPMA), 4-(methylnitrosoamino)-1-(3-pyridyl)-1-butanone (NNK) MLE to urinary 4-(methylnitrosamino)-1-(3-pyridyl)-1-butanol (NNAL)+ NNAL glucuronide (German only) and pyrene MLE with urinary 1-hydroxypyrene + 1-hydroxypyrene glucuronide. For the Canadian clinical study, the smoke yields of NNK were below the quantitation limit for many of the calibration regimes so a reliable correlation could not be made. The carbonyl analytical method used for acrolein MLE determination for the correlations with biomarkers also gave results for formaldehyde, acetaldehyde, propionaldehyde, butryaldehyde, crotonaldehyde, acetone and methyl ethyl ketone, which were not needed for the correlations in the published studies. Other than crotonaldehyde, these compounds either do not have urinary biomarkers or have a significant contribution from carbohydrate and/or alcohol metabolism. In a similar manner, the analytical method for NNK also gave results for N-nitrosonornicotine (NNN), N-nitrosoanabasine (NAB), and N-nitrosoanatabine (NAT). Pyrene analysis was for the single compound. Since data were available for the additional analytes described above, the MLEs to these additional analytes were calculated in the same manner as the MLE for the published analytes. The analytical methods and method for calibration of smoke yields to filter tip nicotine is exactly the same as described in Morin et al. (Citation2011) and Shepperd et al. (Citation2009) since the data were from the same analyses of the same samples.
Calculation of dose
For each subject, the MS was calculated as described previously, and the MLE for each compound was calculated. Then, for each compound, the RR was calculated from the literature value of the VP at 25 °C for that compound using the RR model. Then for each subject, the dose was calculated using Equation (1).
Data analysis
Since only simple statistical calculations were involved (averages, standard deviations, medians, regressions and paired t-tests), all data analysis was performed using Microsoft Excel with the Analysis ToolPak Add-In (Microsoft Corp., Redmond, WA).
Results
Respiratory retention
Overall trend
shows a plot of the RR versus the log (VP) where the VP is expressed in Pa. A total of 124 individual data points are shown, which represents 62 different chemical compounds. These are shown using the diamond symbols, and the non-rounded log (VP) was used for the x value. The VP of the compounds spanned about 21 orders of magnitude, ranging from 5 × 10⁵ Pa for formaldehyde to ∼10−17 Pa for solanesol. This covers an approximate VP range of one atmosphere to the pressure of interstellar space. The average retention values for each order of magnitude group of VP are shown in the solid squares. Notice that the pattern resolves into a sigmoid shape as the variability is averaged. There are a range of compounds with VPs of 10−5 Pa and above with average RR at 86% or greater. For these compounds, retention decreases slightly as VP decreases over 10 orders of magnitude. For VPs between 10−5 and 10−7 Pa, there is a rapid drop in retention. Then for VPs of about 10−7 Pa and below, the retention is mainly in the 50–70% range.
Figure 3. Respiratory retention versus log (vapor pressure). Individual data points shown as open diamonds. Solid squared are averages grouped by log(VP) rounded to an integer. The circled data are for solanesol.
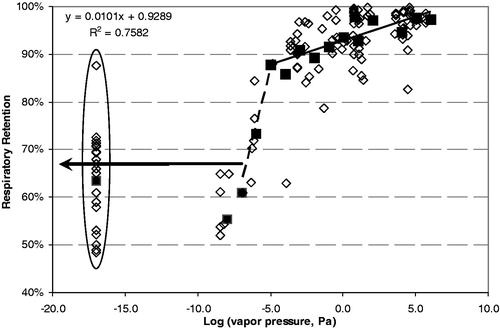
The compounds with VPs of 10−5 Pa and higher must certainly fall into the category where deposition is due to both a mechanism of vapor transport between the smoke particles and the respiratory tract as well as particle deposition (Baker & Dixon Citation2006). Ingebrethsen (Citation2006) has published a model based on vapor transport, which effectively explains the RR results for nicotine. The regression line for these compounds is shown in as well.
Solanesol retention
The individual retention data for solanesol, circled and shown at a log (VP) of −17, cover a wide range from 49% to 88% retention. The compounds with VPs below 10−7 Pa also appear to fall into this category. For perspective, vacuum greases made for laboratory applications have VPs of around 10−7 Pa and below (Apiezon, Citation2011), so it is unlikely that there would be any vapor transport from the smoke particles for such non-volatile compounds. The multiple regression equation (Equation (3)) shows that solanesol retention is strongly influenced by both IV and BH time. This wide range of retention in is a result of the controlled experiments on IV and BH time. BH time can be seen as a measure of lung exposure time.
Validation of solanesol retention equation
The mean RR for solanesol for the seven products from the three studies by Moldoveanu & Coleman (Citation2008a,Citationb, Citation2009) was 68% with a study range of 59–71% for the different products. The calculated solanesol retention was 67% using a BH time of 1 s and an IV of 833 mL (St. Charles et al., Citation2009a) in Equation (3). This matches within 1% of the mean solanesol retention for all products measured in the three natural inhalation studies. The calculated retention values for ± 1 standard deviation of the St. Charles et al. (Citation2009a) IV gave solanesol retention values of 73% and 61%, respectively. This covers the range of solanesol retention for the individual products in these studies. This adds validity to the use of the Equation (3) for estimation of particulate retention. These calculated solanesol values are similar to the retention results of Richardson (Citation1986) for dotriacontane (log (VP) = −8.5; Chickos & Handshaw, Citation2004) with subjects smoking their own brand (61%) and Winston (65%) with natural inhalation. From , it appears that for a log (VP) of −7 and below, retention is solely based on particulate deposition with no vapor transport. For a baseline IV taken as 833 mL, this can be considered constant at about 67% as indicated by the bold horizontal arrow in . One possibility for converting from BH to total lung exposure time would be to uses the average lung exposure time of 4.1 s from St. Charles et al. (Citation2009a) to represent a zero BH time.
Respiratory retention value for dose calculation
The estimated RR values for compounds used to estimate dose are shown in along with means and standard deviations for measured values where available. Note that all carbonyls have a high VP, and the calculated RR is greater than 96%, so the effect of IV and lung exposure time would be negligible. Even for the much less volatile TSNA’s and pyrene, the effect of variation in IV and lung exposure time would not have great effects on dose estimation. As shown in the calculation above, increasing IV by approximately 50% increases the retention for pyrene by only 1.9%. The differences between the calculated and measured values for the carbonyls were small with the greatest difference being for acetone. Acetone is a normal breath VOC, and Moldoveanu et al. (Citation2007) measured the background acetone exhalation for two subjects. They reported that the level was less than 2 μg for eight exhalations and did not use the correction in the retention calculations. Using this for a correction would only increase retention results by about 1%. But note that the standard deviation for acetone retention is the highest for all carbonyls. This could indicate that background acetone varied between subjects. In practical terms, however, the retention for all carbonyls was very high, and differences should have very little influence on the calculated dose. The largest difference between calculated and measured retention values were for NNK, which had the lowest VP.
Table 2. Calculated respiratory retention for compounds used to estimate dose.
Mouth-spill
shows the statistics for the MS calculations for subjects from the two clinical studies. As described in the Methods section for MS, two methods were used for the calculation although results are similar. Method 1 (labeled 1 in the table) used the average MLE for 2 consecutive days along with the urinary TNE for the second day. This was considered the preferred method since the urinary metabolites represent about 50% of the exposure from the previous day (St. Charles et al., Citation2006). Method 2 (labeled 2 in the table) used both the MLE and urinary TNE for the second clinical day only. A paired t-test showed that the methods were significantly different (p < 10−7) but highly correlated with a Pearson’s correlation coefficient of 0.94. Average values and standard deviations for Method 1 were slightly smaller than Method 2, but practically, the differences were minor. A histogram for the MS is shown in for the preferred Method 1 calculation. The distribution appears normal for both studies with the largest populated bin centered on 30% MS (>25% to ≤35%). For both studies, the calculated MS was slightly greater than 30% for both the average and median. The mid quartiles ranged from 20 to 45%. Differences in within-subject MS between the two clinical periods averaged −1.4% (median = 0%) with a standard deviation of 17%. The 25th percentile of within-subject difference was −9.6%, and the 75th percentile was 8.1%. This implies that for group studies, multiple samples of filters for MLE could be used to calculate dose with a single characterization of a subject’s MS level.
Figure 4. Histogram of estimated mouth-spill from subjects in Canadian and German clinical studies.
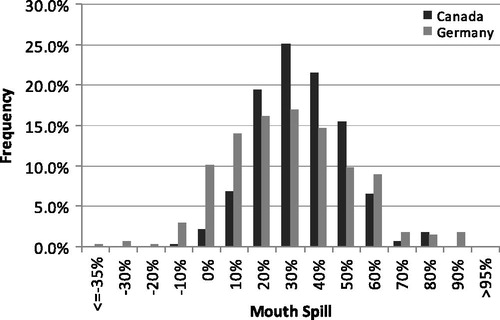
Table 3. Mouth-spill calculated by two methods for subjects in two clinical studies. Two replicates for 139 subjects in each study.
Dose estimates
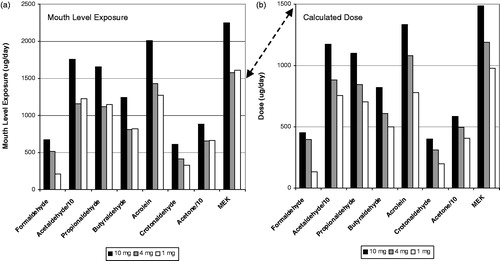
shows the carbonyl results for the German clinical study for MLE () and estimated dose (). The results for acetaldehyde and acrolein were divided by a factor of 10 to keep the scaling on the graphs similar. Notice that the scale for the y axis changes between MLE and dose due to inclusion of MS, and secondarily RR, for the dose calculations. This is indicated by the double arrow. The MLE for the smokers of the 10 mg ISO tar product was noticeably higher that the MLE for the smokers of the products in the lower tar bands. However, there was little difference between the MLE for smokers of the 4 mg and 1 mg ISO tar products. When dose is calculated, there is a noticeable separation between the three tar band products with a rank order corresponding to the ISO tar.
Figure 5. Carbonyl mouth level exposure (a) and dose (b) for the German clinical study.
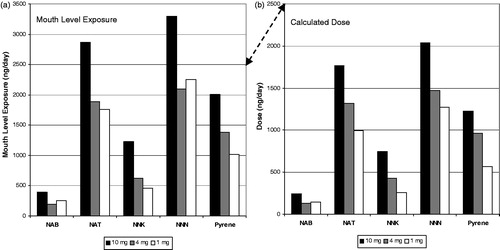
The results for the TSNA’s and pyrene for the German clinical study are shown in a similar manner in . In this case, the MLE showed a rank order effect with ISO tar band for NAT, NNK and pyrene but not for NAB and NNN. When MS and RR were taken into account to calculate dose, all compounds except for NAB showed an even stronger rank order effect with ISO tar band. The differences in the rank order effect between MLE and dose are due to the MS calculated for each individual subject. The same RR factor was applied for each specific compound across all subjects.
Figure 6. Tobacco-specific nitrosamine and pyrene mouth level exposure (a) and dose (b) for the German clinical study.
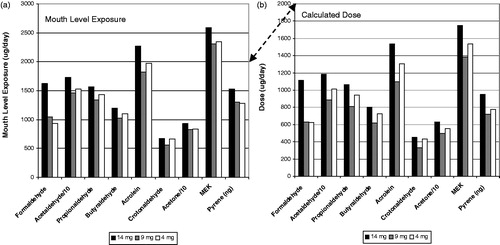
The results for the Canadian clinical study are shown in a similar format in for carbonyls and pyrene. Notice that there is similar rank order effect for MLE as with the German clinical study. The highest ISO tar band product had the highest MLE but the two lower ISO tar band products had similar MLE. However in this study, the calculated dose estimates did not resolve into a rank order profile with ISO tar band. Because of the MS estimates for the subjects, the dose for the 4 mg ISO tar band product was higher than the 9 mg tar band product for most of the compounds.
Figure 7. Carbonyl and pyrene mouth level exposure (a) and dose (b) for the Canadian clinical study.
Correlation with biomarkers
One of the primary objectives of the German and Canadian clinical studies was to determine the correlation of MLE with urinary biomarkers of exposure. Since MS could vary between subjects, the correlations should improve when this variable is taken into account. In addition, by including RR into the dose calculation, the slope should provide an estimate of the overall conversion of the compound into the urinary metabolite. Since the correlations do not depend on the product, and only compare either the amount of the specific compound that either enters the mouth (MLE) or is retained by the smoker (dose), it should not matter that there are extreme product differences between the German (blended with additives) and Canadian (flue-cured with no/minimal additives) markets. For this reason, the results of both clinical studies and all products within the studies were combined. However, the data points for the two studies are differentiated in the following figures for comparison purposes.
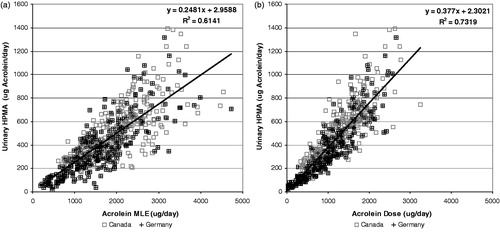
shows the correlations between (a) MLE and (b) dose of acrolein with the urinary HPMA converted to acrolein molar equivalents. The axes of the two graphs were kept the same to allow a direct visual comparison. Even though the correlation of MLE to HPMA is very strong with a R2 of 0.61, by taking MS into account, the R2 for the correlation with dose improves to 0.73. The improvement in correlation with dose is visually apparent with the data points clustering much closer to the regression line. The intercept is small for both the MLE and dose correlations relative to the exposure due to smoking, which implies that the contribution due to environmental exposure is small. The slope of urinary acrolein versus calculated dose implies that about 38% of the acrolein dose is metabolized into urinary HPMA. The results from the Canadian and German studies appear equally scattered about the regression line, which demonstrates that the dose calculation is reasonable even though the blend style of the products in the two markets are extremely different.
Figure 8. Correlation of urinary HPMA (expressed as acrolein equivalents) with acrolein MLE (a) and Dose (b).
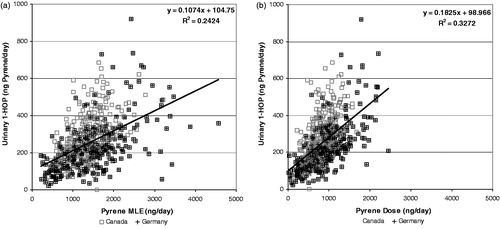
shows the correlations between MLE (a) and dose (b) of pyrene with the urinary biomarker 1-hydroxypyrene converted to molar pyrene equivalents. In this case, there is a much weaker correlation than with acrolein to urinary HPMA. The correlation with dose (R2 = 0.33) was improved over the correlation with MLE (R2 = 0.24). Also notice that the intercept represents a significant proportion of the urinary pyrene equivalents, which indicates environmental exposure. In the German and Canadian clinical studies, the mean urinary 1-hydroxypyrene for non-smokers was 79 and 91 ng/day (73 and 84 ng pyrene equivalents/day), respectively. The slope of urinary pyrene versus dose implies that about 18% of the pyrene dose is metabolized into urinary 1-hydroxypyrene.
Figure 9. Correlation of urinary 1-hydroxypyrene (expressed as pyrene equivalents) with pyrene MLE (a) and Dose (b).
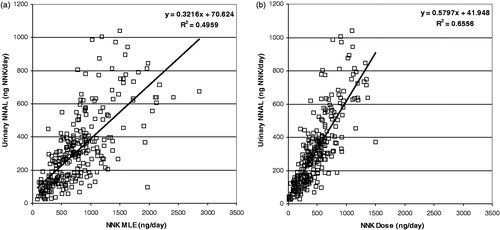
shows the correlations of (a) MLE and (b) dose of NNK with the urinary biomarker Total NNAL (NNAL + glucuronide) converted to molar NNK equivalents for the Germany clinical study. As stated in the Methods section, the NNK smoke yields of the Canadian cigarettes for many of the calibration smoking regimes were below the quantitation limit, which did not allow a satisfactory calibration curve to be constructed. As can be seen, the correlation of urinary NNK equivalents with dose was noticeably improved over the correlation with MLE. The MLE correlation was reasonable with about 50% of the variation in urinary NNK equivalents explained by MLE. However, the dose correlation was improved substantially over the correlation with MLE, with the R2 indicating that about 66% of the variation in urinary NNK equivalents was explained by the calculated dose. The slope indicates that about 58% of the NNK dose was metabolized into urinary total NNAL.
Figure 10. Correlation of urinary total NNAL (NNAL + glucuronide expressed as pyrene equivalents) with pyrene MLE (a) and Dose (b).
Discussion
Respiratory retention
The methodology used to estimate RR was based on averages from a number of studies. It is highly likely that as further studies are performed with improved methodologies, the model could be revised. The differences due to VP have been attributed to a combination of both vapor transport and particulate deposition for compounds with VPs greater than 10−5 Pa, particulate deposition alone for compounds with VPs less than 10−7 Pa, with a steep transition region between 10−5 and 10−7 Pa. Very little data were available near the transition region, so this could change significantly with further measurements. A notable exception was also noted for the retention value of 63 to 84% published by Feng et al. (Citation2007) for NNK (log(VP) = −3.9). The VP model predicted NNK retention of 89% (). One possibility is that with nicotine and the high moisture on exhalate collection pads, microbial or chemical action could convert a very small fraction of the nicotine (on the order of 0.1%) to NNK. Clayton et al. (Citation2010) found that NNK increased on cigarette filters with storage after smoking. Due to the nature of the retention calculation, a small increase in NNK on the filter could lead to a large decrease in the calculated retention. However, for practical considerations in estimating dose for toxicological purposes, the difference should not be of major consequence and at least errs on the conservative side. For toxicological purposes in estimating dose, a RR of around 93% for all compounds with a VP ≥ 10−5 Pa may prove adequate since differences of ±5% would be negligible in toxicity calculations. Differences in inhalation maneuvers (volume, lung exposure time) only appear to affect the retention of non-volatile compounds and have a minor effect on compounds with a VP ≥ 10−5 Pa.
The RR for non-volatile compounds such as solanesol appears to be high. However, a portion of the solanesol retention can be accounted for by the few experiments on mouth retention by Armitage et al. (Citation2004a,Citationb) and Frost et al (Citation1988) as well as the results by Mullard shown in Baker & Dixon (Citation2006). Values for mouth retention ranged from 25 to 35%. This value in itself may seem high. However, considering the puffing maneuver, it may be explainable. The smoke exiting from a cigarette exhibits a very laminar flow. As described in the Introduction, the tongue is almost perpendicular to this flow stream as the cigarette is being puffed. This laminar smoke stream then collides with the tongue surface and has to be turned 90 degrees or more. This may lead to impaction against the tongue and induce turbulence against the mouth giving high particulate deposition. However, at this point, the explanation is only conjecture until shown experimentally. When Equation (3) is extrapolated to a zero BH and IV, the estimated solanesol retention is 45%. This overestimates the published values for mouth retention considerably and indicates that the statistically derived equation is unsuitable for extrapolation.
Mouth-spill
There were a few negative values for MS, which would be physically impossible. This could have been due to variability in analysis or possibly an effect of metabolic variation. For example, one of the negative values was for a subject with urinary nicotine (including glucuronide) consistently making up about 30% of the total metabolites versus typical values of 14% (Benowitz, Citation1994), possibly indicating a slow metabolism and the potential for the urinary metabolites being based on many days exposure. Another negative value was for a subject in the fifth percentile of nicotine exposure, which means the values for both MLE and TNE were small. Normal analytical variation could easily result in negative values.
In addition, it should be noted that the MS calculation is based on a difference between TNE from urinary nicotine and metabolites and MLE from filter analysis. As noted in the sources of error for retention estimation, estimates based on differences are ideally avoided, but the direct measurement of MS has been described as “difficult/impossible to measure” (Baker et al., Citation2004). Woodman et al. (Citation1986) were able to estimate an “individual inhaled smoke percentage” ranging from 46% to 85% for nine subjects using a radioisotope technique. This converts to a range of MS of 15–54%. Averaging the median results for the nine subjects over the four visits gives an overall MS result of 36%. Even with only nine subjects, this result compares favorably with the average and median results, shown in . In addition, based on the current knowledge of nicotine metabolism, the urinary biomarkers used in the clinical studies represent about 80% of the nicotine dose. Should additional metabolic information show that this percentage shifts, the MS estimation would shift accordingly. Again, for practical considerations, minor shifts in the fraction of metabolites should not influence toxicological considerations appreciably. The methodology shown for dose estimation represents a refinement over previous attempts. A recent article by Urban et al (Citation2012) describes a method for dose estimation based on urinary nicotine equivalents and using the correlation of cigarette nicotine yields with other compounds in smoke. Unfortunately, compatible data from the clinical studies were not available to allow a comparison.
Dose estimates
The ultimate purpose for providing methodologies for estimating RR and MS was to provide realistic estimates of the dose of chemical compounds to smokers when using their products in their everyday environment. Differences in RR have a minor influence on the dose estimates for the majority of the chemical compounds of toxicological interest. On the other hand, individual differences in MS can have a major influence on the dose estimates. An additional benefit of improved dose estimates is being able to determine conversion factors between human biomarkers and dose. These were shown in the slopes for . There is very little information in the literature for the relationship between human biomarkers and dose. Most of the information is based on animal studies. For example, the slope in indicates that about 38% of the acrolein dose appears as the urinary metabolite HPMA with a very good correlation between the two measures. Carmella et al. (Citation2007) reported that the mean (median) level of HPMA in non-smokers was about 48% (24%) of the level in smokers, whereas the intercept in both and are negligible compared to the urinary HPMA from smokers. However, since the data in were from confined clinical studies, the environmental exposure may have been minimized. Carmella et al. (Citation2007) roughly estimated from 43% to 50% of the smoke acrolein appearing as urinary HPMA. Since about 24% (mean) or 48% (median) of the HPMA was essentially background level in their study, this would give a range of 22–38% of the smoke yields (neglecting MS) appearing as urinary HPMA. This compares favorably with the slope in , indicating 25% of the smoke yield appearing as urinary HPMA. indicates that about 58% of the NNK dose from cigarette smoke appears as the total urinary NNAL. Carmella et al. (Citation1993) showed that total NNAL ranged from 40 to 100% of the estimated mainstream smoke yields for four subjects. However, the method of obtaining mainstream smoke yields was not described and it is assumed that it was by the Federal Trade Commission (FTC) machine smoking method. Djordjevic et al. (Citation2000) showed that human smoked NNK yields were about two times higher than the FTC machine smoking yields. This would make the Carmella et al. (Citation1993) values for urinary NNAL range from 20 to 51% of the smoke yields. This neglects RR and MS and compares favorably to the slope in for urinary NNAL versus MLE to NNK, which indicates urinary total NNAL of about 32% of the smoke yield. On the other hand, Hecht et al. (2010) states that 12–17% of the NNK dose is represented by urinary total NNAL based on deuterium-labeled NNK experiments. This is about 25% of the conversion factor determined from the slope in .
Conclusions
Methodologies have been developed, described and demonstrated, which allow the conversion of developed smoker exposure estimates of chemical constituents to dose estimates by accounting for smoke spilled from the mouth prior to inhalation and the RR of smoke constituents during the inhalation cycle. The methodologies are applicable to just about any chemical compound in cigarette smoke that can be measured analytically. This improves the relevancy for outcome assessment of risk assessment paradigms and is also consistent with a longer-term goal for developing quantitative risk assessment paradigms via common mode of action for mixtures (Cunningham et al., Citation2011). The samples needed from the subjects are filters from their smoked cigarettes and a 24-h urine sample. These could be obtained from ambulatory population studies and should have minimal influence on smoker behavior. The method for calculating RR represents a mean value for a population that is constituent specific. The RR for compounds with VP greater than 10−5 Pa was estimated using the logarithm of the VP of the pure compound, for compounds with VP less than 10−7 Pa was estimated using inhalation depth and BH time, and interpolation was used for the remaining compounds. The estimates were shown to reasonably estimate measured values for volatile, semi-volatile and non-volatile compounds.
The methodology for calculating MS from individual subjects relied on nicotine dose estimates from nicotine plus metabolites measured in 24-h urine samples and the MLE of nicotine estimated using filters from smoked cigarettes. Data from two clinical studies showed that the average MS estimates for two separate clinical studies were very similar and indicated that, on average, about 35% of the smoke entering the mouth is not inhaled. This value was similar to a single direct measurement result using a radioisotope technique. As with all smoking behavior results, the subject-to-subject variation was extreme. By removing the variability of each subject’s MS, correlations of calculated dose with urinary biomarkers were significantly improved over correlations of MLE alone with urinary biomarkers. Perhaps, even more important to the overall field of toxicology, correlations of dose with urinary biomarkers allow an estimation of the overall metabolic conversion of a chemical species to its respective biomarker.
Declaration of interest
F. K. St. Charles currently consults for British American Tobacco (Investments) Ltd. J. McAughey and C.J. Shepperd are employees of British American Tobacco (Investments) Ltd. Preparation of the manuscript was funded by British American Tobacco (Investments) Ltd.
References
- Apiezon. (2011). Apiezon high vacuum grease properties. M&I Materials Ltd., Manchester, UK. Available from: http://www.apiezon.com/apiezon-vacuum-greases-properties-table.htm. [Last accessed: 4 Dec 2011]
- Armitage AK, Dixon M, Frost BE, et al. (2004a). The effect of tobacco blend additives on the retention of nicotine and solanesol in the human respiratory tract and on subsequent plasma nicotine concentrations during cigarette smoking. Chem Res Toxicol 17:537–44
- Armitage AK, Dixon M, Frost BE, et al. (2004b). The effect of inhalation volume and breath-hold duration on the retention of nicotine and solanesol in the human respiratory tract and on subsequent plasma nicotine concentrations during cigarette smoking. Beitr Tabakforsch Int 21:240–9
- Ashley DL, O'Connor RJ, Bernert JT, et al. (2010). Effect of differing levels of tobacco-specific nitrosamines in cigarette smoke on the levels of biomarkers in smokers. Cancer Epidemiol Biomarkers Prev 19:1389–98
- ATSDR. (1995). Toxicological profile for polycyclic aromatic hydrocarbons. Atlanta, GA: Agency for Toxic Substances and Disease Registry. U.S. Department of Health and Human Services. Available from: http://www.atsdr.cdc.gov/toxprofiles/tp69.pdf. [Last accessed: 1 Dec 2011]
- Baker RR, Dixon M, Mariner DC, et al. (2004). Seminars in tobacco science. Terms used for exposure to smoke. Beitr Tabakforsch Int 21:250
- Baker RR, Dixon M. (2006). The retention of tobacco smoke constituents in the human respiratory tract. Inhal Toxicol 17:255–94
- Benowitz NL, Jacob P 3rd, Fong I, Gupta S. (1994). Nicotine metabolic profile in man: comparison of cigarette smoking and transdermal nicotine. J Pharmacol Exp Ther 268:296–303
- Carmella SG, Akerkar S, Hecht SS. (1993). Metabolites of the tobacco-specific nitrosamine 4-(methylnitrosoamino)-1-(3-pyridyl)-1-butanone in smokers’ urine. Cancer Res 53:721–4
- Carmella SG, Chen M, Zhang Y, et al. (2007). Quantitation of acrolein-derived (3-hydroxypropyl)mercapturic acid in human urine by liquid chromatography-atmospheric pressure chemical ionization tandem mass spectrometry: effects of cigarette smoking. Chem Res Toxicol 20:986–90
- Chemspider. The free chemical database. London: The Royal Society of Chemistry. Available from: http://www.chemspider.com/. [Last accessed: 1 Dec 2011]
- Chickos JS, Hanshaw W. (2004). Vapor pressures and vaporization enthalpies of the n-alkanes from C31 to C38 at T = 298.15 K by correlation gas chromatography. J Chem Eng Data 49:620–30
- Comer AK, Creighton DE. (1978). The effect of experimental conditions on smoking behaviour. In: Thornton RE (ed). Smoking behaviour. Edinburgh, London, NY: Churchill Livingstone, 76–86
- Clayton PM, Cummingham A, van Heemst JDH. (2010). Quantification of four tobacco-specific nitrosamines in cigarette filter tips using liquid chromatography-tandem mass spectrometry. Anal Methods 2:1085–94
- Cunningham FH, Fiebelkorn S, Meredith C. (2011). Do the aldehydes present as tobacco smoke toxicants share a common mode of action? Toxicol Lett 205:S259. Available from: http://dx.doi.org/10.1016/j.toxlet.2011.05.881. [Last accessed: 9 May 2013]
- Ding YS, Chou T, Abdul-Salaam S, et al. (2012). Development of a method to estimate mouth-level benzo[a]pyrene intake by filter analysis. Cancer Epidemiol Biomarkers Prev 21:39–44
- Djordjevic MV, Stellman SD, Zang E. (2000). Doses of nicotine and lung carcinogens delivered to cigarette smokers. J Natl Cancer Inst 92:106–11
- ESIS. European Chemical Substances Information System. European Commission, Joint Research Centre, Institute for Health and Consumer Protection. Available from: http://esis.jrc.ec.europa.eu/. [Last accessed: 1 Dec 2011]
- Feng S, Plunkett SE, Lan K, et al. (2007). A new method for estimating the retention of selected smoke constituents in the respiratory tract of smokers during cigarette smoking. Inhal Toxicol 19:169–79
- Frost BE, Mariner DC, Sinclair NM. (1988). Factors relating to nicotine physio-chemistry and retention in human smokers. Papers presented at the Meeting of the Smoke and Technology Groups, CORESTA Congress; Brighton, UK, 211–18
- Hammond D, Fong GT, Cummings KM, Hyland A. (2005). Smoking topography, brand switching, and nicotine delivery: results from an in vivo study. Cancer Epidemiol Biomarkers Prev 14:1370–5
- Hukkanen J, Jacob P 3rd, Benowitz NL. (2005). Metabolism and disposition kinetics of nicotine. Pharmacol Rev 57:79–115
- ICRP. (1994). Human respiratory tract model for radiological protection. International Commission on Radiological Protection. Publication 66. Ann. ICRP 24 (1–3)
- Ingebrethsen BJ. (1989). The physical properties of mainstream cigarette smoke and their relationship to deposition in the respiratory tract. In: Crapo JD, Smolko ED, Miller FJ, et al. (eds.) Chapter 12. Extrapolation of dosimetric relationships for inhaled particles and gases. New York: Academic Press, 125–41
- Ingebrethsen BJ. (2006). Numerical simulation of the effects of dilution level, depth of inhalation, and smoke composition on nicotine vapor deposition during cigarette smoking. Inhal Toxicol 18:1071–6
- INCHEM. International programme on chemical safety in partnership with the Canadian Centre for Occupational Health and Safety. Available from: http://www.inchem.org/. [Last accessed: 1 Dec 2011]
- Karl T, Prazeller P, Mayr D, et al. (2001). Human breath isoprene and its relation to blood cholesterol levels: new measurements and modeling. J Appl Physiol 91:762–70
- Martonen TB. (1992). Deposition patterns of cigarette smoke in human airways. Am Ind Hyg Assoc J 53:6–18
- Moldoveanu SC, Coleman W 3rd. (2008a). A pilot study to assess solanesol levels in exhaled cigarette smoke. Beitr Tabakforsch Int 23:144–52
- Moldoveanu SC, Coleman W 3rd. (2008b). The influence of a humectant on the retention by humans of solanesol from cigarette smoke (Part 1, Propylene Glycol). Beitr Tabakforsch Int 23:153–9
- Moldoveanu SC, Coleman W 3rd. (2009). The influence of a humectant on the retention by humans of solanesol from cigarette smoke (Part 2, Glycerin). Beitr Tabakforsch Int 23:377–83
- Moldoveanu SC, Coleman W 3rd, Wilkins J. (2007). Determination of carbonyl compounds in exhaled cigarette smoke. Beitr Tabakforsch Int 22:346–57
- Moldoveanu SC, Coleman W 3rd, Wilkins JM. (2008a). Determination of polycyclic aromatic hydrocarbons in exhaled cigarette smoke. Beitr Tabakforsch Int 23:85–97
- Moldoveanu SC, Coleman W 3rd, Wilkins J. (2008b). Determination of hydroxybenzenes in exhaled cigarette smoke. Beitr Tabakforsch Int 23:98–106
- Moldoveanu SC, Coleman W 3rd, Wilkins J. (2008c). Determination of benzene and toluene in exhaled cigarette smoke. Beitr Tabakforsch Int 23:107–14
- Moldoveanu SC, St. Charles FK. (2007). Differences in the chemical composition of the particulate phase of inhaled and exhaled cigarette mainstream smoke. Beitr Tabakforsch Int 22:290–302
- Montgomery JH, Welkom LM. (1990). Groundwater chemicals desk reference. Chelsea, MI: Lewis Publishers Inc
- Morin A, Shepperd CJ, Eldridge AC, et al. (2011). Estimation and correlation of cigarette smoke exposure in Canadian smokers as determined by filter analysis and biomarkers of exposure. Regul Toxicol Pharmacol 61:S3–12. doi:10.1016/j.yrtph.2010.09.020
- NIOSH. International Chemistry Safety Cards. National Institute for Safety and Health. Atlanta, GA: Centers for Disease Control and Prevention. Available from: http://www.cdc.gov/niosh/ipcs/nicstart.html. [Last accessed: 1 Dec 2011]
- NIST Chemistry Webbook. NIST Standard Reference Database Number 69. National Institute of Science and Technology. Gaithersburg, MD: U.S. Department of Commerce. Available from: http://webbook.nist.gov/chemistry/. [Last accessed: 1 Dec 2011]
- Norton LB, Bigelow CR, Vincent WB. (1940). Partial vapor pressures from nicotine solutions at 25 °. J Am Chem Soc 62:261–4
- NRC. (1998). National Research Council. The Committee’s Framework and Criteria for Evaluation. In: Research priorities for airborne particulate matter: I. Immediate priorities and a long-range research portfolio (ISBN 030906094X). Committee on Research Priorities for Airborne Particulate Matter. Washington DC: The National Academies Press, 34–43
- OECD SIDS. OECD Existing chemicals screening information data sets. Paris: Organisation for Economic Co-operation and Development. Available from: http://oecdsids.jrc.ec.europa.eu/i5browser/Welcome.do. [Last accessed: 1 Dec 2011]
- Ossip-Klein DJ, Martin JE, Lomax BD, et al. (1983). Assessment of smoking topography generalization across laboratory, clinical, and naturalistic settings. Addict Behav 8:11–17
- Pankow JF, Asher WE. (2008). SIMPOL.1: a simple group contribution method for predicting vapor pressures and enthalpies of vaporization of multifunctional organic compounds. Atmos Chem Phys 8:2773–96
- Phillips M, Herrera J, Krishnan S, et al. (1999). Variation in volatile organic compounds in the breath of normal humans. J Chromatogr B: Biomed Sci Appl 729:75–88
- Polzin GM, Wu W, Yan X, et al. (2009). Estimating smokers' mouth-level exposure to select mainstream smoke constituents from discarded cigarette filter butts. Nicotine Tob Res 11:868–74
- Richardson RB. (1986). An investigation of the retention of particulate matter by cigarette smokers (Hazelton Study). BAT Technical Memorandum No. TM.86-09-010. Bates number 103526474. Available from: http://legacy.library.ucsf.edu/tid/jfy54a99/pdf. [Last accessed: 1 Dec 2011]
- Rodenstein DO, Stănescu DC. (1985). Pattern of inhalation of tobacco smoke in pipe, cigarette, and never smokers. Am Rev Respir Dis 132:628–32
- Shepperd CJ, Eldridge AC, Mariner DC, et al. (2009). A study to estimate and correlate cigarette smoke exposure in smokers in Germany as determined by filter analysis and biomarkers of exposure. Regul Toxicol Pharmacol 55:97–109
- Shepperd CJ, Eldridge AC, Errington G, Dixon M. (2011). A study to evaluate the effect on mouth level exposure and biomarkers of exposure estimates of cigarette smoke exposure following a forced switch to a lower ISO tar yield cigarette. Regul Toxicol Pharmacol 61:S13–24
- Site AD. (1997). The vapor pressure of environmentally significant organic chemicals: a review of methods and data at ambient temperature. J Phys Chem Ref Data 26:157–93
- SRC. Chemfate, PhysProp, and 2009 databases. Syracuse, NY: SRC Inc. Available from: http://www.srcinc.com/what-we-do/free-demos.aspx. [Last accessed: 1 Dec 2011]
- St. Charles FK, Krautter GR, Dixon M, Mariner DC. (2006). A comparison of nicotine dose estimates in smokers between filter analysis, salivary cotinine, and urinary excretion of nicotine metabolites. Psychopharmacology (Berl) 189:345–54
- St. Charles FK, Krautter GR, Mariner DC. (2009a). Post-puff respiration measures on smokers of different tar yield cigarettes. Inhal Toxicol 21:712–8
- St. Charles FK, Ashley M, Shepperd CJ, et al. (2009b). A robust method for estimating human smoked cigarette yields from filter analysis data. Beitr Tabakforsch Int 23:232–43
- Tatavarti AS, Dollimore D, Alexander KS. (2002). A thermogravimetric analysis of non-polymeric pharmaceutical plasticizers: kinetic analysis, method validation, and thermal stability evaluation. AAPS PharmSci 4:231–42. DOI: 10.1208/ps040445
- TOXNET. ChemIDplus and Hazardous Substances Data Bank. Toxicology Data Network. Bethesda, MD: U.S. National Library of Medicine, National Institutes of Health. Available from: http://toxnet.nlm.nih.gov/. [Last accessed: 1 Dec 2011]
- The Good Scents Company. Oak Creek, WI. Available from: http://www.thegoodscentscompany.com/. [Last accessed: 1 Dec 2011]
- Tricker AR. (2006). Biomarkers derived from nicotine and its metabolites: a review. Beitr Tabakforsch Int 22:147–75
- Urban HJ, Tricker AR, Leyden DE, et al. (2012). Reduced exposure evaluation of an electrically heated cigarette smoking system. Part 8: nicotine bridging – estimating smoke constituent exposure by their relationships to both nicotine levels in mainstream cigarette smoke and in smokers. Regul Toxicol Pharmacol 64:S85–97
- Woodman G, Newman SP, Pavia D, Clarke SW. (1986). Inhaled smoke volume, puffing indices and carbon monoxide uptake in asymptomatic cigarette smokers. Clin Sci 71:421–7
- World Medical Association. (2008). Declaration of Helsinki – recommendations guiding physicians in biomedical research involving human subjects. Adopted by the 18th WMA General Assembly, Helsinki, Finland, June 1964, and amended by the: 29th WMA General Assembly, Tokyo, Japan, October 1975; 35th WMA General Assembly, Venice, Italy, October 1983; 41st WMA General Assembly, Hong Kong, September 1989; 48th WMA General Assembly, Somerset West, Republic of South Africa, October 1996; 52nd WMA General Assembly, Edinburgh, Scotland, October 2000; 53rd WMA General Assembly, Washington, 2002 (Note of Clarification on paragraph 29 added); 55th WMA General Assembly, Tokyo, 2004 (Note of Clarification on Paragraph 30 added); 59th WMA General Assembly, Seoul, October 2008