
Abstract
Context: A detailed evaluation of the correlation and linearity of industrial hygiene retrospective exposure assessment (REA) for cumulative asbestos exposure with asbestos lung burden analysis (LBA) has not been previously performed, but both methods are utilized for case-control and cohort studies and other applications such as setting occupational exposure limits.
Objective: (a) To correlate REA with asbestos LBA for a large number of cases from varied industries and exposure scenarios; (b) to evaluate the linearity, precision, and applicability of both industrial hygiene exposure reconstruction and LBA; and (c) to demonstrate validation methods for REA.
Methods: A panel of four experienced industrial hygiene raters independently estimated the cumulative asbestos exposure for 363 cases with limited exposure details in which asbestos LBA had been independently determined. LBA for asbestos bodies was performed by a pathologist by both light microscopy and scanning electron microscopy (SEM) and free asbestos fibers by SEM. Precision, reliability, correlation and linearity were evaluated via intraclass correlation, regression analysis and analysis of covariance. Plaintiff’s answers to interrogatories, work history sheets, work summaries or plaintiff’s discovery depositions that were obtained in court cases involving asbestos were utilized by the pathologist to provide a summarized brief asbestos exposure and work history for each of the 363 cases.
Results: Linear relationships between REA and LBA were found when adjustment was made for asbestos fiber-type exposure differences. Significant correlation between REA and LBA was found with amphibole asbestos lung burden and mixed fiber-types, but not with chrysotile. The intraclass correlation coefficients (ICC) for the precision of the industrial hygiene rater cumulative asbestos exposure estimates and the precision of repeated laboratory analysis were found to be in the excellent range. The ICC estimates were performed independent of specific asbestos fiber-type.
Conclusions: Both REA and pathology assessment are reliable and complementary predictive methods to characterize asbestos exposures. Correlation analysis between the two methods effectively validates both REA methodology and LBA procedures within the determined precision, particularly for cumulative amphibole asbestos exposures since chrysotile fibers, for the most part, are not retained in the lung for an extended period of time.
Introduction
Determining and characterizing past exposures to chemicals and physical agents is a vexing but essential challenge in industrial hygiene, pathology, occupational medicine and epidemiologic research. In particular, cumulative retrospective exposure assessment (REA) of asbestos has allowed dose–response characterization of cohorts and individuals with respect to asbestosis, lung and other cancers, as well as mesothelioma. The determination of reliability and linearity of either industrial hygiene exposure estimation or asbestos lung burden analysis (LBA) to characterize past asbestos exposures is necessary to effectively perform either cohort or case control studies and risk assessment of exposed individuals. Determination of disease risk and causation for individuals also often requires reliable characterization of past exposures. Exposure reconstruction is also essential in determining cumulative population background levels so that occupational exposure limits may be properly determined.
Risk characterization and risk assessment associated for both chrysotile and amphibole asbestos exposures remain important in risk-based decision making for contemporaneous asbestos exposures in both the community and in the workplace. Even in the US and Western World, low-level asbestos exposures are evidenced in ambient air, mining, quarrying, earth-moving construction, general construction and building maintenance, as well as asbestos abatement. Natural occurring minerals and rock outcroppings also result in asbestiform exposures.
The general purposes of this study are (a) to correlate asbestos REA with various forms of LBA for a large number of cases from varied industries, exposure scenarios, and fiber-types; (b) to evaluate the linearity, precision, reliability and applicability of both REA and LBA for these different scenarios with limited asbestos exposure parameter information; and (c) to demonstrate a validation procedure for REA methods.
REA, also known as exposure reconstruction, is the application of well-established scientific methodologies, models and judgments to facilitate understanding of exposures and risk (Armstrong et al., Citation2009). Although the technique has been formalized (AIHA, Citation2008; Armstrong et al., Citation2009), associated reliability is related to the competency and experience of the industrial hygienist or exposure scientist. An exposure reconstruction, as with any model established as a scientific hypothesis, needs to be tested or validated empirically to assess the quality of the model (Armstrong et al., Citation2009; Gauch, Citation2003; Hewett et al., Citation2006; Lin et al., Citation2004; Rodricks, Citation2011; Vandentorren et al., Citation2006). Important criteria for industrial hygienists and exposure scientists who perform exposure reconstructions include relevant experience in the methodology, demonstrated competency and relevant field experience.
The methods of exposure assessment, in general, apply to the methods and principles of REA. Thus, the study of the precision, reliability and applicability of REA is also applicable to industrial hygiene exposure assessment, in general, since exposure assessment is typically not performed via contemporaneous air sampling, but involves consideration of models, historical data from similarly exposed groups and judgment (AIHA, Citation2008). Our paper, therefore, has application to assessment of industrial hygiene judgment to evaluate potential inhalation exposures with only limited information concerning details of exposure such as ventilation. Other researchers have correlated estimated cumulative asbestos exposure with lung fiber burden, but not asbestos body burden. While such work has been important, the number of subjects tended to be relatively small, the cumulative exposure estimation methods are not always clearly stated, and these types of exposure estimates are sometimes based on estimated category ranges rather than the actual estimated values (Lin et al., Citation2004; Rowlands et al., Citation1982; Iwatsubo et al., Citation1998; Rödelsperger et al., Citation1999, 2001a,b; Lacourt et al., Citation2010; Rolland et al., Citation2010; Gramond et al., Citation2012). No study to date has utilized such a large dataset for analysis as is reported herein for asbestos, and the studies usually have not addressed correlation between individual rater estimates. Finally, detailed analysis of the linearity of the methods and the effect of asbestos fiber-type on such correlations has not been reported.
Our assessment evaluated both the REA process as well as asbestos LBA by the pathologist in a statistically robust manner. Asbestos fiber-type issues that affect comparison between industrial hygiene exposure estimation and LBA were also evaluated and explored. Since all methods of characterizing past asbestos exposures have variability, it is important to estimate precision of the methods. Of equal importance is to evaluate potential sources of bias between the methods. Correspondingly, not only have we explored the correlation between the industrial hygiene raters and asbestos lung burden, but we also evaluated the linearity between cumulative exposure assessment and the pathology assessment methods.
Methods
One of the authors (VLR) reviewed his consultation database to identify cases in which lung fiber analysis had been performed and for which information was available regarding occupational exposure to asbestos, including duration of exposure. Information was also available regarding the patient’s age and date of diagnosis. Cases in the database had been categorized occupationally into one of 23 categories, which included 12 industries, seven occupational categories and four non-occupational categories as previously described (Roggli et al., Citation2002a), although categories were later simplified for statistical analysis in this publication. Work history and exposure profile information was obtained upon review of medical records and other relevant documents. The latter included plaintiff’s answers to interrogatories, work history sheets, work summaries or plaintiff’s discovery depositions. Multiple exposures were identified in some cases, and these were recorded separately. Typically, a qualitative description of exposure categorization with associated details was summarized in six words or less in the database.
Lung tissue was analyzed for mineral fiber content as previously described (Roggli, Citation2004) (Duke University Pathology Laboratory, Durham, NC). In brief, samples were selected avoiding areas of tumor, consolidation and hemorrhage as much as possible. When whole lungs or lobes were available, samples were selected from the lung periphery to include a portion of visceral pleura. When only paraffin blocks were available, the block containing the most lung parenchyma without tumor, consolidation or hemorrhage was selected. Samples were weighed and then digested in sodium hypochlorite solution. Sample weights ranged from 0.1 gram to 0.3 gram wet, with most samples being near to 0.3 gram. The residue was collected on 0.4 µ pore-size Nuclepore® filters (GE Healthcare Life Sciences, Piscataway, NJ), which were mounted on glass slides for asbestos body quantification by light microscopy. Asbestos bodies were counted at a magnification of 200× and were distinguished from non-asbestos ferruginous bodies as previously described (Roggli, Citation2004). Results were reported as asbestos bodies per gram of wet lung tissue (ab/g). Filters were mounted on carbon discs for the analysis of fiber concentrations by scanning electron microscopy (SEM) and determination of fiber-types by energy dispersive X-ray analysis as previously described (Roggli, Citation2004). Fibers 5 µm or greater in length were counted at a screening magnification of 1000×, and counting was continued until 100 fields or 200 fibers were encountered, whichever came first. Results were separately reported as asbestos bodies and uncoated fibers per gram (f/g) of wet lung tissue. For a 0.3 gram sample, the detection limit by SEM was typically 440–490 f/g of wet lung tissue. Fibers were categorized by energy dispersive X-ray analysis as amosite, crocidolite, chrysotile, tremolite, actinolite, anthophyllite or specific non-asbestos mineral fibers. For every sample, reported concentrations of the specified mineral types were determined as distinct percentages of the total fibers present per wet gram of lung tissue. Generally, for samples that yielded a non-detectable concentration, a value was not included in the analysis.
A consultation database was provided by the pathologist with a brief description of asbestos exposure, the report date, age at time of report, gender and an estimate of the number of years of asbestos exposure. Information was provided on 363 individuals. From that information, the approximate year of birth could be derived, which helped provide potential asbestos exposure information. Names were withheld, and the pathologist’s analytical data were removed prior to cumulative exposure estimation by the industrial hygiene raters.
Examples of asbestos exposure information provided included:
Painter/carpenter/maintenance man, 20 years
Brake mechanic, 27 years
Asbestos plant worker, 27 years
Insulator, 24+ years
Asbestos cloth weaver, 6 months and shipyard worker, 2 years
Shipyard insulator, 5 years
Joiner, shipyard, 35 years
Carman railroad, 35 years
Household contact, husband, power plant worker, 29 years
Pipefitter, 27 years
Kent cigarettes, 2 years
Household contact (husband and parents-shipyard workers), 2 to 3 years
The information related to the 363 cases was provided to four experienced Certified Industrial Hygienists (Larry Birkner, James Rasmuson, Fred Boelter, William Dyson), referred to as the “raters”. The raters had extensive experience estimating and measuring asbestos exposures, totaling more than 100 years, and were well experienced in industries and processes that had associated asbestos exposures. The raters were instructed to estimate the cumulative asbestos exposure in units of fiber per cubic centimeter years (f/cc-years) for each of the cases. They were not instructed on which method to use in developing their estimates, but utilized methods consistent with exposure reconstruction methods developed and recommended by the American Industrial Hygiene Association (AIHA) that are summarized in various AIHA and other publications (AIHA, Citation2006; Rodricks, Citation2011). These methods include the use of ranges of measured eight-hour Time-Weighted Average (TWA) asbestos exposures associated with Similar Exposure Groups (SEGs), taking into account data quality issues, sampling times and factors that might change the applicability of measurements to a particular exposure scenario (modification factors) (Armstrong et al., Citation2009). The raters performed the REA blind with respect to other raters and blind with respect to analyzed lung burden data.
Either the rater best estimate or an average value between the lower and upper estimates was utilized in the analysis if a best estimate was not provided. For a number of cases, various raters indicated in their summaries that there was insufficient information to provide an exposure estimate. Out of the 363 case reports, 329 exposure estimates were reported by all four raters. One of the exposure estimates of the 329 cases was found to be ambiguous and was therefore excluded from analysis. Therefore, rater correlation was conducted for 328 or 90% of the cases provided by the pathologist. Ambiguity of laboratory data for one subject caused the number to be reduced to a maximum 327 for subjects related to the statistical analysis involving correlations between asbestos lung burden and the exposure estimates. For 308 of the 327 cases, asbestos fiber-type information associated with lung fiber burden analysis was available.
The consultation database contained total mineral fibers per wet gram by SEM and total coated mineral fibers per wet gram by SEM, besides asbestos bodies per wet gram of lung tissue. The ratios of asbestos fibers and asbestos bodies to mineral fibers and coated mineral fibers were determined from provided fiber-type analysis to transform the data into units of asbestos fibers per wet gram of lung tissue (f/g) and SEM asbestos bodies per gram of wet lung tissue (SEM ab/g).
Histograms of the various laboratory lung burden and rater estimate values were examined and found to be distributed closer to log-normal than normal. Therefore, the data were transformed logarithmically (base 10) prior to statistical analysis. Logarithmically transforming the data can mask relatively large arithmetic differences in large numbers and can accentuate small arithmetic differences in low values, but the transformation appears to have been necessary and helpful due to the distribution of the data and wide range of associated values. summarizes how the data were categorized. Specifically, capital letters are utilized to designate logarithmic values. Thus, for example, log10(ab/g) is designated as AB/g.
Table 1. Variable definitions.
When logarithmic values of two variables are correlated with a slope of 1, the two variables are linear with respect to each other. When the slope is different from 1, a non-linear relationship exists between the arithmetic values. Therefore for purposes of our analysis, relationships between variables are defined as linear if no significant differences exist from a slope of 1 for the correlation.
In order to determine the population estimates of the variable, LAB (a combined laboratory result variable defined in ), relationships were determined between AB/g and both SEM AB/g and F/g based on regression analysis and AB/g equivalence was calculated for SEM AB/g and F/g. The regressions revealed significant correlations as shown in .
Table 2. Correlation of AB/g as a function of (SEM AB/g) and F/g. Coefficients were utilized to calculate LAB, a combined function of AB/g, SEM AB/g and F/g, all in the same units of AB/g.
Identical units of Log10 (ab/g) were thus obtained for all three lung burden analysis by converting SEM AB/g values and F/g determinations to estimates of AB/g utilizing the slopes and intercepts found in . The conversions were performed with more significant figures than the rounded values shown in , as is also true of all statistical tests that were performed. LAB was then determined for each of the available cases by averaging the converted values of AB/g (no conversion needed for this variable), SEM AB/g equivalence and F/g equivalence (all log-transformed) based on data that was available for each of the three methods. For some cases, LAB was a function of one or two of the laboratory method results, instead of all three. Although both SEM AB/g and F/g had significantly different slopes from one, as shown in , indicating some degree of non-linearity between the two variables and AB/g, another test of linearity is the regression between the laboratory variables and EXP (defined in Table 1), with and without adjusting for confounding factors like asbestos fiber-type. These correlations are presented in the “Results” section.
Correlation between raters and the laboratory analysis were determined by both regression and ANCOVA analysis. ANCOVA allows comparison of the values of various lung burden-dependent variables at constant EXP values for the different exposure classes.
The intraclass correlation coefficient (ICC) was determined to further evaluate reproducibility of the exposure reconstructions performed by the raters and the overall degree of reliability (Rosner, Citation2011). REA estimates associated with each subject, obtained from each of the participating experienced industrial hygienists were treated as replicate measures of the exposures associated with the same subject for our analysis. The ICC was also calculated for each of the laboratory determinations of asbestos body (AB/g and SEM AB/g) and fiber burden (F/g) lung tissue analysis. The ICC is a statistical measure used to evaluate the reproducibility of measured or estimated continuous variable values such as replicate analytical determinations and has also been applied to evaluate continuous variable rater determinations. The ICC was calculated as follows with log-transformed values:
where ρ = intraclass correlation coefficient,
is the between sample variance and
is the within replicate sample variance.
As approaches zero, ρ approximates 1 and as
increases, ρ approximates 0. Typically, ρ < 0.40 indicates poor reproducibility, 0.4 ≤ ρ < 0.75 indicates fair to good reproducibility, and ρ > 0.75 indicates excellent reproducibility (Rosner, Citation2006).
In addition, the Spearman–Brown Correction Factor (Wuensch, Citation2010) was applied to the calculated rater ICC to estimate the reliability and reproducibility of the log-averaged exposure-estimates:
where ρ = intraclass correlation coefficient and j is the number of raters.
Similarly, for the analytical pathology results, where replicate measures were reported for distinct AB and fiber burden samples, an analysis of reproducibility was performed by calculating associated ICC values.
To determine whether increasing the number of variables was responsible for increasing correlation as class variables were added, ANCOVA analysis was performed with the class variable integers randomized from a random number generator for the bounded ranges of the variables for the various analysis. The randomization caused ANCOVA r-values to approach that of the correlation associated with simple regression. In addition, unadjusted r-values were compared with adjusted r-values (that computationally compensated for the additional number of variables). Differences in r no greater than about 0.01 were found except for the ANCOVA analysis that utilized 15 class variables. In that instance, a change in r of about 0.015 was found.
The SAS statistical program (Versions 9.1--9.3, SAS Institute, Inc., Cary, NC) was utilized for statistical tests. Verification of all regression, ANCOVA, and p value determinations was accomplished generally by a second statistician who utilized STATISTICA 9.1 software (StatSoft, Tulsa, OK). For all tests of significance, two-sided 95% confidence interval tests were performed unless otherwise noted. Tests for normality of residual error distribution associated with the various correlations were determined with the Wilk–Shapiro Test with STATISTICA 9.1 software.
Results
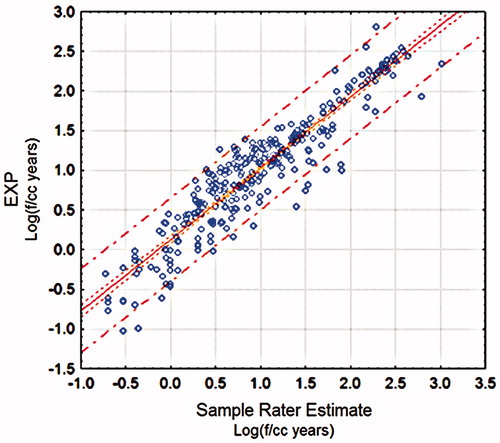
illustrates a sample correlation plot involving the regression of the logarithm of an individual rater’s exposure estimates with the individual EXP values for which the r-value was 0.94, the slope was 0.90 and the intercept was 0.13. Similar plots for the other three raters had r-values varying between 0.90 and 0.93 (0.90, 0.93 and 0.93). The 95% confidence interval (variation of mean estimate) is shown with the inner dotted lines, and the 95% prediction interval (95% variation of individual data points from the mean estimate) is shown by the outer dotted lines in . The relatively narrow confidence interval for the relationship is due in part to the large n associated with this analysis. Ideally, the regression plots such as that shown in would have a slope not significantly different from one and an intercept not significantly different from zero if there was only random variability between raters across all exposure levels and categories. Although three of the slopes (0.99. 0.90, 0.87 and 0.70) were not far from one, three of the four slopes were significantly different from one. In addition, while the intercepts were not far from zero, they varied from 0.04 to 0.21 (0.21, 0.13, 0.04 and 0.21) and three were significantly different from zero. Individual comparisons between all of the four raters on an individual basis (six comparisons, based on the potential number of comparison combinations) yielded a range of r-values between 0.76 and 0.90 (0.76, 0.79, 0.80, 0.83, 0.87 and 0.90).
Figure 1. Correlation of a Rater’s Exposure Estimates with EXP.
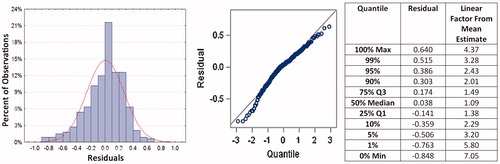
demonstrates the histogram and a probit plot of the residual error for the regression, along with numerical values for the quantiles associated with the probit plot. First, since the regression was performed on logarithmically-transformed data, it can be seen that the residual error approximates a log-normal distribution, but is not statistically verified (p < 0.0001). The quantile data indicate that for the upper and lower 5% and 95% bounds, the rater estimate is within an approximate (arithmetic rather than logarithmic) factor of three of the mean estimated data of all four raters, and 50% of the comparisons are within a factor of 1.5.
Figure 2. Residual error histogram with probit plot and quantile data for regression of a sample rater’s exposure estimates with EXP.
Further analysis between the log-transformed rater estimates yielded excellent agreement and reliability according to established guidelines (Rosner, Citation2006) with an ICC-value of 0.76, not far from the upper bound of the very good range (ICC = 0.75). The four-rater average log exposure estimates were found to have an adjusted Spearman–Brown ICC of 0.92, indicating excellent reliability. Collectively, the rater estimates (EXP function) had an ICC value that were in the same range as that of the laboratory pathology determinations. This demonstrates and verifies the reliability of rater panels in favor of individual exposure assessments although useful exposure assessments may be completed by a single, experienced and qualified industrial hygienist.
Fiber burden analysis within the Duke University Pathology Laboratory resulted in ICC values above 0.75, indicating excellent reliability and reproducibility as shown in . As can be seen from the data summary, additional cases besides those evaluated by the raters were utilized to calculate ICC statistics for the pathology analysis.
Table 3. Intraclass ICC for asbestos bodies and fiber burden analysis.
Regressions of AB/g, SEM AB/g, F/g and LAB as a function of EXP yielded the statistics shown in .
Table 4. Correlation of the logarithm of various lung asbestos body and fiber burden determinations with average log of rater estimates (EXP).
indicates that each of the specified analytical methodologies is a good predictor of asbestos exposure within the indicated precision. Slope values are slightly above and slightly below one, indicating reasonable linearity with estimated exposure estimates (EXP), but improved linearity can be obtained by compensating for fiber-type, as demonstrated below. As LAB provided a slightly better correlation than the other three dependent variables that were tested, and it appeared to provide the most linearity, it was selected as the primary dependent variable to be studied further by ANCOVA methods. Nevertheless, the data appear to indicate that the light microscopy asbestos body determination generally yields results about as reliable as combining the three determinations into the single LAB variable.
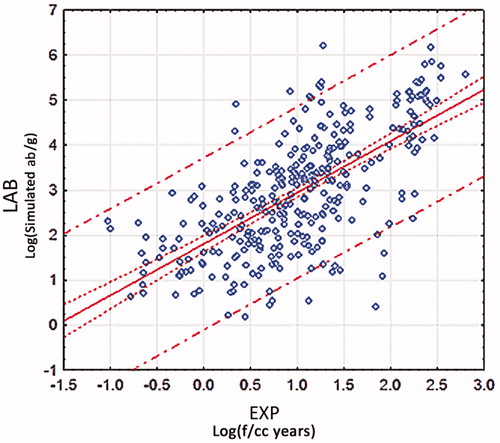
The regression of LAB as a function of EXP is shown in . As expected, lower correlation is found between LAB and EXP than for either laboratory repeatability studies or rater comparison correlations, e.g. the correlation demonstrated in , because of variability in breathing rates associated with various occupations, varying fiber types, ages of exposure, individual fiber retention, individual efficiency of asbestos body production and perhaps other factors. Some of these sources of variability can be evaluated and compensated by introduction of the class variables defined in , such as ET (related to breathing rate and asbestos fiber-type) and FT determined by lung fiber burden analysis. This is demonstrated in the analysis described further. Nevertheless, reasonable correlation is found (r = 0.67) based on the large degree of potential variability associated with these potential confounders, and the correlation is significant (p < 0.0001). However, not taking into account all sources of variability, allows only explanation of 45% (r2) of the variability, and 55% of the variation in the data remains unexplained. This variation is apparently largely related to the factors described above, given the excellent correlation between separate raters and the excellent correlation between replicate laboratory analysis. Therefore, we undertook to study the effect of the additional variables.
Figure 3. Correlation of LAB with EXP.
Some of the variability in is likely caused by fiber-type percentage differences between various asbestos formulations utilized in varying occupations, varying associated breathing rates and differing times between exposure and LBA. The exposure class variable, ET, defined in was added to study some of these effects, primarily asbestos fiber-type (but also average breathing rate differences between various occupations and situations). For example, a shipyard insulator was typically exposed to a significant proportion of amosite while an automobile mechanic’s exposures (at least while performing automobile work) typically involved chrysotile (friction products and gaskets). Therefore, a much higher percentage of inhaled asbestos fibers (and resultant asbestos bodies) would be expected to be retained in the lung for the shipyard insulator compared with the automobile mechanic, because of the much shorter half-life of chrysotile in the human lung (weeks or months) compared with amphibole asbestos (decades, if not a lifetime) (Roggli, Citation2004; Churg, Citation1998; Craighead & Gibbs, Citation2008).
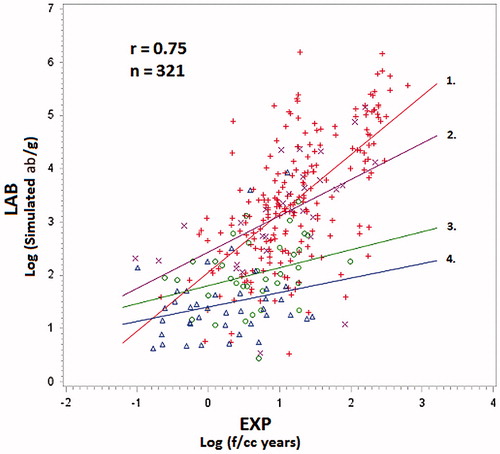
For any given estimated cumulative exposure (EXP), ANCOVA provides a tool to examine the magnitude of how LAB varies as a function of the various ET classes, including the fiber-type. illustrates the ANCOVA correlation, a type of simultaneous regression, when the exposure type (ET) categories are added to the correlation as shown in . Somewhat overall improved correlation was found (r = 0.72 compared with the r = 0.67 associated with ). The correlation lines shown in for the various occupational class variables are parallel because the interaction term in the ANCOVA model between EXP and ET was not significant (p = 0.37) and was therefore not included in the analysis. However, the correlation as shown in had an associated p-value of <0.0001, and the class variable term had an associated p-value of 0.0005. Therefore, shows LAB as a function of the continuous variable, EXP and the class variable, ET, but the function does not include the product of EXP and ET (EXP*ET). Of importance, the slope of the parallel lines in is not significantly different from one (0.96, p = 0.66). However, when the correlation lines are not forced to be parallel, the categories involving extensive amphibole asbestos exposure such as shipyard insulators are steeper than the slope for other categories, and the slope for the automobile and friction product work is relatively flat, because chrysotile fibers are not easily converted to asbestos bodies in the lung, and chrysotile fibers, for the most part, are not retained in the lung (Roggli & Sharma, Citation2004).
Figure 4. ANCOVA correlation of LAB as function of the continuous variable EXP and the class variable ET, no interaction term. Order of parallel lines from top: 1. Shipyard Insulator (n = 10), 2. Power Plant Worker (n = 7), 3. Asbestos Insulator (n = 41), 4. Shipyard Worker (n = 89), 5. Asbestos Manufacturing Except Friction Products (n = 5), 6. Secondary Household Exposures (n = 18), 7. Miscellaneous and Mixed Trade (n = 72), 8. Construction, Piping, and Boiler Trades Except Shipyard (n = 63), 9. Building Occupant (n = 5), 10. Refinery Workers (n = 6), and 11. Automobile and Friction Product Related (n = 11). Colors of data points correspond to the colors of the parallel lines.
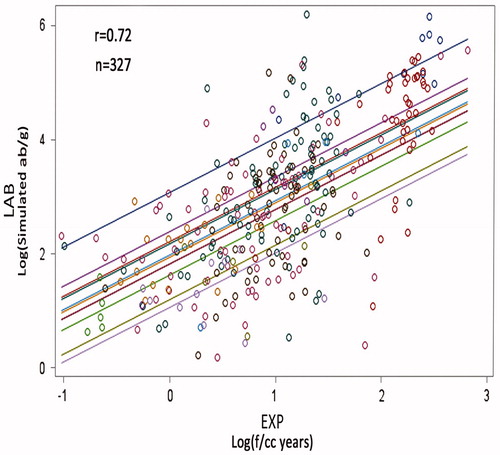
The order of the exposure categories (parallel lines) is shown in the caption of , from highest equivalent asbestos body concentration per unit of cumulative asbestos exposure to the lowest. As might be expected, the shipyard insulator, shipyard worker, power plant worker and insulator categories indicate relatively high LAB values as a function of EXP compared with some of the other asbestos exposure categories. This is especially true when comparing the parallel line associated with likely automobile and friction product chrysotile exposures with the apparently amphibole asbestos-exposed classes except for refinery workers. The standard errors associated with statistical parameters of are shown in , from which significant differences between the class plot lines can be derived. For example, there is a significant difference between each of the upper four amphibole asbestos classes and the automobile/friction product class based on a two-sided t-test with unequal variances assumed for each of the classes. Additionally, a one-sided t-test shows significance between the automobile/friction product class and each of the secondary household, miscellaneous and mixed trades and the construction trade classes. Expectedly, there is no difference between the building occupant class and the automobile/friction product class. Unexpectedly, there is also no difference between the refinery workers class and the automobile/friction product class, but an n of six is relatively small for the refinery workers, and the exact nature of the work that they performed is unknown.
Table 5. Standard errors associated with the data presented in .
Similar results as those found in were found if the other variables, AB/g, SEM AB/g or F/g were substituted for LAB as the dependent variable in the ANCOVA analysis. However, with the exception of AB/g, an overall slope significantly lower than one was found, with slightly reduced correlation (r-values of 0.68 and 0.69 for SEM AB/g and F/g, respectively). The slope for AB/g was 1.04, and the correlation coefficient was 0.70.
To further test the hypothesis that fiber-type (FT) was a significant cause of variability in the correlation of EXP estimates with LAB, ANCOVA was performed with FT as a class variable. The results are shown in , along with various statistics and p values in . The overall correlation improved to r = 0.75. In this instance, the interaction term between EXP and FT (EXP*FT) was significant (p = 0.0001), with p values for FT and EXP equal to 0.0005 and <0.0001, respectively. Therefore, LAB was determined as a function of EXP, FT and EXP*FT. As expected, where significant amphibole asbestos was involved in the exposures (FT class variable 1), the slope was not significantly different from one, but was overall significantly different from zero with p < 0.0001. The majority of data points (216 out of 321 available fiber-type analysis) were associated with FT Class 1. When significant amphiboles were present in FT Class 2, but apparently not as significant for FT Class 1, the slope was lower at 0.68, but still not significantly different from one and also different from zero. For FT Classes 3 and 4, relatively flat correlation lines (slopes of 0.33 and 0.27) were found, with slopes significantly different from one, but not different from zero. These slopes were probably not different from zero since the predominant asbestos fiber-type associated with exposure was often likely to have been chrysotile for FT, Classes 3 and 4. However, when the database was examined for Classes 3 and 4, little, if any, chrysotile was still present in the lungs for individual subjects at the time of analysis. Moreover, even for relatively high chrysotile exposures such as those associated with asbestos insulators, only six of 49 insulator cases had detectable remaining lung chrysotile fibers. Other typically non-commercial (North America) asbestos fiber types such as tremolite, actinolite and anthophyllite often remained in the lungs of the cases associated with FT Classes 3 and 4, but apparently these asbestos fibers were not proportionally related to the primary asbestos exposures associated with the cases, based on the ANCOVA results represented in .
Figure 5. LAB as function of EXP and fiber for four fiber type classes (with interaction). 1. Commercial amphibole asbestos, majority fiber type, no chrysotile (+), n = 216 2. Commercial amphibole asbestos, majority fiber type, chrysotile detected (x), n = 30. 3. Amosite and/or crocidolite detected, but not majority asbestos fiber-type (o), n = 35. 4. No crocidolite or amosite detected (Δ), n = 40.
In , the difference in slopes for FT Classes 1 and 2 were significant with a one-sided t-test, but were marginally significant with a two-sided test (p = 0.0545). The slope for Class 1 was significantly different from the slopes associated with FT Classes 3 and 4. There were no significant differences between the slopes 2, 3 and 4.
The only exposure type (ET) of that clearly and predominantly represented chrysotile exposures is represented by ET Class 11, asbestos exposures related to automobile maintenance and friction product manufacture. If the hypothesis that the relatively flat relationships observed for FT Classes 3 and 4 in are because of significant chrysotile exposure as a part of the EXP variable, a regression of LAB as a function of EXP for only values in ET Class 11 should yield a relatively flat response, with little correlation. Indeed when this was done, an r-value of only 0.01 was found with a slope of −0.01, essentially flat, but with a standard error of 0.46 for the slope since the EXP estimates varied broadly (relating to exposures varying between parts delivery, automobile mechanics, brake mechanics and the manufacture of friction products).
Since lung asbestos fiber burden is often utilized instead of asbestos body analysis or the two are used in conjunction to characterize past subject asbestos exposures, the ANCOVA correlation demonstrated in was also performed separately for AB/g, F/g and SEM AB/g as dependent variables. This was done to evaluate whether the pathological markers of exposure behaved similarly with increasing asbestos exposure and to determine the degree of linearity of the response. Comparison results for the three dependent variables with an interaction term (EXP*FT) that has statistical significance (which allows slope comparisons for the four FT Classes) are summarized in , and a comparison of both slope and intercepts for the AB/g and F/g analysis are shown in .
Figure 6. Comparison of asbestos body and asbestos fiber burden ANCOVA correlations.
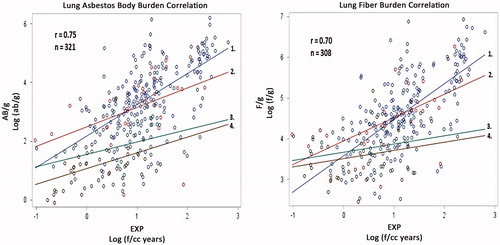
Table 6. Comparison of ANCOVA correlation with EXP and EXP*FT for each of the dependent variables, LAB, AB/g, and F/g.
As can be seen from , somewhat similar results are found, regardless of whether the dependent variables AB/g, F/g, or the combination variable, LAB is employed. For example, for the case of the dependent variable, AB/g, the slope for the first fiber-type category was 1.06, not different from one, and r was 0.75, the same value as that associated with the LAB dependent variable shown in . When SEM AB/g was utilized as the dependent variable, the variability of the slopes increased, and the interaction term associated with defining slope values lost significance (p = 0.07). Therefore, that analysis is not included in . With F/g as the dependent variable, somewhat similar results as those associated with were found, with r = 0.70, and the slopes for categories 1 and 2, not significantly different from one.
Significant differences between the slopes for the AB/g and F/g-ANCOVA plots summarized in were similar to, but not precisely the same as that summarized above for the data in . When AB/g was the dependent variable, differences between slope 1 and each of slopes 3 and 4 were observed, but a difference between slopes 1 and 2 was not as clear with a one-sided t-test p value of 0.051. As before, differences between slopes 2, 3, and 4 were not observed. Similar results were found for the F/g-ANCOVA plot.
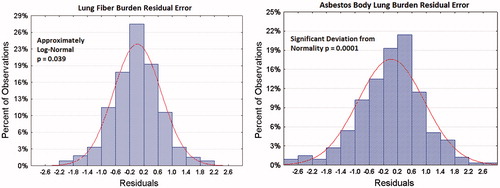
There are some differences in the residual error distribution of the analysis, which can be explained by differences in individual tendency to coat asbestos fibers in the lung to produce asbestos bodies (). As can be seen for a number of cases, the number of AB/g is under predicted, based on FT and EXP. This is most likely related to the known phenomenon that some individuals tend to coat a much higher percentage of asbestos fibers than others (Roggli & Sharma, Citation2004). Thus, the F/g residual deviation (log (f/g)) appears normally distributed. Based on our data, although a slightly better correlation with EXP and FT is found for AB/g, F/g may be a more reliable indicator of past amphibole asbestos exposure, because of coating differences. For example, the histogram for F/g in implies that lower and upper 5% and 95% bounds are within about a factor of 13 and 11 of the mean values on an arithmetic basis. Although the error distribution between raters appears to be smaller, if equal variation is attributed to both the lab analysis and the rater estimates, the data represented by each of the two methods is within about a factor of 8.5 of mean estimates in the correlation. Additionally, the combination variable LAB provides equal correlation as AB/g, but also includes and provides a compromise between the better normality found for SEM AB/g and F/g.
Figure 7. Residual error histograms for F/g and AB/g as a function of EXP, FT and EXP*FT.
When ANCOVA was performed for LAB as a function of EXP with both of the ET and FT class variables included, as well as the EXP*FT interaction term, an r value of 0.77 was determined with significance found for EXP (p < 0.0001), ET (p = 0.0001), FT (p < 0.0001) and FT*EXP (p = 0.0042). An r-value of 0.77 implies that 60% of the variability in the dependent variable is accounted or explained although the correlation was not dramatically improved from simpler models, and a portion of the improvement could be attributed to the increase in the number of variables.
Discussion
Our data suggest that industrial hygiene estimates of past asbestos exposures can be effectively performed, even with limited information based on self-reporting and is approximately linear with dose. Fundamentally, there is no difference between an REA for past chrysotile exposures than for past amphibole asbestos exposures. Thus, although correlation between only amphibole asbestos and REA was found, but no such correlation was found for chrysotile exposures, we believe that chrysotile exposure estimation by experienced industrial hygienists can be performed as reliably as for amphibole asbestos.
In addition, our data suggest that lung asbestos body and asbestos fiber burden analysis is a valid and linear relative indicator of past cumulative amphibole fiber exposure. Earlier comparative studies have indicated that industrial hygiene judgment and individual-reported asbestos exposure histories combine to provide the most effective exposure reconstruction process and that this process is superior to sole utilization of job exposure matrices (Gramond et al., Citation2012). Thus, because the information provided for the exposure assessment had the charateristics of a job exposure matrix although occupation and exposure duration have elements of self-reporting, better inter-rater correlation and improved rater correlation with asbestos lung burden would have been expected if the raters had more detailed exposure information.
Nevertheless, this study suggests that when industrial hygienists with sufficient competency and experience perform the assessment, the measured precision generally appears better than inter and intra-worker exposure variance within an SEG based on individual air samples (Kromhout et al., Citation1993). This is related to the phenomenon that the confidence interval of long-term SEG data typically has a known or implied long-term variance that is considerably less than worker-to-worker or day-to-day variability. Our data also supports the hypothesis that location-specific air sampling is not required to reasonably estimate exposures (Roggli & Sharma, Citation2004).
Assuming adequate sampling of lung tissue, our data also suggest that asbestos body determination by light microscopy yields useful information regarding past asbestiform amphibole exposures, comparable to the more elaborate asbestos fiber burden determination by electron microscopy, which also primarily is an indicator of past amphibole asbestos exposure.
Chrysotile, while having apparent lower potency with respect to mesothelioma than amphibole asbestos, can increase risk of asbestosis and remains classified as a human carcinogen. Chrysotile exposures are of particular current public health interest because of continued world production of the mineral, especially in the former Soviet Union, Brazil and China, and utilization of asbestos products, particularly in construction materials such as roofing products throughout much of the developing world. There is no effective substitute for industrial hygiene estimation of past cumulative chrysotile exposures, in most instances (Consensus Report, Citation1997); thus, validation of cumulative asbestos exposure estimates is critical. Tremolite fibers, which are a common amphibole (but not necessarily an asbestiform fiber) contaminant of chrysotile, have been suggested to be a reasonably good marker of past chrysotile exposure for miners (Roggli et al., Citation2002b). However, estimated cumulative chrysotile exposure has been only poorly correlated with chrysotile fiber (r = 0.40) and tremolite fiber lung burdens (r = 0.49) for chrysotile miners and millers (Rowlands et al., Citation1982). While our analysis does not include miner and miller exposures, it does include manufacturing and end-user exposures that have been typical to North America. Pathologists continue to characterize past chrysotile exposures via lung fiber burden analysis, but most of the chrysotile does not persist in the lung and only a small percentage results in asbestos body formation.
Even for amphibole asbestos exposures, the linearity and correlation of asbestos fiber and asbestos body concentrations in the lung with each other and with respect to past cumulative exposure has been questioned, and the degree of correlation may depend on ratios of amosite to crocidolite and whether the subject has asbestosis (Roggli, Citation2004; Roggli et al., Citation2002a). In the past, often such correlation attempts have involved total ferruginous bodies with total lung fiber burden data without differentiation of whether the ferruginous bodies are asbestos bodies or whether the lung fiber burden data is with respect to all fibers or to asbestos fibers. However, our study suggests that the various lung burden indicators appear to be linear with total amphibole asbestos exposure, which has not been previously demonstrated, although asbestos bodies have been shown to be a relatively good marker of past exposure to long amphibole fibers (Roggli, Citation2004).
Although our data indicate a very good to excellent correlation between industrial hygienists’ estimate of lifetime cumulative exposure and the asbestos lung burden data, in general, based on the determined ICC, factors such as individual variable fiber retention, individual variable fiber coating efficiency and varying time between exposure and laboratory analysis, as well as site-to-site variation of fiber content within the lung help explain the remaining significant unexplained variance. It must be remembered that an r-value of 0.75, shown in , still leaves 44% of the variability unexplained, but some of the unexplained variability is related to exposure variability within SEGs and the limited exposure history information provided. In terms of measuring lung fiber content by phase contrast light microscopy, Morgan & Holmes (Citation1983, Citation1984) reported as much as a five to ten fold site-to-site variation. Furthermore, there is interlaboratory variation depending upon methodological factors, which include the digestion procedure, recovery procedure, analytical procedure and reporting of results (Roggli, Citation2004). Such variability has been documented in an international inter-laboratory counting trial reported by Gylseth et al. (Citation1985).
The purpose of lung fiber and asbestos body burden analysis is to determine the cumulative asbestos fiber content of an individual’s lungs at the time that the tissue sample was obtained. This will differ from an individual’s lifetime cumulative inhalational exposure in relation to the clearance of fibers from the lung. For amphibole fibers, the cumulative exposure correlates with the LBA because the half-life for clearance of amphiboles is prolonged (on the order of decades) (Churg, Citation1998; Roggli, Citation2004).
Evaluating the accuracy of exposure reconstruction is more difficult than evaluating precision. Strictly speaking, a high level of agreement between the raters does not necessarily indicate high accuracy. However, the linearity of the exposure estimates with the lung burden data varying over almost four orders of magnitude and the approximate linearity and agreement between various raters suggests that good or at least reasonable accuracy was demonstrated in the exposure estimations.
In addition, the relationships based on our exposure assessment are also consistent with estimated cumulative background asbestos levels in the United States; extrapolating our data from the relationship between AB/g and EXP to the range of 0–20 AB/g yields estimates that are reasonably consistent with previous estimates of potential ranges of cumulative lifetime asbestos background exposures (ATSDR, Citation2001). More details on this analysis will be the subject of a future paper.
Examples of potential applications of our study include estimation of the relationship between workplace and related household asbestos exposures, relative workplace-to-workplace and/or job-to-job comparisons, estimation of historical general population background exposures in units of f/cc-years based on pathology analysis of non-occupationally exposed individuals and determination of asbestos risk assessment potency factors (for example Km in mesothelioma risk assessment procedures) from cohort lung burden analysis when little or no air monitoring data is available, or when asbestos lung burden data is available to validate historical air monitoring data. Application of the procedures described here, however, will have to include the inherent variability as measured in this publication, and estimation of exposure or dose-response parameters should be determined as ranges with confidence limits. Future publications are intended to address some of these and other applications.
Another application of our study is underscored by the observed non-linear dose-response relationships observed in both meta-analysis of cohort studies for lung cancer and mesothelioma (Hodgson & Darnton, Citation2000; Berman & Crump, Citation2008) as well as for case-control studies for mesothelioma (Iwatsubo et al., Citation1998; Lacourt et al., Citation2010; Rödelsperger et al., 2001b). However, a linear dose-response for mesothelioma was observed when asbestos fiber LBA was employed to estimate relative exposures between cases and controls where amphibole asbestos was hypothesized to be the primary risk factor, and crocidolite appeared to be the primary asbestos amphibole (Rödelsperger et al., Citation1999). Thus, the observed linearity of LBA with estimated exposure for amphibole asbestos in our study adds credence to a linear dose-response relationship between mesothelioma and amphibole asbestos exposure at relatively low exposure levels. In addition, LBA apparently can provide an objective means to eliminate recall bias in case-control studies.
Finally, exposure assessment (including REA) training represents an important curriculum for industrial hygienists. A portion of the consultation database has been used by the authors as a resource in a class exercise at the conclusion of American Industrial Hygiene Association (AIHA) professional development classes (PDCs) on exposure reconstruction. Demonstration of competency in REA by industrial hygiene and pathology comparison will improve accuracy and reliability of estimates even when qualitatively characterizing past exposures.
Conclusions
Overall, our data suggest that past cumulative asbestos exposure estimations can be performed reliably by experienced industrial hygienists. Naturally, there is some variability in both the LBA procedure and the industrial hygiene estimation process, as demonstrated in our analysis. Fifty-six percent of the variability between the correlation of industrial hygiene estimates and pathology determinations is explained, when a class variable accounting for variable fiber type is included in the correlation, but higher correlation was found between industrial hygiene raters, as demonstrated by determined ICC values. The reasons for the unexplained variability between industrial hygiene estimations and laboratory lung burden analysis include varying times between exposure and fiber burden analysis for the various cases and individual differences in fiber retention and fiber coating tendency. Industrial hygiene panels and utilization of empirical data rather than use of anecdotal information can potentially further increase reliability and precision. However, our current data also suggest that lung asbestos body and amphibole fiber burden analysis is a valid and linear relative indicator of past cumulative asbestiform amphibole fibers. Industrial hygiene REA appears to be the most reliable indicator of past chrysotile exposure. The light microscopy determination of lung tissue asbestos bodies appears to be almost as good an indicator of past asbestiform amphibole fiber exposures as electron microscopy determination of asbestos fiber lung burden. LBA appears to be a satisfactory relative indication of past asbestiform amphibole fiber exposures for case-control studies, and industrial hygiene reconstructed exposure estimates can also be satisfactorily utilized. Our research does not settle the issue of whether asbestos disease dose-response relationships are linear or non-linear, but provides additional information for further research.
Declaration of interest
All authors are independent consultants with various employers. All authors consult with law firms and have testified as experts in cases involving asbestos. No funding from any outside sources was provided for any aspect of this research, design of the study, analysis of the data or preparation of the manuscript.
Supplementary Material
Download PDF (510.8 KB)Supplementary Material
Download PDF (510.8 KB)Supplementary Material
Download PDF (510.8 KB)Supplementary Material
Download PDF (511 KB)Supplementary Material
Download PDF (510.9 KB)Acknowledgements
We especially want to acknowledge the contributions of the late Lawrence Birkner, CIH who provided much of the inspiration, initial direction and management for the rater correlation. Without his dedication to this project, the work would never have been completed. William Dyson, Ph.D, CIH along with Mr. Birkner participated as industrial hygiene raters. Thanks to Dalmon Larson, Ph.D., who suggested and performed many of our initial correlations of asbestos body concentrations as a function of estimated cumulative exposure. Special thanks are also due to Matthew Strand, Ph.D, of National Jewish Hospital and the University of Colorado who provided advance advice and review of the statistical procedures that were utilized. In addition, Andrey Korchevskiy, Ph.D, provided additional statistical analysis and quality control and also provided invaluable advice. Heartfelt thanks to David Ostrowski, D.Phil, for related research and critical reviews and to Debbie Vaughan for her preparation of the manuscript for publication.
References
- American Industrial Hygiene Association (AIHA). Occupational Epidemiology Committee. (2008). Guideline on occupational exposure reconstruction. Fairfax: American Industrial Hygiene Association Press
- American Industrial Hygiene Association (AIHA). Exposure assessment strategies committee. (2006). A strategy for assessing and managing occupational exposures. 3rd ed. Fairfax: American Industrial Hygiene Association Press
- Armstrong TW, Boelter FW, Rasmuson JO. (2009). Exposure reconstruction. Mathematical models for estimating occupational exposures to chemicals. 2nd ed. Fairfax: American Industrial Hygiene Association Press
- ATSDR. Toxicological profile for asbestos. (2001). National Center for Environmental Health, Atlanta. Georgia: Agency for Toxic Substance Disease Registry (ATSDR), Centers for Disease Control (CDC)
- Berman DW, Crump KS. (2008). A meta-analysis of asbestos-related cancer risk that addresses fiber size and mineral type. Crit Rev Toxicol 38:49–73
- Churg A. (1998). Non-neoplastic disease caused by asbestos. Pathology of occupational lung disease. 2nd ed. Baltimore: Williams & Williams
- Consensus Report. (1997). Asbestos, asbestosis, and cancer: the Helsinki criteria for diagnosis and attribution. Scand J Work Environ Health 23:311–16
- Craighead JE, Gibbs AR. (2008). Mineralogy of asbestos. Asbestos and its diseases. New York: Oxford University Press
- Gauch HG. (2003). Scientific method in practice. Cambridge: Cambridge University Press
- Gramond C, Rolland P, Lacourt A, et al. (2012). Choice of rating method for assessing occupational asbestos exposure: study for compensation purposes in France. Am J Ind Med 55:440–9
- Gylseth B, Churg A, Davis JMG, et al. (1985). Analysis of asbestos fibers and asbestos bodies in tissue samples, from human lung: an international interlaboratory trial. Scand J Work Environ Health 11:107--10
- Hewett P, Logan P, Mulhausen J, et al. (2006). Rating exposure control using bayesian decision analysis. J Occup Environ Hygiene 3:568–81
- Hodgson JT, Darnton A. (2000). The quantitative risks of mesothelioma and lung cancer in relation to asbestos exposure. Ann Occup Hygiene 44:565–601
- Iwatsubo Y, Pairon JC, Boutin C, et al. (1998). Pleural mesothelioma: dose-response relation at low levels of asbestos exposure in a French population-based case-control study. Am J Epidemol 148:133–42
- Kromhout H, Symanski E, Rappaport SM. (1993). A comprehensive evaluation of within- and between-worker components of occupational exposure to chemical agents. Ann Occup Hygiene 37:253–70
- Lacourt A, Rolland P, Gramond C, et al. (2010). Attributable risk in men in two French case-control studies on mesothelioma and asbestos. Eur J Epidemol 25:799–806
- Lin YS, Kupper LL, Rappaport SM. (2004). Air samples versus biomarkers for epidemiology. Occup Environ Med 62:750–60
- Morgan A, Holmes A. (1983). Distribution and characteristics of amphibole asbestos fibres, measured with the light microscope, in the left lung of an insulation worker. Brit J Ind Med 40:45–60
- Morgan A, Holmes A. (1984). The distribution and characteristics of asbestos fibers in the lungs of finish anthophyllite mine-workers. Environ Res 33:62–75
- Rödelsperger K, Woitowitz HJ, Brückel B, et al. (1999). Dose-response relationship between amphibole fiber lung burden and mesothelioma. Cancer Detect Prev 23:183–93
- Rödelsperger K, Tossavainen A, Brückel B, et al. (2001a). Inorganic fibres in the lung tissue of Hungarian and German lung cancer patients. Int Arch Occup Environ Health 74:133–8
- Rödelsperger K, Jöckel KH, Pohlabeln H, et al. (2001b). Asbestos and man-made vitreous fibers as risk factors for diffuse malignant mesothelioma: results from a German hospital-based case-control study. Am J Ind Med 39:262–75
- Rodricks JV. (2011). Reference guide on exposure science. Reference manual on scientific evidence. 3rd ed. Washington, DC: The National Academies Press
- Roggli VL, Sharma A, Butnor KJ, et al. (2002a). Malignantmesothelioma and occupational exposure to asbestos: a clinicopathological correlation of 1445 cases. Ultrastruct Pathol 26:55–65
- Roggli VL, Vollmer RT, Butnor KJ, et al. (2002b). Tremolite and mesothelioma. Ann Occup Hygiene 46:447--53
- Roggli VL. (2004). Asbestos bodies and nonasbestos ferruginous bodies. Pathology of asbestos-associated diseases. New York: Springer-Verlag
- Roggli VL, Sharma A. (2004). Analysis of tissue mineral fiber content. Pathology of asbestos-related diseases. New York: Springer-Verlag
- Rolland P, Gramond C, Lacourt A, et al. (2010). Occupations and industries in France at high risk for pleural mesothelioma: a population-based case-control study (1998–2002). Am J Ind Med 53:1207–19
- Rosner B. (2006). Fundamentals of biostatistics. 6th ed. Duxbury: Thomson
- Rosner B. (2011). Multisample inference. Fundamentals of biostatistics. 7th ed. Boston: Brooks/Cole
- Rowlands N, Gibbs GW, McDonald AD. (1982). Asbestos fibres in the lungs of chrysotile miners and millers – a preliminary report. Ann Occup Hygiene 26:411–15
- Vandentorren S, Salmi LR, Mathoulin-Pélissier S, et al. (2006). Imputation of individual cancer cases to occupational causes. Scand J Work Environ Health 32:32–40
- Wuensch KL. (2010). Inter-rater agreement. Available on-line: www.core.ecu.edu/psyc/wuenschk/docs30/InterRater.doc. [Last accessed: 20 Oct 2013]