
Abstract
Inhalation of cigarette smoke particles (CSP) leads to adverse health effects in smokers. Determination of the localized dose to the lung of the inhaled smoke aids in determining vulnerable sites, and identifying components of the smoke that may be responsible for the adverse effects; thus providing a roadmap for harm reduction of cigarette smoking. A particle deposition model specific to CSP was developed for the oral cavity and the lung by accounting for cigarette particle size growth by hygroscopicity, phase change and coagulation. In addition, since the cigarette puff enters the respiratory tract as a dense cloud, the cloud effect on particle drag and deposition was accounted for in the deposition model. Models of particle losses in the oral cavities were developed during puff drawing and subsequent mouth-hold. Cigarette particles were found to grow by hygroscopicity and coagulation, but to shrink as a result of nicotine evaporation. The particle size reached a plateau beyond which any disturbances in the environmental conditions caused the various mechanisms to balance each other out and the particle size remain stable. Predicted particle deposition considering the cloud effects was greater than when treated as a collection of non-interacting particles (i.e. no cloud effects). Accounting for cloud movement provided the necessary physical mechanism to explain the greater than expected, experimentally observed and particle deposition. The deposition model for CSP can provide the necessary input to determine the fate of inhaled CSP in the lung. The knowledge of deposition will be helpful for health assessment and identification and reduction of harmful components of CSP.
Introduction
Predictions of mainstream cigarette smoke (MCS) particle deposition in the human lung are noticeably lower than reported measurements when traditional whole-lung deposition models for environmental aerosols are used. In addition to the common deposition mechanisms of sedimentation, impaction and Brownian diffusion, there are specific effects that affect the deposition of MCS particles in the lung. The MCS particle-specific effects are termed colligative (cloud or hydrodynamic/thermodynamic interaction of particles) (Martonen, Citation1992; Phalen et al., Citation1994) and non-colligative (hygroscopicity, coagulation, particle charge, etc.) (Robinson & Yu, Citation1999). Inclusion of colligative effects leads to either an apparent or actual decrease in hydrodynamic drag force on MCS particles which, in turn, will cause a higher predicted lung deposition when compared with environmental aerosols. In addition, differences between the breathing pattern of a smoker and a normal breathing pattern may also contribute to the discrepancy in deposition predictions. Predictive lung deposition models specific to MCS particles have been developed by investigators with various aforementioned effects to fill the gap between predictions and measurements. Muller et al. (Citation1990), accounting for MCS particle growth by coagulation and hygroscopicity, calculated deposition per airway generation for different initial sizes of MCS particles. However, a steady breathing profile was used in the model which was inconsistent with a typical smoking inhalation pattern. Furthermore, the hygroscopic growth of MCS particles was modeled by Muller et al. (1990) after salt (NaCl) particles while the measurements of Hicks et al. (Citation1986) clearly demonstrated that the growth of NaCl particles was significantly larger than that of MCS particles. Martonen (1992) and Martonen & Musante (Citation2000) proposed a model of MCS particle transport in the lung by only accounting for the cloud effect, which occurs when a mass of particles behaves as a single body and, thus, the airflow moves around the body rather than through it. As a result, the effective size of MCS particles appears to be larger than that of individual aerosol particles, giving rise to enhanced sedimentation and impaction losses. However, other significant effects such as hygroscopic growth and particle coagulation were discounted. Measurements by Keith & Derrick (Citation1960), Cinkotai (Citation1968), Keith (Citation1982) and others have clearly shown that significant growth occurs when MCS particles are inhaled into the lung. Moreover, simulations by Longest & Xi (Citation2008) showed that hygroscopic growth may contribute to the enhanced deposition of MCS particles. These authors speculated the existence of a supersaturated environment in the airways under which significant growth and hence deposition of cigarette particles may occur. A deposition model for MCS particles was developed by Robinson & Yu (2001) which included coagulation, hygroscopicity, particle charge and cloud behavior effects. The model was based on the assumption that the smoke cloud behaved as a solid sphere in particle-free air. An improved account of cloud effect was considered by Broday & Robinson (Citation2003) using the same deposition model developed Robinson & Yu (2001). The model included MCS size change by hygroscopicity and coagulation but not due to phase change. Unlike the previous studies, models for coagulation and hygroscopic growth were derived specifically for MCS particles and used to calculate lung deposition. While the model accounted for the reduced drag on particles due to the colligative effect, it neglected potential mixing of the cigarette puff with the air in the oral cavity during the drawing of the puff and mouth-hold, and when inhaling the dilution air at the end of the mouth-hold. In addition, particle losses in the oral cavity were assumed to be 16% based on measurements of Dalhamn et al. (Citation1968) when a large variation in mouth deposition between 16% and 67% has been reported (Baker & Dixon, Citation2006).
Despite significant attempts over the past decades to develop a realistic model to predict MCS particle deposition in the human lung, a reliable, comprehensive model is still not available due to the lack of complete understanding of size change, transport and deposition processes in lung airways. It is not clear which effects are major contributors to the observed enhanced deposition. Transport of MCS particles in the lung is very complicated because of the presence and interaction of numerous smoke constituents in the cigarette smoke. The particulate component of cigarette smoke is always accompanied by vapor components with a possible transfer of constituents across the two phases. Therefore, modeling of MCS particle deposition should always be coupled with that for the vapor phase. In addition, constituents in MCS particles have a profound effect on particle growth and deposition in the lung, as has been shown in various studies (Baker & Dixon, Citation2006). Of the aforementioned studies, none account for the solute and vapor phase effects. Kane et al. (Citation2010) are the only study so far that has included the mechanism of cigarette constituent phase change to determine the final size of MCS particle sizes. Based on laboratory measurements, these authors developed a semi-empirical relationship for the MCS particle size change in the cigarette puff while being inhaled into the lung and mixed with the dilution air. No mechanistic attempts were made to either identify parameters on which growth depended or develop a constituent-specific growth model. To obtain a unified deposition model that can be applied to MCS particles of different constituents, mechanistically based models must be developed for particle growth as a function of properties of the components in the cigarette puff and included in particle deposition models. The deposition model must also account for MCS particle-specific processes such as the phase change of components in the particle-vapor mixture. These processes are studied and implemented in an existing deposition model (Multiple-Path, Particle Dosimetry model version 2, ARA, Raleigh, NC). In this paper, the influence of coagulation, hygroscopic growth, presence of other constituents and phase change on MCS particle size change and deposition are examined.
Methods
Breathing patterns of smokers are different from normal breathing and can be separated into two stages. Smoking of MCS particles is initiated in stage one by drawing of a cigarette puff into the oral cavity and holding the breath for a short duration. The puff is then delivered to the lung via the inhalation of the dilution air, held and exhaled. Three sequential processes must be modeled mathematically to estimate particle losses in the lung: (1) drawing of a puff into the oral cavity followed by a mouth-hold, (2) mixing of the puff with the dilution air during the subsequent inhalation of smoke-free air and (3) lung delivery of the MCS particle mixture. We neglect possible nasal inhalation and spillages during mouth opening after drawing a puff. Modeling step 1 involves the calculation of MCS particle deposition in the oral cavity which enables the portion that reaches the lung to be determined. Mixing of MCS bolus with the dilution air in step 2 affects the site and amount of particle deposition in the lung. Due to uncertainty regarding the degree and pattern of mixing, the bounds of particle deposition for complete- (simulating nasal inhalation of dilution air) and no-mixing (simulating oral inhalation of dilution air) will be assessed. The portion of the cigarette puff that escapes oral deposition in step 1 is inhaled into the lung during step 3. The mixture of puff-inhaled air may enter into the lung non-uniformly. The inhaled volume may be considered as divided into many boluses each with a fixed concentration but different from its neighbors. A bolus delivery model will be developed from deposition models for tidal breathing of particles (Asgharian et al., Citation2001) to find deposition of MCS particles in the lung.
Initially, the MCS particles were assumed to be comprised of 7.49% nicotine, 8.12% water, 31.42% semi-volatile compounds, and 52.97% insoluble materials by mass (Cabot et al., 2012; Callicutt et al., 2006). The semi-volatile components are assumed soluble and remain in the particle phase. Deposition fraction of MCS particles were calculated in the lung for an inhalation of a single puff. A typical breathing puff scenario was simulated in which a smoker drew 54 ml of cigarette puff into the oral cavity assumed to contain 50 ml air and held it for 1 s. The smoker then inhaled 1870 ml of dilution air over a 3-s period to deliver the puff into the lung. The inhaled air was held for 1 s in the lung and exhaled in 3 s. Although the selected breathing scenario allowed direct comparison of the predictions with those of Broday & Robinson (2003), typical post puff inhalation volume differs from person to person and varies between 650 and 840 ml according to St. Charles et al. (2009). In addition, a typical puff concentration of 109 #/ cm3, initial MCS particle size of 0.2 μm unless otherwise specified, and relative humidity of 99% and 99.5% in the oral cavities and lung, respectively, were used in the simulations. The initial cloud was assumed to be about 0.4 cm, which is roughly the size of glottis (Broday & Robinson, 2003).
The size of MCS particles change during the puff drawing, mouth-hold and delivery into the lung. Thus, accounting for the size change of MCS particles is an integral part of MCS deposition modeling and must be determined a priori. In addition, the smoked puff may behave as a single body with distinct boundaries separated from the surrounding air. Initially, the cigarette puff enters the oral cavity as a free shear flow. However, mixing of the puffed smoke with the dilution air in step 2 of the above modifies the smoke characteristics. Changes in puff properties continue with penetration into the lung, which must be incorporated in the ensuing deposition calculations.
Size evolution of MCS particles
Particles trapped within the puff experience a size change due to thermal coagulation, absorption of water vapor (i.e. due to hygroscopicity) and phase change of components of the smoke. Size change by hygroscopic growth and phase change depends on MCS particle properties and environmental conditions while that by coagulation is closely tied to particle concentration. Thus, size change by coagulation must be determined in conjunction with loss calculations in the respiratory tract. Physical mechanisms causing MCS particle size to change are independent. Hence, the total rate of size change is simply the linear addition of size change by individual mechanisms
where
is the diameter of MCS particles and t is the elapsed time. To simplify computations, MCS particles were assumed to be made up of solute (nicotine, subscript n), solvent (water, subscript w), other semi-volatile components (subscript s) and insoluble components (subscript in). Size change by hygroscopicity and phase change does not affect number concentration and hence coagulation of airborne MCS particles. Coagulation, however, alters airborne concentration, particle size and mass of each component in MCS particles. Thus, MCS particle coagulation effect must be determined first.
Coagulation is mainly a function of airborne concentration of particles, which is altered by airway deposition. Thus, the species mass balance equation of particles must be solved to find coagulation and deposition of particles. Neglecting axial diffusion, the transport, deposition and coagulation of MCS particles are described by the general dynamic equation which is an extended version of the convective–diffusion equation. For particles flowing through an expanding and contracting airway, particle concentration may be described by (Friedlander, Citation2000; Yu, Citation1978)
where x is the position along the airway, C is the airborne MCS particle concentration, Q is the airflow rate through the airway, A is the airway cross-sectional area,
is the particle loss to the walls per unit time per unit volume of the airway and coagulation kernel
is given by
in which
is the Boltzmann constant,
is the temperature and
is the air viscosity. Solving Equation (2) by the method of characteristics for an arbitrary airway, particle concentration at any location within the airway is related to initial concentration
at time
by
where η is the combined deposition efficiency of particles due to external forces acting on the particles
Deposition efficiency is defined as the fraction of entering particles in an airway that deposit. Time is the starting time (zero for oral cavities but otherwise non-zero). Particle diameter is found from a mass balance of particles at two consecutive times
and t.
The size change rate of MCS particles by coagulation is calculated by differentiating the above equation with respect to time
where
It is noted that Equation (7) is valid during inhalation, breath hold and exhalation. In addition, particle size growth by coagulation and losses by different loss mechanisms are coupled and must be determined simultaneously. In practice, small time or length intervals are selected in the numerical implementation of Equation (7) such that a constant particle size may be used to calculate loss efficiency η during each interval. By decoupling deposition from coagulation, Equation (7) is subsequently solved to find particle growth by coagulation during each interval.
Since the respiratory tract is a humid environment, inhaled MCS particles will grow by absorbing water vapor. The Maxwell relationship can be used to describe hygroscopic growth (Asgharian, Citation2004; Robinson & Yu, Citation1998)
where
and
denote the gram molecular weight and mass density of the solvent (water), respectively,
,
and
denote the gram molecular weight, mass fraction and mass density of semi-volatile components, respectively,
is the diffusion coefficient of water vapor,
,
and
, are the gram molecular weight, mass fraction and mass density of nicotine, respectively, and
and
are mass densities of MCS particles and insoluble components, respectively,
is the mass fraction of insoluble components,
is the universal gas constant and
is the water vapor saturation vapor pressure at the surrounding temperature (
),
is the surface tension of water, Kn is the Knudsen number and S is the saturation ratio. The model represented by Equation (9) is for slowly growing MCS particles such that particles instantly adjust their temperature to that of the surrounding environment.
Particle size change due to the condensation and evaporation of nicotine follows the same diffusion principle that governs size change of hygroscopic particles (Equation (9)). Phase change will cause MCS particles to reduce in size due to sub-saturation vapor pressure in the smoke, which is further exacerbated by wall losses of nicotine vapor in the respiratory tract during inhalation and exhalation. Thus, insufficient vapor in the inhaled air-puff mixture air creates a vapor pressure imbalance between MCS particles and surrounding nicotine vapor resulting in vapor release from the particle phase to the surrounding air. Maxwell’s relationship for droplet evaporation/condensation may again be used to calculate the size change of MCS particles due to nicotine release
where
is the mass fraction of water in the MCS particle,
,
and
are gram molecular weight, diffusion coefficient and mass density of nicotine, respectively,
is the saturation vapor pressure of nicotine and
is the surface tension of nicotine. Vapor pressure of the nicotine far away from the droplet is related to vapor concentration in the air by the ideal gas law (
, where
is the nicotine vapor concentration in the surrounding air). By replacing for pressure in Equation (10), the following relationship is obtained:
It follows from Equation (11) that the size change of MCS particles due to nicotine release depends on the concentration of nicotine vapor in the surrounding air. Unless nicotine vapor concentration is very high (at near saturation vapor pressure), there is a negligible influence of nicotine vapor in the surrounding dilution air on the evaporation rate of nicotine from the MCS particles. Hence, vapor concentration of nicotine is assumed to be negligible ().
Inspection of Equations (9) and (11) indicates that information on gram molecular weight, mass density and fractions of the MCS particle components is needed to find the size change by hygroscopic growth and phase change. The gram molecular weight and mass density of semi-volatile components are related to the mass fraction and density of MCS particles and other components of MCS particles by
where
represents the gram molecular weight of MCS particles. While hygroscopic growth and phase change do not directly affect the mass fraction of semi-volatile and insoluble components of MCS particles, particle coagulation will alter these quantities. Hence, all mass fractions have to be evaluated for all components during particle size change. Mass fractions can be found from the calculated masses of individual components by conducting a compound-specific mass balance
where
,
,
,
and
are masses of nicotine, particle, water, semi-volatile and insoluble components, respectively, and are calculated iteratively at time t by selecting initial estimates for mass fractions.
The above particle size and constituent change equations are integrated for each phase of the deposition model: from the drawing of the puff, to the mouth-hold, to the inhalation and mixing with dilution air, breath-hold and finally exhalation.
Cloud effect
The puff of cigarette smoke is a mixture of various gases and particles that enter the oral cavity as a free shear flow by its momentum and possibly buoyancy fluxes. The initial flux is dissipated following mixing in the oral cavity, which will result in a diluted cloud of particles with unique properties (e.g. viscosity, density, porosity and permeability). The cloud behaves as a single body and hence, particles within the cloud experience external forces that are similar to that of the entire cloud. The cloud size and properties undergo a continuous change during inhalation into the lung due to convective and diffusive mixing with the surrounding air while MCS particles within the cloud change in size and deposit on airway walls. The viscosity difference of the cloud from the surrounding dilution air is of little consequence to its cloud behavior and thus a uniform viscosity of inhaled air may be adopted throughout the respiratory tract. The cloud density, porosity and permeability mainly influence the deposition characteristics of MCS particles. Brinkman (1947) extended Darcy’s friction law for a swarm of suspended particles to obtain an analytical expression for the hydrodynamic drag force on the particles. The model was later enhanced by Neale et al. (1973) and subsequently applied by Broday & Robinson (Citation2003) to the inhalation of a smoke puff. Accordingly, the hydrodynamic drag force on a cloud of particles traveling at a velocity in an unbounded medium is given by
where
is the slip correction factor of individual particles and
is the ratio of the hydrodynamic drag force on the cloud (
) to the Stokes drag force on individual particles that make up the cloud (
) is given by (Broday & Robinson, Citation2003)
in which
where
is the volume fraction of MCS particles and
is the cloud diameter. Drag ratio
approaches
in the upper limit of large
values when the drag force on the cloud approaches that of a solid impermeable sphere of the size of the cloud. For a dilute solution of particles in the cloud (i.e. small values of
), the drag ratio approaches unity (
) so that the hydrodynamic drag on the cloud equals the Stokes drag force on single particles that make up the cloud (Broday & Robinson, Citation2003). It is evident from Equations (15)–(19) that the drag force on the cloud depends on the particle and cloud diameters and MCS particle volume fraction (i.e.
,
and
). While cloud diameter changes only by convective and diffusive mixing with the dilution air,
varies additionally as a result of particle coagulation and deposition in airways. The initial diameter of the cloud is comparable with the size of the glottis (about 0.4 cm; Broday & Robinson, Citation2003). The cloud is subsequently diluted and decreases in size according to (Broday & Robinson, Citation2003)
where
and
are the cloud and airway radii in generation n, respectively, and k = 0, 1, 2 or 3 is a constant representing mixing by the ratio of airway diameters, surface areas, and volumes, respectively. The cloud diameter and, hence, cloud effects will decrease with increasing k. For k = 0, the cloud remains intact throughout the respiratory tract while increasing k will enhance cloud breakup and increase dispersion of smoke particles. For the trachea,
and
are simply the radius of the oral cavity and the trachea, respectively.
To extend the deposition model for non-interacting particles (Asgharian et al., Citation2001) to a cloud of particles, the cloud settling velocity, Stokes number and diffusion coefficient have to be re-evaluated. By applying the force balance when the cloud of particles are depositing by gravitational settling, inertial impaction and Brownian diffusion, the following results are obtained (see also Broday & Robinson, Citation2003):
where g is the gravitational constant, R is the airway radius and U is the average velocity of air in the airway. Thus, cloud parameters are obtained by applying the correction factor
to particle parameters. Deposition efficiencies for cloud particles are found by using the cloud settling velocity, Stokes number and diffusion coefficient from Equations (21)–(23) in the deposition efficiency equations for single particles. MCS particle deposition fractions are then calculated from a modified deposition model described below.
Losses in the oral cavity
A puff of cigarette smoke is delivered to the oral cavity by drawing on the mouth-end of the cigarette. The momentum flux of the puff carries it into the oral cavity to impact on the tongue surface and the back of the mouth. The puff bounces off the back of the mouth and mixes with residual air in the oral cavity during the subsequent mouth-hold. Thus, deposition of the particles in the puff may occur during the initial drawing of the puff by inertial impaction and the subsequent mouth-hold by gravitational settling and Brownian diffusion. In addition, if the cigarette puff is at a temperature greater than body temperature, additional deposition may occur by thermophoresis during both phases of puff delivery and retention in the oral cavities. Furthermore, particle deposition characteristics are modified by size change, which occurs by coagulation, hygroscopic growth and phase change. Models of particle deposition in the oral cavity are constructed during puff drawing and retention incorporating the mechanisms described above.
Laboratory observation of inhaled smoke shows that the drawn puff of smoke enters the oral cavity intact and mostly as a columnar cloud, which does not mix with the residual air in the oral cavity until reaching the proximity of the back walls (Price et al., Citation2012). The distance between the mouth opening (lips) and the back of the cavity is short, which allows preservation of the generated shear-free (jet) flow of the puff. The column of smoke impacts on the back of the mouth and disperses. The geometry of the oral cavity can be selected arbitrarily because it does not alter the jet flow. However, a spherical geometry was assigned to calculate the distance between the mouth opening and the back of the mouth on which the smokes impacts. This distance is equal to the diameter of an equivalent-volume sphere. Calculations of MCS losses during puff inhalation involve solving the flow field for the impinging puff on the back wall of the mouth and using it to calculate particle losses by impaction, diffusion and thermophoresis.
Deposition during the mouth-hold may be by gravitational settling, Brownian diffusion and thermophoresis. However, only losses by sedimentation are accounted for because rapid coagulation and hydroscopic growth of MCS particles during puff inhalation will increase particle size and will intensify the cloud effect and decrease the Brownian diffusion. At the same time, MCS particles are expected to quickly cool to body temperature as a result of heat release during puff suction.
For monodisperse MCS particles, all particles settle at the same rate. If particles are uniformly distributed in the oral cavities at time t = 0, particles behave collectively as a body having the shape of the oral cavity and settle at the same rate at any given time. Thus, the deposition efficiency by sedimentation at any time during the mouth-hold of the smoke bolus is simply the fraction of the initial body that has not remained aloft in the oral cavities. For a spherically shaped oral cavity, deposition efficiency at a constant settling velocity is given by
where
, in which
is the settling velocity given by Equation (21) for a cloud of particles. However, since particle size will change during the settling by the gravitational force field, the diameter and hence settling velocity will change. Thus, Equation (21) is calculated at different time points during the gravitational settling and substituted in Equation (24) to calculate losses during the mouth-hold.
Modeling lung deposition of MCS particles
The Multiple-Path, Particle Dosimetry model (Asgharian et al., Citation2001) was modified to calculate losses of MCS particles in the lung. Modifications were mainly made to the calculations of particle losses in the oral cavity (discussed above), simulation of the breathing pattern of a smoker and calculations of particle size change by hygroscopicity, coagulation and phase change, which directly impacted deposition efficiency formulations in the model. In addition, the cloud effect was accounted for in the calculations of MCS particle deposition throughout the respiratory tract. Furthermore, the lung deposition model was modified to allow inhalation of time-dependent, concentrations of particles in the inhaled air. This scenario arises as a result of mixing of the puff with the dilution air at the end of the mouth-hold and beginning of inhalation. The model also applies equally well to cases of no mixing and complete-mixing of the smoke with the dilution air.
The convective diffusion Equation (2) was solved during a breathing cycle consisting of drawing of the puff, mouth-hold, inhalation of dilution air to push the puff into the lung, pause and exhalation. Losses per airway of the respiratory tract were found by the integration of particle flux to the walls over time (T) and airway volume (V)
Particle concentration was substituted from Equation (2) into Equation (25) or a similar equation accounting for axial diffusion and dispersion (Asgharian & Price, Citation2007) to find losses in the oral cavities, and lung during a puff suction and inhalation into the lung. As noted above, calculations were performed at small time or length segments to decouple particle loss and coagulation growth equation. During inhalation and exhalation, each airway was divided into many small intervals. Particle size was assumed constant during each segment but was updated at the end of the segment to have a new diameter for calculations at the next length interval. The average size was used in each segment to update deposition efficiency and calculate a new particle diameter. Deposition efficiencies were consequently calculated for each length segment and combined to obtain deposition efficiency for the entire airway. Similarly, during the mouth-hold and breath hold, the time period was divided into small time segments and particle diameter was again assumed constant at each time segment. Particle loss efficiency for the entire mouth-hold breath-hold period was calculated by combining deposition efficiencies calculated for each time segment. While the same deposition efficiencies as before were used for particle losses in the lung airways during inhalation, pause and exhalation, new expressions were implemented to determine losses in oral airways.
The puff of smoke in the oral cavity is mixed with the inhalation (dilution) air during inhalation. To calculate the MCS particle deposition in the lung, the inhaled tidal air may be assumed to be a mixture in which particle concentration varies with time at the inlet to the lung (trachea). The inhaled air is then represented by a series of boluses or packets of air volumes having a fixed particle size and concentrations (). The shorter the bolus width (or the larger the number of boluses) within the tidal air, the more closely the series of packets will represent the actual concentration profile of inhaled MCS particles. Modeling the deposition of inhaled aerosols involves calculations of the deposition fraction of each bolus in the inhaled air assuming that there are no particles outside the bolus in the inhaled air (). By repeating particle deposition calculations for all boluses, the total deposition of particles is obtained by combining the predicted deposition fraction of all boluses.
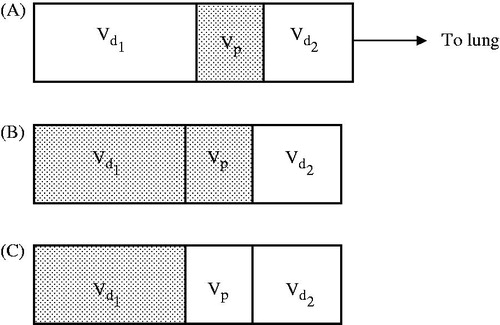
Figure 1. Schematic illustration of inhaled cigarette smoke puff and inhalation (dilution) air: (A) Inhaled air is represented by dilution volumes and
and particles bolus volume
; (B). The puff occupies volumes
and
; (C). The puff occupies volume
alone. Deposition fraction in (A) is the difference in deposition fraction between scenarios (A) and (B).
Consider a bolus arbitrarily located within in the inhaled tidal air (). Let ,
and
denote the bolus volume, dilution air volume behind of the bolus and dilution air volume ahead of the bolus in the inhaled tidal air, respectively. In addition,
,
and
are the delivery times of boluses
,
, and
, and
is the inhalation flow rate. Dilution air volume
is first inhaled into the lung followed by MCS particles contained in volume
, and finally dilution air volume
. While intra-bolus concentration and particle size remain constant, inter-bolus properties vary during the puff inhalation. To calculate particle deposition per bolus, volumes
and
are assumed to be initially filled with MCS particles of concentration
(). The total number of particles in the inhaled air (
) is then calculated as follows:
The number of particles that are deposited by various mechanisms is given by
where deposition fraction
is the fraction of MCS particles in the inhaled volume (
) that is deposited in the lung and is mathematically defined based on inhaling volume
. The volume ratio in Equation (27) redefines deposition fraction based on inhaled volume
. Next, volume
alone is assumed to contain MCS particles (). Thus, the total number of particles in volume
is given by
The number of particles deposited as a result of inhaling volume is
where
is the deposition fraction of particles in volume
. It is defined based on volume
. The volume ratio in Equation (29) redefines deposition fraction based on volume
. Once the number of deposited particles is found for the two cases above, deposition fraction for the bolus
is simply the difference in the number of particles deposited divided by the total number of inhaled particles
Deposition fraction of particles in the inhaled tidal air is the mass of deposited particles in all boluses divided by the total mass of inhaled particles. Thus,
where
is the inhalation time and i is the bolus internal number. If the time intervals are selected to be the same, the above equation is further simplified to
where N is the number of bolus intervals. Here, N = 100 for a 4 s inhalation time, which corresponded 0.04 s per time step or 25 time steps per second.
Results and discussions
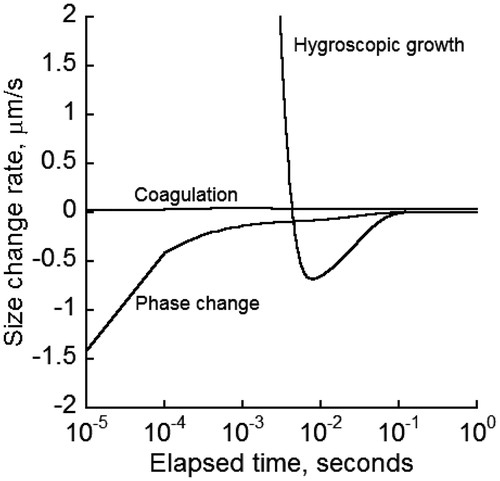
Airway deposition of cigarette smoke particles (CSP) is directly related to particle size, which undergoes continuous change once entered the lung. To gain an understanding of and to examine the influence of various mechanisms on the evolution of particle diameter, the temporal rate of particle diameter change in oral cavities due to coagulation and exchange of water vapor and nicotine with the surrounding air was calculated for an initial MCS particle diameter of 0.2 μm, airborne concentration of #/ cm3, and a relative humidity of 99% (). Nicotine exists in the particulate phase in protonated and non-protonated forms. Only the non-protonated form of nicotine was tracked because the protonated form had a low volatility and was combined with other semi-volatile components. Predictions indicated that initially the rate change of diameter by water absorption was significantly higher than that by the other two mechanisms, then decreased rapidly and became negative to allow a reverse process in which water vapor was released into the air temporarily for a brief time. The diameter rate change by water transfer subsequently rose to zero where no more exchange of the water between the particle and surrounding environment occurred. As a result, MCS particles reached a stable diameter. The rate of diameter change due to nicotine phase change was negative, which indicated a nicotine release from liquid to vapor form. The rate of diameter change by phase change rose quickly to zero, which corresponded to a fast depletion of nicotine from the particles. It is assumed that the non-protonated nicotine has completely evaporated when particle diameter reached stability. The rate of diameter change by coagulation appeared independent of the other two mechanisms and remained fairly stable. Water vapor exchange and phase change competed in a way to counteract each other: a decrease in one mechanism caused an increase in the other so that MCS particles reached a final, stable size.
Figure 2. Size change rate of MCS particles initially of 0.2 µm in the human lung by hygroscopic growth, coagulation and phase change for an initial particle concentration of 109 #/ cm3 and 99% relative humidity.
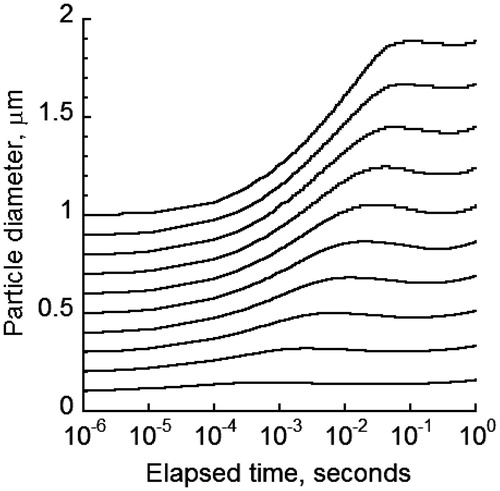
Different initial diameters of cigarette particles have been reported in part due to variation in chemical composition and combustion among different brands of cigarette. MCS particle diameter change in the oral cavity was calculated in for initial diameters between 0.1 and 1 μm with initial concentration of 109 #/ cm3. There was up to a two-fold increase in diameter. The higher the initial diameter, the larger the extent of increase would be. The diameter growth pattern showed an initial increase followed by a small decline before rising again and approaching a final plateau. The reduction and subsequent increase in diameter was attributed to the brief period of water evaporation from MCS particles after an initial hygroscopic growth (). Once water evaporation ceased, coagulation provided the subsequent driving force to increase the particle diameter to reach the final, stable value.
Figure 3. Change in particle size of 0.1–1 µm size MCS particles due to various growth mechanisms for particle concentration of 109 #/ cm3.
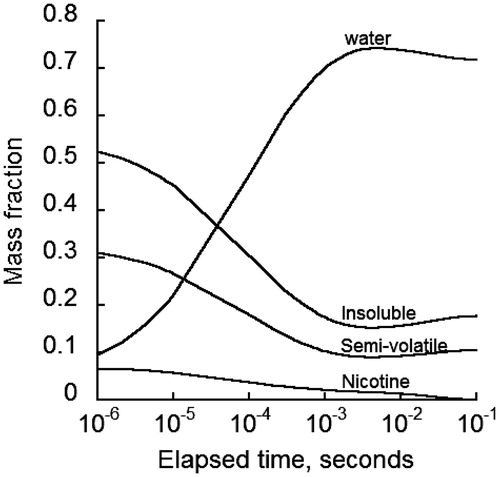
Particle growth depends in part on the amount of different constituents making up the particle. In addition, the mass of specific components of MCS particles is needed to assess component-specific deposition and ensuing biological responses. The mass of different components of MCS particles varies while travelling through the respiratory tract mainly due to water vapor exchange, nicotine evaporation and MCS particle coagulation. gives the mass fraction of each component in a single 0.2 μm MCS particle while airborne in the oral cavity. The largest change in the proportions of particle components was initially due to the absorption of water vapor, which was accompanied by a decrease in the portion of nicotine, semi-volatile and insoluble components. The mass fraction of water in the particle reached a peak of 74% followed by a gradual decrease toward a final value of 73%. Concurrently, the mass fractions of semi-volatile and insoluble components decreased to minimum values of 9% and 15%, respectively, which rose gradually to 10% and 17%, respectively. However, the non-protonated nicotine was completely evaporated from the particles after only 0.1 s. Longer evaporation times were observed in the measurements of Armitage et al. (Citation2004) in exhaled smoke after mouth-hold and Lewis et al. (Citation1995), Lipowicz & Piadé (Citation2004) for the denuder data. The discrepancy is likely due to uncertainty in environmental parameters (e.g. relative humidity) and nicotine conversion rate from protonated to non-protonated form. It is noted that the slight fluctuations of the mass fraction curves were due to water vapor release from the particles and subsequent growth by coagulation ().
Figure 4. Mass fraction changes of various constituents of initially 0.2 µm diameter MCS particles with time after generation at a relative humidity of 99%.
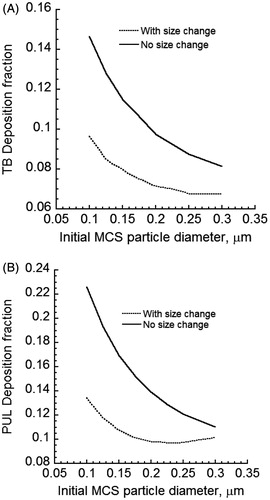
The size change of CSP will impact deposition in various regions of the lung. compared deposition predictions of MCS particles for cases of constant and changing particle size in the tracheobronchial (TB) and pulmonary (PUL) regions of the human lung when the cloud effect is excluded and no mixing of the puff with the dilution air occurred after the mouth-hold. For initially sub-micrometer sized MCS particles of 0.3 µm and smaller diameters, Brownian diffusion was the dominant deposition mechanism. Thus, deposition fraction decreased when the (initial) size of the particles was increased. The deposition of MCS particles with initial MCS particle diameters smaller than 0.3 µm was reduced in both TB and PUL regions. MCS particle diameter increased as a result of absorbing mainly water vapor. This increase in size reduced Brownian diffusion and hence airway deposition. If the initial sizes were sufficiently large to allow particle deposition by inertial impaction and gravitational settling, the opposite trend would be observed. It should be noted that for freshly generated cigarette particles with diameters below 0.3 µm, predicted lung deposition fractions in under-predicted reported measurements of MCS particle deposition in the lung (Baker & Dixon, Citation2006). Clearly an account of the colligative (cloud) effect is required for realistic predictions of particle deposition.
Figure 5. Deposition fractions of initially 0.2 µm diameter MCS particles in the TB and PUL regions of the human lung when the size of MCS particles is either constant or increasing: (A) TB deposition and (B) PUL deposition Cloud effects and mixing of the dilution air with the puff after the mouth hold were excluded.
As discussed earlier and noted in , traditional deposition models developed for environmental aerosols fall short of reasonable predictions of MCS particle losses. This under-prediction hints toward possible additional physical mechanisms responsible for excess deposition. As previously stated, laboratory observations have indicated that the cigarette puff enters the oral cavity and remains intact while puff concentration decreases as a result of deposition in the oral cavity (Price et al., Citation2012). Subsequently, the puff penetrates the lung and gradually disintegrates over several airway generations. Hence, the cloud model was implemented in calculations of the MCS particles in the respiratory tract. Information on cloud diameter is needed to obtain realistic predictions of MCS particle losses. While directly related to physical dimensions of the cloud, which in this case is proportional to the airway dimensions, the cloud effect also depends on the concentration (particle volume fraction) and permeability of MCS particle cloud in the puff. The tighter the packing or the higher the concentration for the same physical dimensions of the cloud, the lower the hydrodynamic drag will be. With hydrodynamic drag and air resistance reduced, inertial and gravitational forces on the cloud increase and an increase in MCS particle deposition will be predicted.
Model prediction with and without the cloud effects were compared with measurements and predictions from one other study (Broday & Robinson, Citation2003). provides the predicted values from different studies for an initial particle diameter of 0.2 μm. Model predictions without cloud effects (k = 0) fell short of reported measurements (Baker & Dixon, Citation2006). Inclusion of the cloud effect increased predicted total deposition fraction to mid-range of reported measurements by Baker & Dixon (Citation2006). The predicted total deposition fraction also agreed with predictions from Broday & Robinson (Citation2003). However, differences in regional depositions were apparent, which were due to differences in model structures.
Table 1. Comparison of model predictions with available information in the literature.
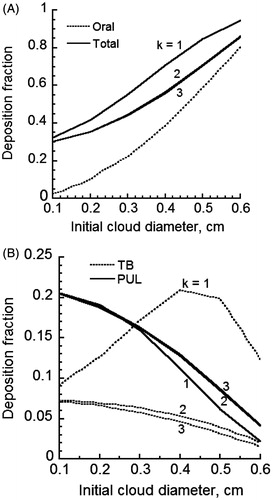
gives the predicted deposition fraction of MCS particles when cloud effects are considered in the oral cavities, various regions of lower respiratory tract (LRT) and the entire respiratory tract. Because of uncertainty regarding the degree of cloud breakup in the lung, different values of k in Equation (20) were used. Thus, cases of puff mixing and breakup in each generation by the ratio of successive airway diameters (k = 1), cross-sectional areas (k = 2) and volumes (k = 3), respectively, were considered. The initial cloud diameter was allowed to vary between 0.1 and 0.6 cm (Broday & Robinson, Citation2003). Particle losses in the oral cavity were found to rise to 80% (), which fell within the reported measurement range in the literature (Baker & Dixon, Citation2006). There was a modest change in deposition fraction with the initial cloud diameter. The cloud breakup model for k = 1 was found to predict distinctly different deposition fractions from cases of k = 2 and 3 while similar predictions were observed for k = 2 and 3. When mixing of the puff with the dilution air was paired with the cloud breakup model using the ratio of airway diameters, deposition fractions varied between 30% and 90%. This was in agreement with the results of Broday & Robinson (Citation2003), which predicted about 60% deposition fraction. Total deposition fractions were appreciably lower when k values of 2 and 3 were used (). Regional deposition of MCS particles is given in for different initial cloud diameters. Deposition in the TB region was significantly higher for k = 1, which suggested a strong cloud effect. Deposition fractions for k = 2 were slightly higher than predictions for k = 3. Deposition in the PUL region was similar for all k values, which suggested a diminishing cloud breakup effect in the deep lung. There was an opposite trend with k value for deposition fractions in the TB and PUL regions. This was most likely due to the filtering effect of particles in the TB regions, which limited the amount of particles reaching the PUL region for deposition. Comparing deposition fractions for all three k values, it appeared that only the case of k = 1 exhibited a significant cloud breakup effect and was most appropriate to use. Predicted regional and total deposition fractions agreed qualitatively with reported measurements (Baker & Dixon, Citation2006). However, specific values for all other parameters such as the relative humidity and particle size are needed before detailed comparison can be made between predictions and measurements.
Figure 6. Deposition fraction of initially 0.2 µm diameter MCS particles for various cloud radii for 99% humidity in oral cavities and 99.5% in the lung with no cloud effect and complete-mixing of the puff with the dilution air (A) oral and total deposition and (B) TB and PUL deposition.
The cloud effect enhances particle losses in the large airways of the lung due to reduced drag, which enhances deposition by other mechanisms. The predicted deposition fraction of 0.2 μm initial diameter particles for different airway generations of the lung is given in for cases of complete- and no-mixing of the cloud with the dilution air at the end of mouth-hold. An initial cloud diameter of 0.4 cm was used in the calculations. Equation (20) was used to find the cloud diameter in the subsequent airways. In addition, presents deposition predictions when there is no cloud effect. Predicted deposition fractions in gave two peaks; first in the uppermost generations of the LRT due to impaction losses and second in the alveolar region due to losses by sedimentation and diffusion. This trend was also observed in the predictions of Broday & Robinson (Citation2003). However, predicted values were significantly different, which is likely due to differences in the predictive models.
Figure 7. Deposition fraction of 0.2 µm initial diameter particles per airway generation of MCS particles for an initial cloud diameter of 0.4 cm (A) complete-mixing and (B) no-mixing.
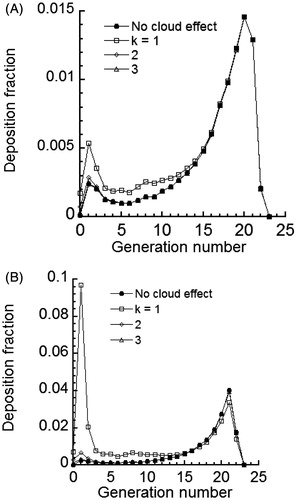
Comparison of deposition fractions with and without the cloud effect model showed that the cloud effect was most significant in the large airways of the lung. The effect decreased distally with lung depth (increasing airway generation number) and was absent in the PUL region. Furthermore, the cloud diameter calculated based on the value of k = 1 had an appreciable effect on deposition fraction. The cloud effect was minimal for k values of 2 and 3. This finding was observed for both cases of complete-mixing () and no-mixing of the puff with the dilution air (). Comparison of cases of complete- (simulating nasal breathing of dilution air) and no-mixing (simulating oral breathing of dilution air) revealed that mixing tended to result in the reduction of MCS particle deposition by one order of magnitude. Given that the degree of mixing varies by individuals, provides potential upper and lower limits for predicted airway deposition fraction.
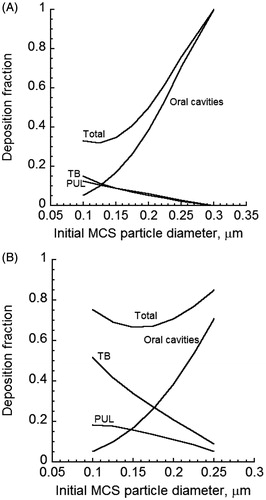
There is variation regarding the primary size of freshly generated MCS particles. The initial size of MCS particles impacts their growth and deposition throughout the lung. gives the predicted lung deposition fraction for an initial cloud diameter of 0.4 cm entering the respiratory tract but changing subsequently by Equation (20) with k = 1 as the puff penetrates into the lung. Calculations are made for cases of complete-mixing () and no-mixing () of the puff with the dilution air on inhalation. Predicted deposition fractions for the case of the cloud effect included (, panels A and B) were significantly higher than when the cloud effect was excluded (). However, deposition fractions depended strongly on the size of freshly generated MCS particles. While oral deposition increased significantly with the initial size of the particles as a result of gravitational settling, TB and PUL deposition tended to decrease with the initial size of MCS particles. Consequently, the overall deposition decreased initially but increased for particles larger than 0.16 µm due to increasing deposition in the oral cavity. clearly illustrates the dependence of deposition on initial size of MCS particles. Hence, accurate measurements for the particle size are critical in studies of deposition measurements of MCS particles in the lungs of smokers.
Figure 8. Deposition fraction of various size MCS particles in the oral cavities and the respiratory tract for an initial cloud diameter of 0.4 cm (A) complete-mixing and (B) no-mixing.
Concluding remarks
MCS particle growth by various mechanisms appears to reach a plateau beyond which no further growth can occur. If one mechanism is altered, others compensate to ensure a final stable size. Particle growth will only lead to decreased deposition of MCS particles in lung airways because Brownian diffusion is the dominant mechanism of deposition for cigarette particles. Since the smoke puff contains closely packed particles of high number concentration which behave as a cloud, high deposition of particles occurs in the large airways of the lung due to impaction and deep lung by sedimentation and diffusion. The deposition of MCS particles is directly related to the initial size of the freshly generated MCS particles. The smaller the size, the lower the deposition of particles in the lung airways will be. Model predictions indicate that particle deposition decreases with increasing mixing of the dilution air with the puff after the mouth-hold. Cases of complete mixing with k = 1 and 2 appear to give the best comparison with measurements. Predicted deposition of MCS particles is in general agreement with available measurements when the cloud effect is included. However, there is uncertainty regarding parameter values of CSP and its constituents. Thus, improved predictions of particle deposition require the use of accurate input parameters in the deposition model.
Declaration of interest
This study was funded by British American Tobacco. The authors report no conflicts of interest. The authors alone are responsible for the content and writing of this article.
Supplementary Material
Download PDF (1.2 MB)Supplementary Material
Download PDF (1.2 MB)Supplementary Material
Download PDF (1.2 MB)Supplementary Material
Download PDF (1.2 MB)Supplementary Material
Download PDF (1.2 MB)Supplementary Material
Download PDF (1.2 MB)Supplementary Material
Download PDF (1.2 MB)Supplementary Material
Download PDF (1.2 MB)Supplementary Material
Download PDF (1.2 MB)Supplementary Material
Download PDF (1.2 MB)References
- Armitage AK, Dixon M, Frost BE, et al. (2004). The effect of tobacco blend additives on the retention of nicotine and solanesol in the human respiratory tract and on subsequent plasma nicotine concentrations during cigarette smoking. Chem Res Toxicol 17:537–44
- Asgharian B. (2004). A model of deposition of hygroscopic particles in the human lung. Aerosol Sci Technol 38:938–47
- Asgharian B, Hofmann W, Bergmann R. (2001). Particle deposition in a multiple-path model of human lung. Aerosol Sci Technol 34:332–9
- Asgharian B, Price OT. (2007). Deposition of ultrafine (nano) particles in the human lung. Inhalation Toxicol 19:1045–52
- Baker RR, Dixon M. (2006). The retention of smoke constituents in the human respiratory tract. Inhalation Toxicol 17:255–94
- Brinkman HC. (1947). A calculation of the viscous force extended by a flowing fluid on a dense swarm of particles. Appl Sci Res A1:27--34
- Broday DM, Robinson R. (2003). Application of cloud dynamics to dosimetry of cigarette smoke particles in the lungs. Aerosol Sci Technol 37:510–27
- Cabot R, Hawke J, McAughey J, et al. (2012). Dissolution measurements of smoke particles in a liquid based suspension. Annual Aerosol Science Conference; 2012 Apr 03–04; Bristol, UK. Available from: http://www.bat-science.com [Last accessed: 28 Oct 2013]
- Callicutt CH, Cox RH, Farthing D, et al. (2006). The ability of the FTC method to quantify nicotine as a function of ammonia in mainstream smoke. Beitr Tabakforsch 22:71–8
- Cinkotai FF. (1968). The growth of cigarette smoke particles suspended on fine platinum wire in moist air. Beitr Tabakforsch 4:189–95
- Dalhamn T, Editors M, Rylander R. (1968). Retention of cigarette smoke components in human lungs. Arch Environ Health 17:746–8
- Friedlander SK. (2000). Smoke dust and haze: fundamentals of aerosol dynamics. New York: John Wiley and Sons
- Hicks JF, Pritchard NJ, Black A, et al. (1986). Experimental evaluation of aerosol growth in the human respiratory tract. In: Aerosols: Formation and Reactivity, 2nd International Aerosol Conference. Berlin: Pergamon Journals Ltd., 244–7
- Kane D, Asgharian B, Price OT, et al. (2010). Effect of smoking parameters on the particle size distribution and predicted airway deposition of mainstream cigarette smoke. Inhalation Toxicol 22:199–209
- Keith CH. (1982). Particle size studies on tobacco smoke. Beitr Tabakforsch 11:123–31
- Keith CH, Derrick HC. (1960). Measurements of the particle size distribution and concentration of cigarette smoke by the “Conifuge”. J Colloid Sci 15:340–56
- Lewis DA, Colbeck I, Mariner DC. (1995). Dilution of mainstream tobacco smoke and its effects upon the evaporation and diffusion of nicotine. J Aerosol Sci 26:841–6
- Lipowicz PJ, Piadé JJ. (2004). Evaporation and subsequent deposition of nicotine from mainstream cigarette smoke in a denuder tube. J Aerosol Sci 35:33–45
- Longest PW, Xi J. (2008). Condensational growth may contribute to the enhance deposition of cigarette smoke particles in the upper respiratory tract. Aerosol Sci Technol 42:579–602
- Martonen TB. (1992). Deposition pattern of cigarette smoke in human airways. Am Ind Hyg Assoc J 53:6–18
- Martonen TB, Musante CJ. (2000). Importance of cloud motion of cigarette smoke deposition in the lung. Inhalation Toxicol 12:261–80
- Muller W, Hess GD, Scherer PW. (1990). A model for cigarette smoke particle deposition. Am Ind Hyg Assoc J 51:245–56
- Neale G, Epstein N, Nader W. (1973). Creeping flow relative to permeable spheres. Chem Eng Sci 28:1865--74
- Phalen RF, Oldham MJ, Mannix RC. (1994). Cigarette smoke deposition in the tracheobronchial tree: evidence for colligative effects. Aerosol Sci Technol 20:215–26
- Price O, Asgharian B, Schroeter J, et al. (2012). Losses of cigarette smoke particles in oral cavities. AAAR; 2012 October 8–12, 2012; Hyatt Regency Minneapolis Minneapolis, Minnesota
- Robinson RJ, Yu CP. (1998). Theoretical analysis of hygroscopic growth rate of mainstream and sidestream cigarette smoke particles in the human respiratory tract. Aerosol Sci Technol 28:21–32
- Robinson R, Yu CP. (1999). Coagulation of cigarette smoke particles. J Aerosol Sci 30:533–48
- Robinson RJ, Yu CP. (2001). Deposition of cigarette smoke particles in the human respiratory tract. Aerosol Sci Technol 34:202--15
- St. Charles FK, Krautter GR, Mariner DC. (2009). Post-puff respiration measures on smokers of different tar yield cigarettes. Inhalation Toxicol 21:712–18
- Yu CP. (1978). Exact analysis of aerosol deposition during steady breathing. Powder Technol 21:55–62