
Abstract
Screening tests are widely used in medicine to assess the likelihood that members of a defined population have a particular disease. This article presents an overview of such tests including the definitions of key technical (sensitivity and specificity) and population characteristics necessary to assess the benefits and limitations of such tests. Several examples are used to illustrate calculations, including the characteristics of low dose computed tomography as a lung cancer screen, choice of an optimal PSA cutoff and selection of the population to undergo mammography. The importance of careful consideration of the consequences of both false positives and negatives is highlighted. Receiver operating characteristic curves are explained as is the need to carefully select the population group to be tested.
Introduction
A screening test (sometimes termed medical surveillance) is a medical test or procedure performed on members (subjects) of a definedFootnote1 asymptomatic population or population subgroup to assess the likelihood of their members having a particular disease.Footnote2 With few exceptions, screening tests do not diagnose the illness. Rather subjects who test positive typically require further evaluation with subsequent diagnostic tests or procedures. Examples of actual or proposed screening tests include the pap smear for cervical cancer (Arbyn et al., Citation2008; Mayrand et al., Citation2007), mammography (or tomosynthesis) for breast cancer (Friedewald et al., Citation2014; Rafferty et al., Citation2013), PSA (and/or digital rectal exam) for prostate cancer (Catalona et al., Citation1991), cholesterol level for heart disease, X-ray (or computed tomography) for lung cancer (discussed below), PKU test for phenylketonuria in newborns, B-natriuretic peptide test for screening patients undergoing echocardiography to determine left ventricular dysfunction (Maisel et al., Citation2001), and urinalysis or other screening tests for sexually transmitted diseases or illicit drug use (Gastwirth, Citation1987; Jafari et al., Citation2013; Watson et al., Citation2002). Screening tests may be based on the measurement of a particular chemical in the blood or urine (a quantitative measurement) or some qualitative assessment by a trained observer (e.g. interpretation of an x-ray or CT scan, or semi-quantitative analysis by a polygraph operator).
A major objective of most screening tests is to reduce morbidity or mortality in the population group being screened for the disease by early detection, when treatment may be more successful.Footnote3 An alternative objective might be to reduce morbidity or mortality in persons other than the screened population who might be impacted by a communicable and preventable disease (such as screening for HIV in blood donorsFootnote4) among subjects in the population being tested.
Although some of the key analytical/statistical results applicable to the design and evaluation of screening tests have been around since the late 1700s, when the Reverend Thomas Bayes first developed the theorem that bears his name and numerous tutorials or review articles have been written more recently (Alberg et al., Citation2004; Altman & Bland, Citation1994a,Citationb,Citationc; Deeks & Altman, Citation2004; Goetzinger & Odibo, Citation2011; Lalkhen & McCluskey, Citation2008; Thompson et al., Citation2005; Zou et al., Citation2007), there is still some confusion among practitioners about how to interpret and assess the utility of screening tests (Casscells et al., Citation1978; Grimes & Schutz, Citation2002; Manrai et al., Citation2014; Wegwarth et al., Citation2012), which is why the article might be of interest to readers of Inhalation Toxicology.
Definitions
In its simplest form, the screening test has only two outcomes: positive (suggesting that the subject has the disease or condition) or negative (suggesting that the subject does not have the disease or condition).Footnote5 An ideal screening test would have a positive result if and only if the subject actually has the disease and a negative result if and only if the subject did not have the disease. Actual screening tests typically fall short (sometimes far short, see below) of this ideal. Instead, most screening tests exhibit what are termed false positives and false negatives to varying degrees. Logical possibilities are described in the 2 × 2 .
Table 1. Logical possibilities for true disease state and screening test outcome.
In most cases,Footnote6 screening tests need to be benchmarked against an agreed “Gold Standard” test (Greenhalgh, Citation1997). The gold standard test is a diagnostic test that is usually regarded as definitive (e.g. by biopsy or autopsy). The actual gold standard test may be invasive (e.g. biopsy), unpleasant, too late (e.g. autopsy) to be relevant, too expensive or otherwise impractical to be used widely as a screening test.
provides examples of various screening tests and possible Gold Standards.
Table 2. Examples of screening and diagnostic tests and possible Gold Standards.
In principle, a “Gold Standard” should have 100% sensitivity and 100% specificity (see below for definitions), that is, it would never make a classification error. In practice that may not be the case and the “Gold Standard” is regarded as the best test under “reasonable conditions.” As noted by Versi (Citation1992):
“As science increases its hold on the practice of medicine we become more aware of the limitations of the clinical method. Unfortunately, we also become more aware of the limitations of various diagnostic tests. Nevertheless, at any given time there may well be a consensus that a given test in a given situation is the best available test. It therefore serves as the gold standard against which newer tests can be compared. When enough data have accumulated to make that gold standard untenable, it can perfectly reasonably be replaced by another. This can then preside until it too is toppled.”
Troy et al. (Citation1996) offered the following perspective on gold standards:
“… however, gold standards for comparison are not always available. Moreover, a perfect gold standard is less often available than an imperfect gold standard (‘alloyed gold standard’), an adopted standard based on observed data which is measured with error.”
For the purposes of this discussion, the gold standard test is assumed to be without error. Several authors have developed statistical approaches for dealing with “alloyed gold standards” (Dendukuri, Citation2011; Hawkins et al., Citation2001; Johnson et al., Citation2001; Joseph et al., Citation1995; Lewis & Torgerson, Citation2012; Rutjes et al., Citation2007; van Smeden et al., Citation2014; Walter & Irwig, Citation1988). As might be expected, none of these alternative procedures perform as well as if a true Gold Standard were available, but several are improvements over naively assuming the Gold Standard is “unalloyed.”
The possible outcomes shown in are quantified by two probabilities, termed the test sensitivity and specificity. These are two key characteristics of a screening test.
Sensitivity is the test’s ability to correctly designate a subject with the disease as positive; it is the conditional probability (Pr{T+|D+})Footnote7, denoted by the symbol S that a subject who has the disease, D+, tests positive, T+. A highly sensitive test means that there are few false negative results; few actual cases are missed. Ceteris paribus, tests with high sensitivity have potential value for screening, because they rarely miss subjects with the disease (Goetzinger & Odibo, Citation2011).
Specificity is the test’s ability to correctly designate a subject without the disease as negative; it is the conditional probability (Pr{T−|D−}), denoted by the symbol Sp that a subject who does not have the disease, D−, tests negative, T−. A highly specific test means that there are few false positive results. Therefore, high specificity tests perform well for diagnosis because of low false positive errors. Tests with low specificity have the disadvantage that (among other things) many subjects without the disease will screen positive and potentially receive unnecessary (and possibly invasive, risky or expensive) follow-up diagnostic or therapeutic procedures.
Publications about screening tests typically report both the sensitivity and specificity of the test. It is clearly desirable to have a test that is both highly sensitive and highly specific. (In some cases, it may be possible to structure the test so as to tradeoff sensitivity and specificity, as discussed below.)
shows a sample of reported sensitivities and specificities of various screening tests as summarized by Alberg et al. (Citation2004), denoted by the triangles, and from our own literature search (refer Table A1), denoted by the circles. As can be seen, there are a substantial number of screening tests with both high sensitivity and high specificity, but also many that fall far short of this ideal. It should be noted that not all the screening tests shown in are actually used at present – some may have been found wanting.
Figure 1. Reported sensitivity and specificity of a sample of screening tests reported in the literature. Circles are studies summarized here (Table A1) while triangles represent studies reported in Alberg et al. (Citation2004).
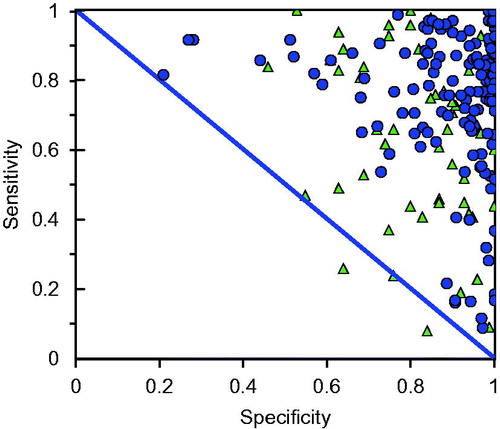
As some test results (e.g. reading an X-ray) require interpretation, it is possible that there will be inter-observer variation (notwithstanding attempts at standardization) so that the reported sensitivity and specificity may vary with the observer (Deeks, Citation2001; Elmore et al., Citation2002 for illustrations). This creates issues when large scale screening tests are being contemplated and it is necessary to extrapolate or generalize from screening test data based on pilot studies, often conducted by highly specialized and experienced personnel. Refer Whiting et al., (Citation2004) and for a useful systematic review of sources of variation and bias in studies of diagnostic or screening accuracy.
Table 3. Common sources of bias in study design.
Frequently, it is of interest to compare one screening test (a potential improvement) with another. It is important to make careful statistical comparisons to assess whether the “improved” test is actually superior and to calculate confidence intervals on the various proportions (e.g. using the methods given in Newcombe, Citation1998). Ideally such comparisons should be made on the same population and randomly assigning subjects to each test.
Before addressing additional important definitions applicable to screening tests it is appropriate to mention some of the consequences of false negatives and false positives in screening tests. Briefly:
A false negative means that a subject with the disease is misclassified as not having the disease on the basis of the screening test. The subject is given a misleading impression that he/she is free of the disease and thus does not undergo more suitable diagnostic tests. At a minimum this means that correct diagnosis is delayed (perhaps until the subject develops symptoms) and, in the case of diseases for which early treatment offers improved chances of recovery, there is increased risk of morbidity and mortality [refer Kaufman et al. (Citation2014) for an example with breast cancer]. False negatives from a screening test for illicit drug use or a polygraph test design to detect deception have obvious negative consequences (Gastwirth, Citation1987). As another example, failure to detect someone with an STD, may result in increased morbidity or mortality of future sexual partners of the subject. Systematic reviews of the consequences of false negatives are provided in Petticrew et al. (Citation2000, Citation2001). False negatives may also lead to legal action being taken by affected individuals and may reduce public confidence in screening.
A false positive means that a subject without the disease is misclassified as having the disease on the basis of the screening test. The subject is given the misleading impression that he/she has the disease and thus endures the unnecessary psychological consequences as well has having to undergo possibly invasive diagnostic or treatment procedures. The consequences of a false positive can be material. For example:
Elmore et al. (Citation1998) provides examples of the consequences of false-positive screening mammograms. Among other things, false-positive mammograms led to more outpatient visits, diagnostic imaging examinations, and biopsies than false positive clinical breast examinations. In one patient, cellulitis requiring hospitalization for surgical debridement and intravenous antibiotic therapy developed after a biopsy prompted by a false positive mammogram.
Wiener et al. (Citation2011) provide an assessment of the population-based risk for complications after transthoracic needle lung biopsy of a pulmonary nodule discovered using a CT scan.
Croswell et al. (Citation2009) reported on the cumulative incidence of false-positive results in repeated multimodal cancer screening. Among other things this study revealed that for a woman the cumulative risk of undergoing a false-positive-prompted invasive diagnostic procedure was about 12.3% after 4 tests increasing to 22.1% after 14 tests. For men the corresponding percentages were 17.2% after 4 tests and 28.5% after 14 tests.
A study of 12 669 Swedish youths (aged 16 and over) diagnosed with cancer found a 60% increased risk of suicide or attempted suicide (Lu et al., Citation2013). A false positive in this instance has a material adverse consequence.
Another study (Baade et al., Citation2006) of people diagnosed with cancer in Queensland, Australia indicated that this group experienced a SMR of 149.9 for non-cancer deaths.
False positives may also decrease the likelihood that a subject will return for subsequent follow-up procedures (Álamo-Junquera et al., Citation2011). And, false positives may also result in litigation and loss of public confidence in screening.
The consequences of both false positives and false negatives need to be carefully considered in assessing the utility of a screening test. In some cases, it may be possible to alter the decision criterion (or criteria) of a particular screening test to alter the sensitivity or specificity of the test and thus trade off one type of error for another. For such cases, the usual procedure is to calculate a receiver-operating characteristic curve (discussed below) for the test (Thompson et al., Citation2005; Zou et al., Citation2007). As well, some of the consequences of false positives can be altered by the choice of follow-up procedures among those subjects who test positive. For example, less invasive or non-invasive diagnostic tests can be selected, depending upon the specific outcomes of the initial screening test.
The prevalence of the disease is the fraction, Π, of subjects in the population under study that have the disease. It is equal to the a priori probability (Pr{D+}) that a subject selected at random from the population or subgroup has the disease.Footnote8 Prevalence, along with sensitivity and specificity, is a key determinant of the utility of the screening test (see below). For reasons discussed below, it is desirable to be able to define the population to be screened in such a way that the prevalence in the test population is high. The reported prevalence among various populations that are the subject of screening tests (Alberg et al., Citation2004) range from 0.05 to 0.9, but clustered among the higher values.
There are four additional relevant characteristics of a screening test, the positive predictive value, negative predictive value, accuracy and likelihood ratio:
The positive predicted value (PPV) is the probability that a subject with a positive (abnormal) test actually has the disease (Pr{D+|T+}) also called the a posteriori probability. Given the above notation;
PPV = ΠS/((ΠS + (1 – Π)(1 – Sp)).
In words, the a posteriori probability that the subject has the disease given a positive test is the ratio of true positives (the product of the prevalence and sensitivity) divided by total positives (the sum of true positives and false positives). It is desirable that the screening test has a high PPV.
The negative predicted value (NPV) is the post-test probability that the subject has no disease given a negative test result (Pr{D−|T−}) also termed the a posteriori probability given a negative test. Given the above notation:
NPV = (1 − Π)Sp/((1 − Π)Sp + Π(1 − S)).
In words, the a posteriori probability that the subject does not have the disease given a negative test is the ratio of the true negatives (complement of prevalence times the specificity) divided by the total negatives (the sum of true negatives and false negatives). It is also desirable that the test has a high NPV.
The accuracy (also termed overall accuracy, diagnostic accuracy or test efficiency) of a test is the overall proportion of correct test results. This includes true positives and true negatives. Mathematically it is calculated from the equation:
ΠS + (1 − Π)Sp.
The term ΠS includes the true positives (prevalence times sensitivity) and the term (1 − Π)Sp are the true negatives (probability the subject does not have the disease times the probability that the test is negative given the subject is without disease). As noted by Alberg et al., (Citation2004): “Overall accuracy is the weighted average of a test’s sensitivity and specificity, where sensitivity is weighted by prevalence and specificity is weighted by the complement of prevalence.” Refer to Alberg et al. (Citation2004) for a discussion of the limitations of this measure of screening efficiency.
The Likelihood ratio is another term used to characterize screening tests; it is defined as the probability of a subject who has the disease testing positive divided by the probability of a subject who does not have the disease testing positive, L = S/(1 − Sp).
To many, the PPV or NPV are the key characteristics of a screening program. It is important to remember that the PPV or NPV are dependent on both the population under study and the technical characteristics of the screening test.Footnote9 A screening test with relatively high sensitivity and specificity may still have a low PPV if the population prevalence is sufficiently low. Thus, to assess a proposed screening test it is necessary to evaluate both the technical and population characteristics.
The probability of a positive test, Pr(T+) is the sum of the probabilities of a subject with the disease correctly testing positive and someone without the disease incorrectly testing positive, or ΠS + (1 − Π)(1 − Sp). Some have suggested using the observed fraction of positive tests, F+, (sometimes termed the apparent prevalence) as a surrogate for or estimate of Π, but, unless both the sensitivity and specificity are both equal to unity, this will give a biased answer. Given the definitions, an improved estimate for Π is equal to (F+ + Sp −1)/(S + Sp – 1). Refer Gart & Buck (Citation1966), Gastwirth (Citation1987), Levy & Kass (Citation1970) and Rogan & Gladen (Citation1978) for a derivation and Karaağaoğlu (Citation1999) for additional analyses.
A numerical example
All of these screening test characteristics are determined by testing a particular population (using one or more screening tests) and recording the number of subjects that fall into the various categories shown in . To illustrate, provides a hypothetical data from a screening test evaluation of a population of 10 000 subjects, assumed to have a disease prevalence of 0.5, with a calculated sensitivity of 0.9 (95% confidence interval including continuity correction [0.8913, 0.9081]), and a specificity of 0.3 (95% confidence interval including continuity correction [0.2874, 0.313]).Footnote10
Table 4. Hypothetical data from screening experiment.
also illustrates the equations and numerical computation of the various quantities defined above. The bottom of provides the calculation (using Bayes’ theorem) of the a posteriori probabilities corresponding to either a positive or negative test outcome. In this example, a subject who tests positive has an a posteriori probability of having the disease of 0.5625 – not materially greater than the a priori prevalence (0.5) in the population. This is because although the sensitivity is relatively high, the specificity of the test is relatively low. Conversely, a subject who tests negative has an a posteriori probability of not having the disease of 0.75 – in this case, clearly different from the a priori prevalence (0.5) in the population in this example.
Further analysis of the numerical example
The a posteriori probability of having the disease given a positive test result, or PPV, is one obvious measure of the evidence provided by the test. Other things being equal, tests with high specificity (few false positives) tend to have a high PPV. However, unlike sensitivity or specificity (which might be termed “pure characteristics” of the test), the PPV is also a function of the characteristics of the population under study; PPV is a function of the prevalence. In the numerical example given in , the prevalence was assumed to be 0.5 (i.e. 50% of the population or subpopulation had the disease). shows how the PPV, NPV and accuracy depend upon the assumed prevalence Π in the population being screened. As can be seen, both PPV and accuracy decrease (sharply in the case of PPV) as Π decreases from the base case assumption of 0.50. Conversely, the NPV increases as the prevalence decreases.
Figure 2. Positive predictive value (PPV), negative predictive value (NPV) and accuracy as a function of assumed prevalence for first numerical example.
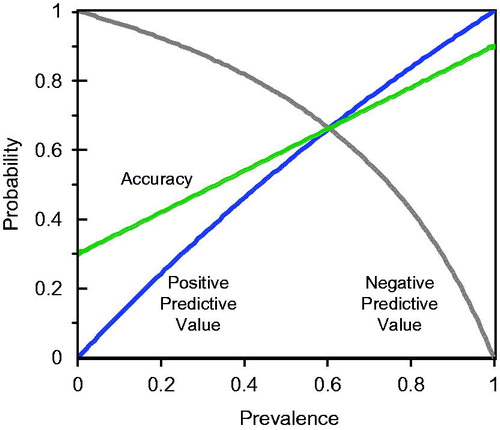
To help place the content of in perspective, note that if the prevalence, Π, were as low as 0.16, the Positive Predicted Value, PPV, would be only 0.2. Put another way, a subject who tested positive under these circumstances would have an 80% chance of not having the disease! And, if Π were as low as 0.08, there would be a 90% chance that a subject with a positive test would be disease free. If the consequences of a positive test (e.g. worry, invasive or expensive and unnecessary follow-up procedures) were substantial, this would not be a satisfactory screening test. Thus, the quantity 1 – PPV might aptly be termed the regret probability.
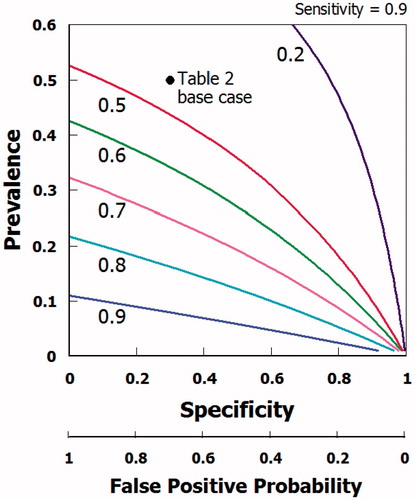
shows how the regret (so defined) varies with both the prevalence and specificity, when the sensitivity is held constant at 0.90. Looking at , you can see how the likelihood that a subject who tests positive actually is disease free changes as the prevalence changes. If the actual prevalence in the population were say 0.3, the regret would be approximately 0.7 and if the prevalence were as low as 0.08, the regret would be 0.9. This example illustrates the point that both technical parameters of the screening test and prevalence need to be considered.
Figure 3. Regret (1 – PPV) as a function of prevalence ∏ and specificity for example in assuming sensitivity held constant at 0.90.
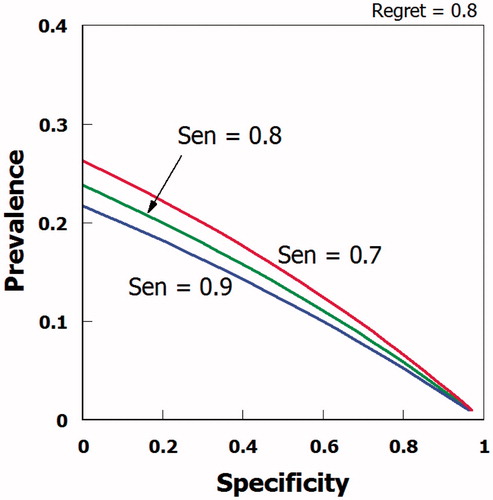
shows the locus of points that have a constant regret (equal to 0.8) as a function of specificity and prevalence for values of sensitivity ranging from 0.7 through 0.9; this test characteristic does not have much leverage in this example. Rather the prevalence and specificity are the key variables.
Figure 4. Combination of values of prevalence, specificity and sensitivity associated with a regret probability of 0.80.
Although the example given in is hypothetical, it is relevant to many actual tests. One is described below.
An example: LDCT scans for lung cancer
Low dose computed tomography (LDCT) has been proposed as a screening test for lung cancer. Several studies (Humphrey et al., Citation2013; Tiitola et al., Citation2002) have shown that this technique has a high sensitivity (as a percentage ranging from 80 to nearly 100%, Humphrey et al. [Citation2013]) at detecting nodules. The National Lung Cancer Screening Trial (NLST) Research Team (Citation2011) published a study reporting that the estimated reduction in mortality from use of LDCT screening was approximately 20% compared to alternative test strategies. Subjects included in the study population were between 55 and 74 years of age at the time of randomization, had a history of cigarette smoking of at least 30 pack-years, and, if former smokers, had quit within the previous 15 years. These criteria were used in an attempt to define a population with a relatively high prevalence and thus a high Positive Predictive Value:
Smokers (and those who quit quite recently) are included in the population under test because although lung cancer has multiple risk factors, it is estimated that 85–90% of all cases are attributed to smoking (Ruano-Ravina et al., Citation2013; Samet et al., Citation2009).
The age range of the cohort is relevant because older smokers presumably have experienced a greater dose of carcinogens and, as noted by the American Cancer Society:Footnote11
“Lung cancer mainly occurs in older people. About 2 out of 3 people diagnosed with lung cancer are 65 or older; fewer than 2% of all cases are found in people younger than 45. The average age at the time of diagnosis is about 70.”
Based on this (and other) research team’s findings, a nationwide screening program was proposed and has been endorsed by several organizations [e.g. the American Lung Association, see ALA, Citation2012, the US Preventive Services Task Force, Citation2013; American College of Chest Physicians (ACCP) and the American Society of Clinical Oncology (ASCO)].
However, this and earlier proposals for LDCT screening have also had numerous critics or skeptics (American Academy of Family Physicians (AAFP) Citation2014; Heffner & Silvestri, Citation2002; Ruano-Ravina et al., Citation2013; Silvestri, Citation2011; Vansteenkiste et al., Citation2012), some arguing that the estimated benefits of LDCT screening in reducing mortality are uncertain, lower than estimated or absent (Bach et al., Citation2007, Citation2012; Black, Citation2000; Oken et al., Citation2011; Pastorino et al., Citation2012; Saghir et al., Citation2012), others that the procedure is not cost-effective (Mahadevia et al., Citation2003), and yet others that the radiation risks might be excessive (Brenner, Citation2004).
One of the major concerns about the use of LDCT even among advocates (Marshall et al., Citation2013) is that LDCT detects a large number of benign but uncalcified pulmonary nodules – properly termed false positives – that are challenging to diagnose (MacRedmond et al., Citation2006; Nawa et al., Citation2002; Patz et al., Citation2004; Swensen et al., Citation2002, Citation2003, Citation2005) and which create other problems depending upon what is done as part of the follow-up to a positive test (Wiener et al., Citation2011). As noted by Diedrerich (Citation2008):
Many pulmonary nodules even in smokers are due to benign lesions such as granulomas and hamartomas.Footnote12
In short, although this test is highly sensitive, it has a low specificity. provides estimates of the false positive rate (benign nodules discovered by CT scans) as reported in several studies – even those that favor routine screening of this population subgroup. The calculated or reported false discovery rate shown in vary substantially among the studies;Footnote13 some of the differences can be explained by different criteria for defining a positive (e.g. size of the nodule that is classified as a positive) and whether or not multiple LDCTs were used (and the criteria for a positive on multiple tests) as part of the procedure. Despite this variability it is apparent that most reported estimates of false positive probabilities are quite high. The study by van Klavern et al. [Citation2009] reports a false positive probability very much lower than the other results depicted in . The actual test and decision criteria developed by these investigators differed from others. Specifically, they used a mathematical model to evaluate a non-calcified nodule according to its volume or volume-doubling time. Growth was defined as an increase in volume of at least 25% between two scans. The first-round screening test used by these investigators was considered to be negative if the volume of a nodule was less than 50 mm3, if it was 50 to 500 mm3 but had not grown by the time of the 3-month follow-up CT, or if, in the case of those that had grown, the volume-doubling time was 400 days or more. Another concern of critics of the NLST is that it might be difficult to generalize the results to community practices. Silvestri (Citation2011), for example, wrote:
Participants in the NLST were enrolled in tertiary care hospitals with expertise in all aspects of cancer care. [LDCT] studies were interpreted by dedicated chest radiologists with expertise in characterizing nodules and providing appropriate recommendations for follow up. As a result, few patients required invasive testing and radiographic follow-up was sufficient for many patients.
However, community radiologists without expertise in evaluating lung nodules may feel compelled to advise invasive testing for a screening-detected nodule. Of the 26 309 persons randomly assigned to chest CT screening in the NLST, 7191 (27%) had an abnormal finding. Most scans (96.4%) yielded false-positive results that were followed by serial radiography. Variation in how nodules are managed could lead to a substantial increase in transthoracic needle aspiration of lung nodules, unnecessary surgery, additional morbidity and even mortality for some persons who never had cancer to begin with.
Table 5. Reported false positive rates for CT scans for lung cancer.
From the data given in , it is clear that a conservative estimate of the false positive probability is at least 0.7, which means that the specificity of this test is at most 0.3 – the value assumed in the hypothetical example given in – and might be much lower. Thus, even for the potentially high risk group of elderly heavy cigarette smokers included in the screening trials, the Positive Predictive Value of the test is not likely to be high.
There is some discrepancy in reported PPVs for the NLST; according to Humphrey et al. (Citation2013) reported calculated positive predictive values (PPVs) for abnormal screening results ranging from 2.2% to 36.0%, while Ruano-Ravina et al. (Citation2013) report the PPV for the NLCT as only 3.6%. Ruano-Ravia et al. (Citation2013) have summarized the PPVs for 14 other LDCT investigations. Including their estimate for the NLCT, PPVs in these tests range from 0.028 to 0.115 with a median value of 0.053 and an arithmetic mean of 0.064, meaning that the probability that someone with a single positive test does not have lung cancer ranges from 0.885 to 0.972!
Kovalchik et al. (Citation2013) examined how the reduction in lung cancer mortality as reported by the NLST varied with the estimated risk based on a prediction model using age, body-mass index, family history of lung cancer, pack-years of smoking, years since smoking cessation and emphysema diagnosis. Based on model predictions, they divided the study population into quintiles based on a predicted 5-year risk of lung cancer. They analyzed the NLST data and found:
Screening with low-dose CT prevented the greatest number of deaths from lung cancer among participants who were at highest risk and prevented very few deaths among those at lowest risk. These findings provide empirical support for risk-based targeting of smokers for such screening.
This finding highlights the importance of identifying the target population that is likely to benefit most from the screening procedure.
Overdiagnosis is another factor to consider in assessing the merits of LDCT cancer screening. This is because although screening has a high sensitivity and potential to detect aggressive tumors, screening will also detect indolent tumors that otherwise might not cause immediate clinical symptoms. Patz et al. (Citation2014) used data from the NLST to estimate that more than 18% of all lung cancers detected by LDCT seemed to be more indolent, and the potential of overdiagnosis should be considered when describing the risks of LDCT for lung cancer.
Depending upon what is done in terms of follow up in the event of a positive screening test result, the impact of false positives could be substantial. Wiener et al. (Citation2011) determined population-based estimates of risks of complications following transthoracic needle biopsy of a pulmonary nodule. This group collected data on the percentage of biopsies complicated by hemorrhage, any pneumothorax and pneumothorax requiring chest tube, and computed adjusted odds ratios for these complications associated with various biopsy characteristics, calculated using multivariable population-averaged generalized estimating equations among a population of 15 865 adults (in California, Florida, Michigan and New York) who underwent transthoracic needle biopsy of a pulmonary nodule.
These investigators reported:
Although hemorrhage was rare, complicating 1.0% (95% CI 0.9–1.2%) of biopsies, 17.8% (95% CI 11.8–23.8%) of patients with hemorrhage required a blood transfusion. In contrast, the risk of any pneumothorax was 15.0% (95% CI 14.0–16.0%), and 6.6% (95% CI 6.0–7.2%) of all biopsies resulted in a pneumothorax requiring chest tube. Compared to patients without complications, those who experienced hemorrhage or pneumothorax requiring chest tube had longer lengths of stay (p < 0.001) and were more likely to develop respiratory failure requiring mechanical ventilation (p = 0.02). Patients aged 60–69 years (as opposed to younger or older patients), smokers and those with chronic obstructive pulmonary disease had higher risk of complications.
It is apparent form these results that the consequences of false positives are potentially material.
Based largely on concerns over the high false discovery rate, the Medicare Evidence Development and Coverage Advisory Committee (MEDCAC) in the United States recently recommended against covering the procedure for this patient group based on a lack of evidence to support the benefits of the screening test (http://www.aafp.org/news/health-of-the-public/20140521medcacctrec.html). MEDCAC makes recommendations, not decisions; as noted by the Centers for Medicare and Medicaid Services (http://www.cms.gov/Regulations-and-Guidance/Guidance/FACA/MEDCAC.html):
The MEDCAC reviews and evaluates medical literature, technology assessments, and examines data and information on the effectiveness and appropriateness of medical items and services that are covered under Medicare, or that may be eligible for coverage under Medicare. The MEDCAC judges the strength of the available evidence and makes recommendations to CMS based on that evidence.
The merits of this screening test are likely to be reviewed by other panels and the MEDCAC recommendation may ultimately be reversed – the Centers for Medicare & Medicaid Services (CMS) is expected to issue a proposed decision on the issue by November 2014, and a final decision in February 2015. The decision may be made on policy grounds but, from a scientific perspective, the ultimate outcome is likely to hinge on the judgment of the key parameters prevalence in the population, the high false discovery rate, and ultimately the low PPV (Nelson, Citation2009; Phend, Citation2014; US Preventive Services Task Force, Citation2013).
Another example of LDCT screening
As a related example, we were asked by ECFIA (a trade association of manufacturers of high temperature insulating wools) to comment on the suitability of routine use of LDCT scans in a medical surveillance program for workers of all ages (including both smokers and non-smokers) engaged in the manufacture of refractory ceramic fiber (RCF) and other high temperature insulating wools in France. The available results of a mortality study of these workers in two US plants does not indicate any increase over baseline cancer rates (LeMasters et al., Citation2003; Utell & Maxim, Citation2010), so the likely prevalence of lung cancer in this population is not likely to be high. This is because most of the employed population is substantially younger than those included in the NLST (indeed, the retirement age in France is 60–62 depending upon what age the employee entered the workforce) and not all employees are smokers, let alone heavy smokers.
According to data from SEER (see http://www.cancer.org/cancer/cancerbasics/lifetime-probability-of-developing-or-dying-from-cancer) the lifetime probability of contracting lung cancer among American males (including both smokers and non-smokers) is approximately 7.6%. Taking this as an estimate applicable to the French population prevalenceFootnote14 and using the sensitivity and specificity values from , the positive Predictive Value of CT lung cancer screening is approximately 0.1. (Obviously it would be much lower for young men and non-smokers and higher among those nearing retirement and heavy smokers.) This means that the a posteriori probability (regret) that a subject who tests positive in a single CT scan does not have lung cancer is approximately 0.9. Despite the high probability that a subject with a positive test does not have lung cancer, these subjects would be subject to whatever follow-up procedures might accompany such a test result. Members of this group would, at a minimum, suffer some mental distress and would be subject to follow-up CT scans and possibly invasive procedures. This screening test would clearly be inappropriate for this group. In this context it is noteworthy that the American Lung Association’s guidance document (ALA, Citation2012) that endorsed LDCT scans for older smokers also states:
Low-dose CT screening should NOT be recommended for everyone. [Emphasis in original.]
And, Bach et al. (Citation2012) also endorsed LDCT screens for older smokers, but also recommended:Footnote15
For individuals who have accumulated fewer than 30 pack-years of smoking or are either younger than 55 years or older than 74 years, or individuals who quit smoking more than 15 years ago, and for individuals with severe comorbidities that would preclude potentially curative treatment, limit life expectancy or both, we suggest that CT screenings should not be performed.
Thus, regardless of whether one believes that LDCT is an appropriate screening test for the population of older smokers, it is not justified for a population with much lower prevalence or those who are not likely to benefit from a correct diagnosis, evaluation and treatment.
Periodic screenings
Some screening tests are designed as “once-off” tests, but many are intended to be administered periodically, such as annually. For example, mammography and clinical breast examination have been proposed for screening for breast cancer. As Elmore et al. (Citation1998) wrote:
If a woman undergoes annual screening beginning at the age of 40, she will have had 60 opportunities for a false positive result by the age of 70, with 30 mammograms and 30 clinical breast examinations. The cumulative lifetime risk from her having a result from a screening test that requires further workup, even though no breast cancer is present, is not known…It is important to determine the cumulative risk of false positive tests, because women are advised to have breast-cancer screening every 1–2 years over several decades of their lifetimes, and false discovery rate can provoke anxiety, increase costs and cause morbidity.
Thus, in evaluating periodic screening, it is necessary to measure or calculate cumulative probabilities. Care must be taken because the results of multiple tests may not be independent events.
Choosing the right population subgroup
As the PPV of a screening test depends critically on the prevalence of the disease in the population it is important to identify criteria to define a population group or subgroup with a high disease incidence to begin with. As noted above, this is why the LDCT program was limited to older smokers. Lung cancer rates increase with age and the vast majority of lung cancers occur in smokers. This is potentially a reasonable population subgroup for screening.
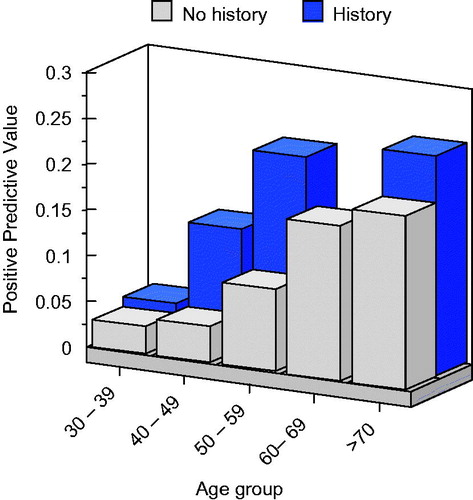
To illustrate the selection of a relevant population subgroup, we use an example from a study of breast cancer screening. Kerlikowske et al. (Citation1993) reported on a cross-sectional study of 31 814 women aged 30 years and older referred for mammography at the University of California. They segmented the population into women of various age groups with and without a family history of breast cancer. shows a bar chart of the estimated PPVs for these groups. These investigators found that five times as many cancers per 1000 first-screening mammographic examinations were diagnosed in women aged 50 years or older compared with women aged less than 50 years. The highest PPVs for mammography were older women with a family history of breast cancer. This finding guided their recommendation.
Figure 5. Positive predictive value from mammography for women in various age groups with and without a family history of cancer according to data provided in Kerlikowske et al. (Citation1993).
Possible criteria for defining a population subgroup include various demographic factors (age, gender, race and country), known risk factors (e.g. smoking), medical history and occupation. For screening to be highly effective, the prevalence in the population should be as high as is practicable. Harper et al. (Citation2000) provides additional comments on the importance of the study population.
ROC curves
It is noted above that there may be opportunities to design a screening test that has different combinations of sensitivity and specificity. If so, there are opportunities to design the test to possess characteristics that are superior in terms of the combination of possible consequences of false positives and false negatives. For example in the LDCT test, the threshold for size (mm) of the nodules or other characteristics (e.g. solid or semisolid nodules) might be varied (Lam et al., Citation2013), choices that would alter the sensitivity or specificity. Thompson et al. (Citation2005) and Zou et al. (Citation2007) offer other relevant examples of ROC curves.
shows a typical receiver operating characteristic (ROC)Footnote16 curve for a prostate specific antigen (PSA) test administered to men aged 70 or more.
Figure 6. Receiver operating characteristic curve of prostate specific antigen (PSA) test, based on data from Thompson et al. (Citation2005) among men aged 70 or more. Numbers shown are the specific cutoff on the PSA test result. The area under the curve (AUC) in this case is 0.678.
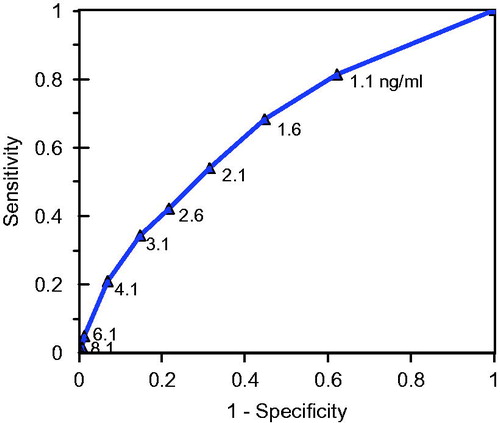
Each subject is tested and a specific PSA score determined. Subjects were also administered digital rectal examinations and biopsies – those with positive biopsies were used as the gold standard for assessment of disease status. A series of possible PSA cutoff scores (measured in nanograms per milliliter ng/ml) were considered for the screening test. Each cutoff score resulted in a partitioning of subjects into those who tested positive and those who tested negative. Knowing the actual disease status of the subjects enabled calculation of the sensitivity and specificity of the test. The ROC curve plots the calculated sensitivity against the false positive error (1 – Sp). Thus, each plotted point on the curve represents a different possible screening test with its own sensitivity and specificity. By considering the consequences of false positives and false negatives, it is possible to determine a cutoff value for the PSA test that is optimal in some sense. One statistic often used to characterize the ROC is the area under the curve (AUC). A perfectly discriminatory ROC would have an AUC = 1.0. The value for the PSA tests studied by Thompson et al. (Citation2005) was 0.678.
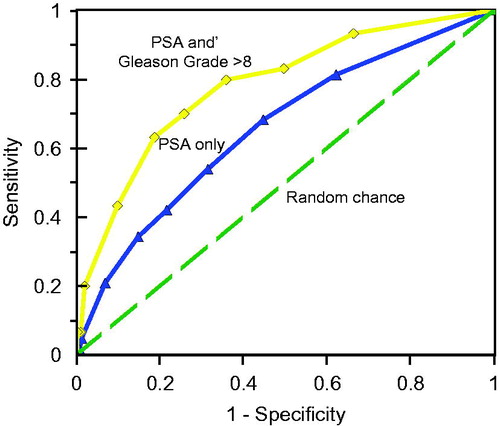
Thompson et al. (Citation2005) also considered using a so-called Gleason scoreFootnote17 with a cutoff of 8 or more in this population. shows the ROC curve (topmost curve) for this possible screening test. As can be seen, this series of tests dominates the tests based upon PSA score alone (the AUC in this case is 0.827). The dashed line in shows the ROC curve that would occur under chance alone.
Figure 7. Receiver operating characteristic curves of prostate specific antigen (PSA) test, based on data from Thompson et al. (Citation2005) among men aged 70 or more (AUC = 0.678). The top curve uses a combined PSA and Gleason Grade > 8 score (AUC = 0.827). The bottom curve is what would be expected by chance alone (AUC = 0.50).
Whether or not and for whom PSA screening is appropriate requires the same sort of analysis noted for the LDCT screening evaluation. The ROC curve is just one piece of the puzzle, but this type of analysis shows that it is possible to design a screening test with several alternative combinations of sensitivity and specificity.
A complete specification of a screening test includes the intrinsic test characteristics (sensitivity, selectivity and cost) and ROC curve (if multiple tests are possible), characteristics of the subject population (including opportunities for segmenting the population to identify high risk groups), the key derived quantities (PPV and NPV) and the consequences of false positives and negatives.
Concluding remarks
Screening tests have the potential to be a cost effective means for identifying subjects with early stage (and thus potentially more treatable) disease before symptoms develop and therefore, for saving lives. The ideal screening test would discriminate perfectly between those who have or do not have the disease and be inexpensive and not invasive. In practice, screening tests exhibit false positives and false negatives – errors with consequences that need to be carefully considered when evaluating the advantages and disadvantages of the test.
The predictive value of the test depends in part on the technical parameters of the test, including the sensitivity and specificity, but also on the prevalence of the disease in the population. For this reason, it is necessary to be able to define the population to be tested so that the prevalence is high. This is why mammography is appropriate only for older women and those with a family history of breast cancer and why lung CT scans are not appropriate for screening the general population.
With some screening tests it is possible to alter the test decision criterion to alter the balance between sensitivity and specificity in which case it may be possible to develop an optimal screening test.
Nonetheless, screening of asymptomatic populations is not always appropriate and could do more harm than good.Footnote18 summarizes the circumstances/conditions when screening might be either appropriate or contra-indicated.
Table 6. Circumstances/conditions when screening might be appropriate or contra-indicated.
Declaration of interest
This paper represents independent research and the authors are solely responsible for the content. Two of the authors (LDM and MJU) were asked by ECFIA to give an opinion on the use of CT scans for workers engaged in the production of high temperature insulating wools.
Supplemental Material
Download PDF (1.2 MB)Supplemental Material
Download PDF (1.2 MB)Supplemental Material
Download PDF (1.2 MB)Acknowledgements
We appreciate the constructive comments offered by two anonymous reviewers. Their comments have improved this manuscript.
Notes
1The basis for definition of the population might include age, gender, race, occupation, known medical condition or other risk factor (e.g. smoking).
2Diseases frequently begin before the onset of symptoms during a period sometimes referred to as the “detectable pre-clinical Phase” (DPCP).
3From this, it follows that the benefits of screening will be minimal if the disease has no cure (such as certain stage mesotheliomas) or if early detection does not materially improve chances for survival. In addition, depending upon the population under study, some diseases (sometimes termed pseudo diseases) are detected that do not affect mortality because the subject may die from another disease or event. This is termed overdiagnosis (refer Black, Citation2000 for more detail).
4Screening tests for donated blood using nucleic acid amplification are now so efficient that the risks of human immunodeficiency virus and hepatitis C virus transmission through blood transfusion is estimated to be approximately 1 in 2 million (Stramer, Citation2007).
5See Coste & Pouchot (Citation2003) for an extension in which the test results are permitted to fall into three zones, a positive, negative and in intermediate “grey zone.” In principle, many test outcomes as well as sequential tests can be handled mathematically. We focus on the 2 × 2 because it has proven useful and is easier to analyze.
6There are a few examples (e.g. certain tests for HIV) of screening tests with such high sensitivity and specificity that they are virtually a Gold Standard.
7The symbols T+ and T− denote the events that the test outcome is positive and negative, respectively. The symbols D+ and D− denote the events that the subject has or does not have the disease.
8Thus, Pr{D−} = 1−Π.
9It is beyond the scope of this article to consider optimal screening study designs, but it is appropriate to comment on one possible design, the case control design. As noted by Goetzinger & Odibo (Citation2011): “It is important to highlight that the case control study design cannot be used to determine predictive values because these values are influenced by disease prevalence. Because cases and controls are selected for inclusion, the prevalence of the disease is, therefore, “fixed” by the study design. Reproducing a generalizable spectrum of patients also becomes difficult with this type of study design”.
10The width of these confidence intervals is small due of the assumed size of the population under test. Many studies, however, are conducted on few individuals and it is important to understand the consequences in terms of the likely precision of the estimates.
12A hamartoma is a benign, focal malformation that resembles a neoplasm in the tissue of its origin.
13This is obviously not desirable, but also not entirely unexpected. For example, Elmore at al. (Citation2002) noted a variation in false positive rates ranging from 2.6% to 15.9% among radiologists interpreting mammograms.
14Male mortality rates from lung cancer are approximately the same in France and the United States (see http://www.oecd-ilibrary.org/docserver/download/8111101ec007.pdf?expires=1404337643&id=id&accname=guest&checksum=03F45C46CE1A31E393DD2EAFDF0157D3). Moreover, the 7.6% figure assumed for the prevalence is for an entire lifetime. The probability of contacting cancer through age 60 or 62 (when workers will retire) is certainly lower. Thus, this estimate probably overstates the actual prevalence for the worker cohort.
15ACCP and ASCO have made essentially the same recommendation, see http://www.cancer.net/research-and-advocacy/asco-care-and-treatment-recommendations-patients/lung-cancer-screening.
16ROC analysis emerged from the study of signal detection problems differentiating signals from noise. These were first used by scientists in Britain during World War II as the abilities of radar receiver operators were being assessed based on their ability to differentiate signal (e.g. enemy aircraft) from noise (non-relevant targets). The term was later borrowed by statisticians assessing screening tests.
17The Gleeson score is a grading system for prostate cancer based on microscopic appearance of the tumor.
18For a discussion of ethical issues relevant to screening programs (McQueen, Citation2002; WHO, Citation2003).
References
- Abbott RD, Petrovich H, Rodriguez BL, et al. (2000). Ankle/brachial blood pressure in men >70 years of age and the risk of coronary heart disease. Am J Cardiol 86:280–4
- Achkar JM, Lawn SD, Moosa M-YS, et al. (2011). Adjunctive tests for diagnosis of tuberculosis: Serology, ELISPOT for site-specific lymphocytes, urinary lipoarabinomannan, string test, and fine needle aspiration. J Infec Dis 204:S1130–41
- Álamo-Junquera D, Murat-Nascimento C, Maciá F, et al. (2011). Effect of false-positive results on reattendance at breast cancer screening programmes in Spain. Eur J Public Health 22:404–8
- Alberg AJ, Park JW, Hager BW, et al. (2004). The use of “overall accuracy” to evaluate the validity of screening or diagnostic tests. JGIM 19:460–5
- Allison JE, Tekawa IS, Ranson LJ, Adrain AL. (1996). A comparison of fecal occult-blood tests for colorectal-cancer screening. N Engl J Med 334:155–9
- Altman DG, Bland JM. (1994a). Diagnostic tests 1: sensitivity and specificity. Br Med J 308:1552
- Altman DG, Bland JM. (1994b). Diagnostic tests 2: predictive values. Br Med J 309:102
- Altman DG, Bland JM. (1994c). Diagnostic tests 3: receiver operating characteristic plots. Br Med J 309:188
- American Academy of Family Physicians. (2013). Evidence Lacking to Support or Oppose Low-dose CT Screening for Lung Cancer, Says AAFP. Available at http://www.aafp.org/news/health-of-the-public/20140113aafplungcarec.html [last accessed 30 June 2014]
- American Lung Association (ALA). (2012). Providing guidance on lung cancer screening to patients and physicians. April 23, 2012. Available online at: http://www.lung.org/lung-disease/lung-cancer/lung-cancer-screening-guidelines/lung-cancer-screening.pdf [last accessed 26 June 2014]. Washington, DC: American Lung Association, 35 pp
- Arbyn M, Sankaranarayanan R, Muwonge R, et al. (2008). Pooled analysis of the accuracy of five cervical cancer screening tests assessed in eleven studies in Africa and India. Int J Cancer 123:153–60
- Baade PD, Fritschi L, Eakin EG. (2006). Non-cancer mortaility among people diagnosed with cancer (Australia). Cancer Causes Control 17:287–97
- Bach PB, Jett JR, Pastorino U, et al. (2007). Computed tomography screening and lung cancer outcomes. JAMA 297:953–61
- Bach PB, Mirkin JN, Oliver TK, et al. (2012). Benefits and harms of CT screening for lung cancer: a systematic review. JAMA 307:2418–29
- Bauman A. (1990). The epidemiology of clinical tests. Aust Prescr 13:62–4
- Black WC. (2000). Overdiagnosis: an under recognized cause of confusion and harm in cancer screening. J Nat Cancer Inst 92:1280–2
- Boppana SB, Ross SA, Shimamura M, et al. (2011). Saliva polymerase-chain-reaction assay for cytomegalovirus screening in newborns. New Engl J Med 364:2111–18
- Brenner DJ. (2004). Radiation risks potentially associated with low-dose CT screening of adult smokers for lung cancer. RSNA 231:440–5
- Casscells W, Schoenberger A, Graboys TB. (1978). Interpretation by physicians of clinical laboratory results. N Engl J Med 299:999–1001
- Catalona WJ, Smith DD, Ratliff TL, et al. (1991). Measurement of prostate-specific antigen in serum as a screening test for prostate cancer. N Engl J Med 324:1156–61
- Centers for Disease Control and Prevention (CDC). (2013). Tuberculosis (TB): Testing and diagnosis. Centers for Disease Control and Prevention, Atlanta, GA, USA, 4 pp. Available online at: http://www.cdc.gov/TB/TOPIC/testing/default.htm [last accessed 5 August 2014]
- Coste J, Pouchot J. (2003). A grey zone for quantitative diagnostic and screening tests. Int. J. Epidemiol 32:304–13
- Croswell JM, Baker SG, Marcus PW, et al. (2010). Cumulative incidence of false-positive test results in lung cancer screening: a randomized trial. Ann Intern Med 152:505–11
- Croswell JM, Kramer BS, Kreimer AR, et al. (2009). Cumulative incidence of false-positive results in repeated, multimodal cancer screening. Ann Fam Med 7:212–22
- Cuzick J, Cadman L, Mesher D, et al. (2013). Comparing the performance of six human papillomavirus tests in a screening population. Br J Cancer 108:908–13
- Deeks JJ, Altman DG. (2004). Diagnostic tests 4: likelihood ratios. Br Med J 329:168–9
- Deeks JJ. (2001). Systematic reviews of evaluations of diagnostic and screening tests. Br Med J 323:157–62
- Dendukuri N. (2011). Evaluating diagnostic tests in the absence of a gold standard. Powerpoint presentation for Advanced TB Diagnostics Course, Montreal, July 2011. 54 slides. Available at: http://www.teachepi.org/documents/courses/tbdiagrx/day2/Dendukuri%20Diagnostic%20Tests%20in%20the%20Absence%20of%20a%20Gold%20Standard.pdf [last accessed 4 August 2014]
- Diedrerich S, Wormanns D, Semik M, et al. (2002). Screening for early lung cancer with low-dose spiral CT: prevalence in 817 asymptomatic smokers. RSNA 222:773–81
- Diedrerich S. (2008). CT screening for lung cancer. Cancer Imaging 8:S24–6
- Donovan L, Hartling L, Muise M, et al. (2013). Screening tests for gestational diabetes: a systematic review for the U.S. Preventative Services Task Force. Ann Intern Med 159:115–22
- Doobay A, Anand SS. (2005). Sensitivity and Specificity of the ankle-brachial index to predict future cardiovascular outcomes: a systematic review. Arterioscler Thromb Vasc Biol 25:1463–9
- Eddy DM. (1982). Chapter 18. Probabilistic reasoning in clinical medicine: problems and opportunities. In: Kahneman D, Slovic P, Tversky A, eds. Judgment under Uncertainty: Heuristics and Biases. Cambridge: Cambridge University Press, 249–67
- Elmore JG, Barton MB, Moceri VM, et al. (1998). Ten-year risk of false positive screening mammograms and clinical breast examinations. N Engl J Med 338:1089–96
- Elmore JG, Miglioretti DL, Reisch LM, et al. (2002). Screening mammograms by community radiologists: variability in false-positive rates. J Natl Cancer Inst 94:1373–80
- Ewer AK, Middleton LJ, Furmston AT, et al. (2011). Pulse oximetry screening for congenital heart defects in newborn infants (PulseOx): a test accuracy study. Lancet 378:785–94
- Ferreira M, Davies SL, Butler M, et al. (1992). Endomysial antibody: is it the best screening test for celiac disease? Gut 33:1633–7
- Firnhaber C, Mayisela N, Mao L, et al. (2013). Validation of cervical cancer screening methods in HIV positive women from Johannesburg, South Africa. PLoS One 8:e53494
- Friedewald SM, Rafferty EA, Rose SL, et al. (2014). Breast cancer screening using tomosynthesis in combination with digital mammography. JAMA 311:2499–507
- Gart JJ, Buck AA. (1966). Comparison of a screening test and a reference test in epidemiologic studies. II. A probabilistic model for the comparison of diagnostic tests. Am J Epidemiol 83:593–602
- Gastwirth JL. (1987). The statistical precision of medical screening procedures: application to polygraph and AIDS antibodies test data. Stat Sci 2:213–38
- Goetzinger KR. Odibo AO. (2011). Statistical analysis and interpretation of prenatal diagnostic imaging studies, Part 1: evaluating the efficiency of screening and diagnostic tests. J Ultrasound Med 30:1121–7
- Gohagan J, Marcus P, Fagerstrom R, et al. (2004). Baseline findings of a randomized feasibility trial of lung cancer screening with spiral CT scan vs chest radiograph; The lung screening study of the national cancer institute. Chest 126:114–21
- Gotzak-Uzan L, Jiminez W, Nofech-Mozes S, et al. (2010). Sentinel lymph node biopsy vs. pelvic lymphadenectomy in early stage cervical cancer: is it time to change the gold standard? Gynecol Oncol 116:28–32
- Greenhalgh T. (1997). Papers that report diagnostic or screening tests. BMJ 315:540–3
- Grim CE, Luft FC, Weinberger MH, Grim CM. (1979). Sensitivity and specificity of screening tests for renal vascular hypertension. Ann Intern Med 91:617–22
- Grimes DA, Schulz KF. (2002). Uses and abuses of screening tests. Lancet 359:881–4
- Harper R, Henson D, Reeves BC. (2000). Appraising evaluations of screening/diagnostic tests: the importance of the study populations. Br J Opthalmol 84:1198–202
- Hawkins DM, Garrett JA, Stephenson B. (2001). Some issues in resolution of diagnostic tests using and imperfect gold standard. Technical Report 628, School of Statistics, University of Minnesota. Stat Med 20:1987–2001
- Heffner JE, Silvestri G. (2002). CR screening for lung cancer: is smaller better? Am J Respir Crit Care Med 165:433–7
- Henschke CI, Yankelevitz DF, Mirtcheva R, et al. (2002). CT screening for lung cancer: frequency and significance of part-solid and nonsolid nodules. AJR 178:1053–7
- Henschke CI, Yip R, Yankelevitz DF, Smith JP. (2013). Definition of a positive test result in computed tomography screening for lung cancer. Ann Int Med 158:246–52
- Herman C. (2006). What makes a screening exam “good”? Ethics J Am Med Assoc 8:34–7
- Humphrey LL, Deffebach M, Pappas M, et al. (2013). Screening for lung cancer with low-dose computed tomography: a systematic review to update the U.S. Preventative Services Task Force recommendation. Ann Int Med 159:411–20
- Jafari Y, Peeling RW, Shivkumar S, et al. (2013). Are Treponema pallidum specific rapid and point-of-care tests for Syphilis accurate enough for screening in resource limited settings? Evidence from a meta-analysis. PLoS One 8:e54695
- Johnson WO, Gastwirth JL, Pearson LM. (2001). Screening without a “gold standard”: the Hui-Walter paradigm revisited. Am J Epidemiol 153:921–4
- Joseph L, Gyorkos TW, Coupal L. (1995). Bayesian estimation of disease prevalence and the parameters of diagnostic tests in the absence of a gold standard. Am J Epidemiol 141:263–72
- Karaağaoğlu E. (1999). Estimation of the prevalence of a disease from screening tests. Trends J Med Sci 29:429–30
- Kaufman PA, Bloo KJ, Burris H, et al. (2014). Assessing the discordance rate between local and central HER2 testing in women with locally determined HER2-negative breast cancer. Cancer 120:2657–64
- Kerlikowske K, Grady D, Barclay J, et al. (1993). Positive predictive value of screening mammography by age and family history of breast cancer. JAMA 270:2444–50
- Kloten V, Becker B, Winner K, et al. (2013). Promoter hypermethylation of the tumor-suppressor genes ITIH5, DKK3, and RASSF1A as novel biomarkers for blood-based breast cancer screening. Breast Cancer Res 15:1–11
- Kovalchik SA, Tammemagi M, Berg CD, et al. (2013). Targeting of low-dose CT screening according to the risk of lung-cancer death. N Engl J Med 369:245–54
- Kulasingam SL, Hughes JP, Kiviat NB, et al. (2002). Evaluation of human papillomavirus testing in primary screening for cervical abnormalities: comparison of sensitivity, specificity, and frequency of referral. JAMA 288:1749–57
- Lalkhen AG, McCluskey A. (2008). Clinical tests: sensitivity and specificity. Cont Ed Anesth Crit Care Pain 9:221–3
- Lam S, McWilliams A, Mayo J, Tammemagi M. (2013). Computed tomography screening for lung cancer: what is a positive screen? Ann Int Med 158:289–90
- Legro RS, Finegood D, Dunaif A. (1998). A fasting glucose to insulin ratio is a useful measure of insulin sensitivity in women with polycystic ovary syndrome. J Clin Endocrinol Metabol 83:2694–8
- LeMasters GK, Lockey JE, Yiin JH, et al. (2003). Mortality of workers occupationally exposed to refractory ceramic fibers. J Occup Environ Med 45:440–50
- Levy PS, Kass EH. (1970). A three-population model for sequential screening for bacteriuria. Am J Epidemiol 91:148–54
- Lewis FI, Torgerson PR. (2012). A tutorial in estimating the prevalence of disease in humans and animals in the absence of a gold standard diagnostic. Emerg Themes Epidemiol 9:1–8
- Li F, Sone S, Abe H, et al. (2004). Malignant versus benign nodules at CT screening for lung cancer: comparison of thin-section CT findings. Radiology 233:793–8
- Lu D, Fall K, Sparen P, et al. (2013). Suicide and suicide attempt after a cancer diagnosis among young individuals. Ann Oncol 24:3112–17
- MacRedmond R, McVey G, Lee M, et al. (2006). Screening for lung cancer using low dose CT scanning: results of 2 year follow up. Thorax 61:54–6
- Mahadevia PJ, Fleisher LA, Frick KD, et al. (2003). Lung cancer screening with helical computed tomography in older adult smokers: a decision and cost-effectiveness analysis. JAMA 289:313–22
- Maisel AS, Koon J, Krishnaswamy P, et al. (2001). Utility of B-natriuretic peptide as a rapid, point-of-care test for screening patients undergoing echocardiography to determine left ventricular dysfunction. Am Heart J 141:367–74
- Manos D. (2013). CT screening for lung cancer: controversy and misconceptions. Oncology Exch 12:10–12
- Manrai AK, Bhatia G, Strymish J, et al. (2014). Medicine’s uncomfortable relationship with math: calculating positive predictive value. JAMA Intern Med 174:991–3
- Marshall HM, Bowman RC, Yang IA, et al. (2013). Screening for lung cancer with low-dose computed tomography: a review of current status. J Thor Dis 5:S524–39
- Mayrand M-H, Duarte-Franco E, Rodriques I, et al. (2007). Human Papillomavirus DNA versus Papanicolaou screening tests for cervical cancer. N Engl Med J 357:1579–88
- McQueen MJ. (2002). Some ethical and design challenges of screening programs and screening tests. Clin Chim Acta 315:41–8
- McWilliams A, Mayo J, MacDonald S, et al. (2003). Lung cancer screening: a different paradigm. Am J Respir Crit Care Med 168:1167–73
- Menon U, Gentry-Maharaj A, Hallett R, et al. (2009). Sensitivity and specificity of multimodal and ultrasound screening for ovarian cancer, and stage distribution of detected cancers: results of the prevalence screen of the UK Collaborative Trial of Ovarian Cancer Screening (UKCTOCS). Lancet 10:327–40
- Mertens L, Friedberg MK. (2009). The gold standard for noninvasive imaging in congenital heart disease: echocardiography. Curr Opin Cardiol 24:119–24
- National Lung Screening Trial Research Team. (2011). Reduced lung-cancer mortality with low-dose computed tomographic screening. N Engl J Med 365:395–409
- Nawa T, Nakagawa T, Kusano S, et al. (2002). Lung cancer screening using low-dose spiral CT: results of baseline and 1-Year follow-up studies. Chest 122:15–20
- Nelson R. (2009). ASCO 2009: low-dose CT screening for lung cancer produces high rate of false positives. Available at: http://www.medscape.com/viewarticle/703909 [last accessed 9 June 2014]
- Newcombe RG. (1998). Two-sided confidence intervals for the single proportion: comparison of seven methods. Stat Med 17:857–72
- Newman AB, Shemanski L, Manolio TA, et al. (1999). Ankle-arm index as a predictor of cardiovascular disease and mortality in the Cardiovascular Health Study. Arterioscler Thromb Vasc Biol 19:538–45
- Ng AK, Garber JE, Diller LR, et al. (2013). Prospective study of the efficacy of breast magnetic resonance imaging and mammographic screening in survivors of Hodgkin Lymphoma. J Clin Oncol 31:2282–8
- Novello S, Fava C, Borasio P, et al. (2005). Three-year findings of an early lung cancer detection feasibility study with low-dose spiral computed tomography in heavy smokers. Ann Oncol 16:1662–6
- Oken MM, Hocking WC, Kvale PA, et al. (2011). Screening by chest radiograph and lung cancer mortality: the prostate, lung, colorectal, and ovarian (PLCO) randomized trial. JAMA 306:1865–73
- Pastorino U, Bellomi M, Landoni C, et al. (2003). Early lung-cancer detection with spiral CT and positron emission tomography in heavy smokers: 2-year results. Lancet 362:593–7
- Pastorino U, Rossi M, Rosato V, et al. (2012). Annual or biennial CT screening versus observation in heavy smokers: 5-year results of the MILD trial. Eur J Cancer Prev 21:308–15
- Patz EF, Pinsky P, Gatsonis C, et al. (2014). Overdiagnosis in low-dose computed tomography screening for lung cancer. JAMA Intern Med 174:269–74
- Patz EF, Swenson SJ, Herndon JE, II. (2004). Estimate of lung cancer mortality from low-dose spiral computed tomography screening trials: implications for current mass screening recommendations. J Clin Oncol 22:2202–6
- Pedersen JH, Ashraf H, Dirksen A, et al. (2009). The Danish randomized lung cancer CT screening trial – overall design and results of the prevalence round. J Thorac Oncol 4:609–14
- Pepe MS. (2003). The statistical evaluation of medical tests for classification and prediction. Oxford: Oxford University Press
- Perkins BA, Olaleye D, Zinman B, Bril V. (2001). Simple screening tests for peripheral neuropathy in the diabetes clinic. Diabetes Care 24:250–6
- Petticrew MP, Sowden AJ, Lister-Sharp D, Wright K. (2000). False-negative results in screening programmes: systematic review of impact and implications. Health Technol Assess 4:1–20
- Petticrew MP, Sowden AJ, Lister-Sharp D, Wright K. (2001). False-negative results in screening programmes: medical, psychological, and other implications. Int J Tech Technol Assess Health Care 17:164–70
- Phend C. (2014). Medicare advisers say no to lung cancer screening. Available at: http://www.medpagetoday.com/Pulmonology/LungCancer/45512 [last accessed 9 June 2014]
- Pickering TG, Hall JE, Appel LJ, et al. (2005). Recommendations for blood pressure measurements in humans and experimental animals: Part 1: blood pressure measurement in humans: a statement for professionals from the Subcommittee of Professional and Public Education of the American Heart Association Council on High Blood Pressure Research. Hypertension 45:142–61
- Rafferty EA, Park JM, Philpotts LE, et al. (2013). Assessing radiologist performance using combined digital mammography and breast tomosynthesis compared with digital mammography alone: results of a multicenter multireader trial. Radiology 266:104–13
- Rogan WJ, Gladen B. (1978). Estimating prevalence from the results of a screening test. Am J Epidemiol 107:71–6
- Ruano-Ravina A, Ríos MP, Fernández-Villar A. (2013). Cribado de cáncer de pulmón con tomografía computarizada de baja dosis después del National Lung Screening Trial. El debate continúa abierto. Arch Bronconeumol 49:158–65
- Rutjes AWS, Reitsma JB, Coomarasamy A, et al. (2007). Evaluation of diagnostic tests when there is no gold standard. A review of methods. Health Technol Assess 11:1–72
- Sabroe RA, Grattan CE, Francis DM, et al. (1999). The autologous serum skin test: a screening test for autoantibodies in chronic idiopathic utricaria. Br J Dermatol 140:446–52
- Saghir Z, Dirksen A, Ashraf H, et al. (2012). CT screening for lung cancer brings forward early disease. The randomized Danish Lung Cancer Screening Trial: status after five annual screening rounds with low-dose CT. Thorax 67:296–301
- Salami SS, Schmidt F, Laxman B, et al. (2013). Combining urinary detection of TMPRSS2:ERG and PCA3 with serum PSA to predict diagnosis of prostate cancer. Urol Oncol 31:566–71
- Samet JM, Avila-Tang E, Boffetta P, et al. (2009). Lung cancer in never smokers: clinical epidemiology and environmental risk factors. Clin Cancer Res 15:5626–45
- Schiffman M, Herrero R, Hildesheim A, et al. (2000). HPV DNA testing in cervical cancer screening: results from women in a high-risk province of Costa Rica. JAMA 283:87–93
- Schroeder S, Enderle MD, Ossen R, et al. (1999). Noninvasive determination of endothelium-mediated vasodilation as a screening test for coronary artery disease: pilot study to assess the predictive value in comparison with angina pectoris, exercise electrocardiography, and myocardial perfusion imaging. Am Heart J 138:731–9
- Shumway-Cook A, Brauer S, Woollacott M. (2000). Predicting the probability for falls in community-dwelling older adults using the timed up & go test. Phys Ther 80:896–903
- Silvestri GA. (2011). Screening for lung cancer: it works, but does it really work? Ann Intern Med 155:537–9
- Sone S, Li F, Yang Z-G, et al. (2001). Results of three-year mass screening programme for lung cancer using mobile low-dose spiral computed tomography scanner. Br J Cancer 84:25–32
- Stoll C, Kapfhammer HP, Rothenhauser HB, et al. (1999). Sensitivity and specificity of a screening test to document traumatic experiences and to diagnose post-traumatic stress disorder in ARDS patients after intensive care treatment. Intensive Care Med 25:697–704
- Stramer SL. (2007). Current risks of transfusion-transmitted agents: a review. Arch Pathol Lab Med 131:702–7
- Swensen SJ, Jett JR, Hartman TE, et al. (2003). Lung cancer screening with CT: Mayo Clinic experience. RSNA 226:756–61
- Swensen SJ, Jett JR, Hartman TE, et al. (2005). CT screening for lung cancer: five-year prospective experience. RSNA 235:259–65
- Swensen SJ, Jett JR, Sloan JA, et al. (2002). Screening for lung cancer with low-dose spiral computed tomography. Am J Respir Crit Care Med 165:508–13
- Teertstra HJ, Loo CE, van den Bosch MAAJ, et al. (2009). Breast tomosynthesis in clinical practice: initial results. Eur Radiol 20:16–24
- Thejls H, Gnarpe J, Gnarpe H, et al. (1994). Expanded gold standard in the diagnosis of Chlamydia trachomatis in a low prevalence population: diagnostic efficacy of tissue culture, direct immunofluorescence, enzyme immunoassay, PCR and serology. Genitourin Med 70:300–3
- Thompson IA, Ankerst DP, Chi C, et al. (2005). Operating characteristics of prostate-specific antigen in men with an initial PSA level of 3.0 ng/mL or lower. JAMA 294:66–70
- Tiitola M, Kivisaari L, Huuskonen MS, et al. (2002). Computed tomography screening for lung cancer in asbestos-exposed workers. Lung Cancer 35:17–22
- Toyoda Y, Nakayama T, Kusunoki Y, et al. (2008). Sensitivity and specificity of lung cancer screening using chest low-dose computed tomography. Br J Cancer 98:1602–7
- Troy LM, Michels KB, Hunter DJ, et al. (1996). Self-reported birthweight and history of having been breastfed among younger women: an assessment of validity. Int J Epidemiol 25:122–7
- Tsai AW, Folsom AR, Rosamon W, Jones DW. (2001). Ankle-brachial index and 7-year ischemic stroke incidence. The ARIC Study. Stroke 32:1721–4
- US Preventive Services Task Force. (2013). Screening for Lung Cancer; U.S. Preventive Services Task Force Recommendation Statement. Available at http://www.uspreventiveservicestaskforce.org/uspstf13/lungcan/lungcanfinalrs.htm [last accessed 30 June 2014]
- Utell MJ, Maxim LD. (2010). Refractory ceramic fiber (RCF) toxicity and epidemiology: a review. Inhal Toxicol 22:500–21
- van Klavern RJ, Oudkerk M, Prokop M, et al.(2009). Management of lung nodules detected by volume CT scanning. N Engl J Med 361:2221–9
- van Nagell JR, DePriest PD, Ueland FR, et al. (2007). Ovarian cancer screening with annual transvaginal sonography: findings of 25,000 women screened. Cancer 109:1887–96
- van Smeden M, Naaktegeboren CA, Reitsma JB, et al. (2014). Latent class models in diagnostic studies when there is no reference standard – a systematic review. Am J Epidemiol 179:423–31
- Vansteenkiste J, Dooms C, Mascaux C, Nackaerts K. (2012). Screening and early detection of lung cancer. Ann Oncol 23:320–7
- Versi E. (1992). “Gold standard” is an appropriate term. BMJ 305:187
- Vogelsang H, Wyatt GD, Lochs WJ, et al. (1995). Screening for celiac disease: a prospective study on the value of noninvasive tests. Am J Gastroenterol 90:394–8
- Walter SD, Irwig LM. (1988). Estimation of test error rates, disease prevalence and relative risk from misclassified data: a review. J Clin Epidemiol 43:923–37
- Watson EJ, Templeton A, Russell I, et al. (2002). The accuracy and efficacy of screening tests for chlamydia trachmatis: a systematic review. J Med Microbiol 51:1021–31
- Wegwarth O, Schwartz LM, Woloshin S, et al. (2012). Do physicians understand cancer screening statistics? A national survey of primary care physicians in the United States. Ann Intern Med 156:340–9
- Weiss SH, Goedert JJ, Samgadharanm MG, et al. (1985). Screening test for HTLV-III (AIDS Agent) Antibodies, specificity, sensitivity, and applications. JAMA 253:221–5
- Whiting P, Rutjes AWS, Reitsma JB, et al. (2004). Chapter 2. A systematic review of sources of variation and bias in studies of diagnostic accuracy. Ann Int Med 140:189–202
- Whitlock EP, Lin JS, Liles E, et al. (2008). Screening for colorectal cancer: a targeted, updated systematic review for the U.S. Preventative Services Task Force. Ann Int Med 149:638–58
- Wiener RS, Schwartz LM, Woloshin S, Welch HG. (2011). Population-based risk for complications after transthoracic needle lung biopsy of a pulmonary nodule: an analysis of discharge records. Ann Intern Med 155:137–44
- Wilson JMG, Jungner G. (1968). Principles and practice of screening for disease. Geneva: WHO. Available at: http://whqlibdoc.who.int/php/WHO_PHP_34.pdf [last accessed 5 August 2014]
- World Health Organization (WHO). (2003). Review of ethical issues in medical genetics. Prepared for WHO by Wertz DC, Fletcher JC, and Berg K. WHO/HGN/ETH/00.4. 48 pp. Available online at: http://www.who.int/genomics/publications/en/ethical_issuesin_medgenetics%20report.pdf [last accessed 5 August 2014]
- Zou KH, O’Malley J, Mauri L. (2007). Receiver-operating characteristic analysis for evaluating diagnostic tests and predictive models. Circulation 115:654–7
Appendix Table
Table A1. Table of test specificity and sensitivity results in the literature.