
Abstract
Despite the lack of evidence, many reports exist which have implied that smokers inhale low-yield cigarette smoke more deeply than that of high-yield cigarettes. The objective of this study was to investigate the effect of short-term switching between smoker’s own brand and test cigarettes with different smoke yields on puffing topography, respiratory parameters and biomarkers of exposure. Participants were randomly assigned to smoke either a Test Cigarette-High Tar (TCH), for two days, and then switched to a Test Cigarette-Low Tar (TCL), for two days or the reverse order (n = 10 each sequence). Puffing topography (CReSS microdevice), respiratory parameters (inductive plethysmography) and biomarkers of exposure (BOE, urinary nicotine equivalents – NE and blood carboxyhemoglobin – COHb) were measured at baseline and on days 2 and 4. The average puffs per cigarette, puff volume and puff durations were statistically significantly lower, and inter-puff interval was significantly longer for the TCH compared to the TCL groups. Respiratory parameters were not statistically significantly different between the TCH and TCL groups. Post-baseline NE and COHb were statistically significantly lower in the TCL compared to the TCH groups. Under the conditions of this study, we found no indication of changes in respiratory parameters, particularly inhalation time and volume, between study participants smoking lower versus higher yield cigarettes. Likewise, the BOE provides no indication of deeper inhalation when smoking low- versus high-yield cigarettes. These findings are consistent with the published literature indicating smoking low-yield cigarettes does not increase the depth of inhalation.
Introduction
Cigarette smoke intake is a process that begins with two distinct steps. In the first step, the smoker puffs the cigarette, drawing smoke into the mouth. In the second step, the smoker inhales the smoke (Baker & Dixon, Citation2006; Herning et al., Citation1983; Patil et al., Citation2013; USDHHS, Citation1988).
Both puffing intensity and depth of inhalation have been reported to influence exposure to some cigarette smoke constituents (Feng et al., Citation2007; Sutton et al., Citation1982; Zacny & Stitzer, Citation1988). Moreover, studies have reported that changes in cigarette design can influence puffing intensity. In particular, when switching from higher yield to lower yield cigarettes, people tend to take larger puffs and/or puff more frequently (Bridges et al., Citation1990; Djordjevic et al., Citation2000; Herning et al., Citation1981; Tobin & Sackner, Citation1982).
It has been frequently suggested that smokers of low-yield cigarettes inhale the smoke more deeply (Burns et al., Citation2011; IOM, Citation2001; Benowitz, Citation2001; Thun et al., Citation2013; USDHHS, Citation2010, Citation2014). We examined these studies and found that, in most cases, no citations or data were provided in support of the claim. In many cases, where a reference is cited, it simply refers to an article stating the claim but does not itself present empirical evidence demonstrating smokers increase their depth of inhalation when smoking low-yield cigarettes. In none of the cases we observed a study citing either in the reports noted above or in the secondary citations which demonstrate that smokers increase their depth of inhalation when smoking reduced yield cigarettes or cigarettes with ventilated filters. Despite the lack of direct experimental evidence, this statement is repeated frequently enough that it is often accepted as a fact. On the contrary, there are several publications, Guillerm & Radziszewski (Citation1978), Tobin & Sackner (Citation1982), McBride et al. (Citation1984), Zacny et al. (Citation1986), Zacny & Stitzer (Citation1988), Nil et al. (Citation1986) and St. Charles (Citation2009), which consistently demonstrate that smokers do not increase their inhalation volume when switching from a high-yield to a lower-yield cigarette.
No reports exist where puffing topography, respiratory parameters and biomarkers of exposure have been measured in the same individual. In order to systematically address this question, we have designed a randomized, controlled, double-blinded design study to address the question regarding changes in smoking behavior when switching from a high-yield to a low-yield cigarette. The purpose of this study was to investigate the effect of short-term switching between smoker’s own cigarette brand and test cigarettes with different smoke yields on puffing topography, respiratory parameters and biomarkers of exposure.
Materials and methods
Study participants
Eligible participants were male adult smokers between the ages of 25 and 50 years who smoked cigarettes with machine-measured tar yield of ≥13 mg, Cambridge Filter Pad method (CFP) formerly known as the Federal Trade Commission (FTC) method, with a daily cigarette consumption of 10 to 30 cigarettes/day. All subjects had normal ECG and pulmonary function test results and had no acute illness at the time of the study.
The study was conducted by MDS Pharma Services Inc. (Lincoln, NE – now operating as Celerion Inc.). The participants were recruited from the Lincoln and surrounding areas. There were 26 adult male subjects enrolled in the study, 20 were randomized into the two sequence groups, and 19 subjects completed the study. The protocol and informed consent form were reviewed and approved by the MDS Pharma Services Institutional Review Board, in compliance with Section 56 of Title 21 of the Code of Federal Regulations (CFR) and International Conference on Harmonization (ICH) guidelines. All volunteers provided written informed consent before enrolling in the study, were paid for participating, and were free to discontinue the study at any time for any reason. This research was carried out in accordance with the clinical research principles enunciated in the latest version of the Declaration of Helsinki (revised version of Edinburgh, Scotland, 2000) and in a manner consistent with the FDA Good Clinical Practice Regulations (CFR 21 parts 50, 56, and 312 Subpart D) and the ICH Guidelines for Good Clinical Practice.
Study design and procedures
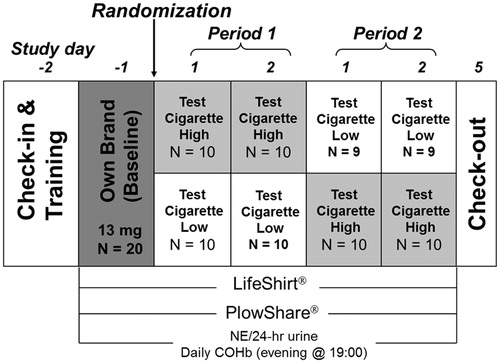
The study design is illustrated in . This was a randomized, controlled, double-blind, 2-way crossover study with three consecutive recording periods: Baseline (one day), Period 1 (2 days) and Period 2 (2 days). Subjects were allowed to stay in the clinic during the entire study period.
Figure 1. Schematic representation of randomized open-label study design.
Study cigarettes
At the baseline period, participants smoked their own brand of US domestic cigarettes [(≥13 mg tar (CFP)]. During Periods 1 and 2, participants smoked either Test Cigarette High-tar [TCH: ∼15 mg tar (CFP)] or Test Cigarette Low-tar [TCL: ∼7 mg tar (CFP)] according to the randomization schedule. Both test cigarettes were typical US blended cigarettes manufactured by Philip Morris, USA.
Study procedures
Prior to baseline measurements, all participants were trained on the portable puffing topography device and the LifeShirt™ garment (VivoMetrics Inc., Ventura, CA), while smoking one cigarette. Beginning on the morning of the baseline measurement day, subjects were permitted to smoke ad libitum but not to exceed by more than 20% their usual daily cigarette consumption on each of the study days, as reported by the subjects at screening. Smoking was not allowed between 23:00 and 8:00. The puffing topography data were recorded each day, while the participants smoked the assigned cigarettes at 8:00, 10:00, 13:00 and 15:00. The respiratory parameters were recorded at the same time as the puffing topography with additional smoking episodes recorded, while the participants smoked at 8:00, 9:00, 10:00, 11:30, 13:00 and 15:00. On the morning of day 1, Period 1, participants were randomized into two sequence groups: (1) “H-L” group, in which participants smoked the TCH in Period 1 followed by the TCL in Period 2; (2) “L-H” group, in which participants smoked the TCL in Period 1 and TCH in Period 2. The number of cigarettes each participant smoked on each day was recorded by collecting the cigarette butts. During the study periods, the subjects smoked ad libitum and were allowed to quit smoking at any time.
Puffing parameters
Subjects’ puffing topography, including number of puffs, puff volume, puff duration and inter-puff interval was recorded by CReSSMicro™ portable smoking topography device (Version 2.1.4b1, Plowshare Technologies, Inc., Baltimore, MD).
Respiratory parameters
The LifeShirt™ (VivoMetrics Inc., Ventura, CA), a “garment” type, multi-function ambulatory device that contains electrodes and transducers for measurement of respiratory activities along with various other physiological signals, was used to record respiratory data. The inhalation, exhalation time and volume, and breath-holding time were generated by VivoLogic software. Prior to each study session, the device was calibrated in two steps as recommended by the manufacturer (Konno & Mead, Citation1967; Sackner et al., Citation1989).
Raw waveform signals from the VivoMetrics® LifeShirt™ (Vivo Logic Software: Vivo Metrics Inc., Ventura, CA) garment for each subject were recorded and stored in a flash memory card. The respiratory waveforms were then displayed by the VivoLogic software on a computer monitor. All respiratory cycles during the recording periods were identified manually by a clinician blinded to the study. The clinician places the markers at the starting and ending of inhalation and exhalation of each breath trace. Then, using the software, the duration and volume of inhalation, exhalation and breath-hold time for each breath was calculated.
Sampling for biomarkers
Beginning on the morning of the Baseline period, 24-hour urine samples for nicotine equivalents – nicotine and five major nicotine metabolites (nicotine, cotinine, trans-3′-hydroxycotinine, nicotine-N-glucuronide, cotinine-N-glucuronide and trans-3′-hydroxycotinine-O-glucuronide) were collected on each day. A blood sample for carboxyhemoglobin (COHb) was collected at 19:00 on each of the study days.
The 24-hour urinary nicotine equivalents were analyzed by LC-MS/MS. Blood COHb was analyzed spectrophotometrically. The analytical methods for the biomarkers are described in detail elsewhere (Mendes et al., Citation2009). All the bioanalytical work was performed at MDS Pharma Services (Now Celerion, Lincoln, NE).
Product Assessment Questionnaire
The participants completed a Product Assessment Questionnaire between 15:00 and 18:00 on Days 1 through 4. The participants were asked to assign a score on a scale of 1–7 for Liking, 1 = Dislike Extremely, 7 = Like Extremely; Strength, 1 = Very Low, 7 = Very High and Draw, 1 = Very Hard to Draw, 7 = Very Easy to Draw. The participants were also asked to report their self-assessment of depth of inhalation at 15:00 and 18:00 on Days 1 through 4 and rate on a scale of 1–7 (1 = Less, 7 = Extremely deep).
Statistical analysis
A paired sample t-test was used to test the difference in smoking topography, inhalation and exhalation parameters, 24-hour urine nicotine equivalents and blood COHb between baseline and post-baseline for each of the two test cigarette groups by the study day. If the assumption of normally distributed biomarker value was markedly violated, the Wilcoxon signed rank test was used.
Linear mixed model for repeated measures analysis of covariance (ANCOVA) was used to test the difference in smoking topography, inhalation and exhalation parameters, 24-hour urine nicotine equivalents and blood COHb between the two groups, study days and the two sequences. The number of cigarettes smoked on each study day, age and baseline values were included in the model as covariates.
Baseline data were pooled from the two sequences if the sequence effect was not significant. The post-baseline data were pooled from the two sequences by treatment if the sequence effect and day effects were not significant.
The data collected from the Product Assessment Questionnaire were summarized with the frequency counts for each question. Descriptive statistics (mean, standard deviation [SD], median, minimum [min], maximum [max], 25 percentile, 75 percentile, sample size [n], 95% CI) for the answers given to each question were calculated.
All analyses were performed with SAS 8.1 (SAS Institute, Cary, NC) software. Significance was set at p < 0.05. Data are presented as Mean ± SD unless otherwise stated.
Results
Twenty adult male smokers were enrolled and 19 completed the 5-day study. The baseline characteristics of the participants are presented in . Pooled means and statistical comparisons between TCH and TCL groups for puffing topography, respiratory parameters and biomarkers of exposure are presented in .
Table 1. Demographics of participants.
Table 2. Puffing topography, respiratory parameters and biomarkers of exposure.
Smoking puffing topography
The average number of puffs per cigarette, average puff volume and average puff durations were statistically significantly lower, and average inter-puff interval was statistically significantly longer while participants smoked the TCH compared to the TCL.
Number of cigarettes smoked
At the baseline, the number of cigarettes smoked was similar for the two sequence groups. Following Baseline, participants in the L-H sequence group smoked more of the TCL cigarettes each day in Period 1 (23.5 ± 4.2 and 24.0 ± 4.5 CPD) than the TCH (21.9 ± 3.7 and 22.6 ± 4.4 CPD) Participants in the H-L sequence group smoked slightly fewer cigarettes for TCH (20.5 ± 2.8 and 21.3 ± 2.9 CPD) compared to the TCL (22.4 ± 3.3 and 22.7 ± 2.8 CPD).
Smoking respiratory parameters
Two major breathing patterns were identified, which represented approximately 90% of the breathing episodes recorded during the study (). The distribution of pattern I and pattern II is presented in . The distribution of the two patterns was similar for TCH and TCL, no statistical analyses were performed due to the large variability. All the inhalation and exhalation parameters (average inhalation volume, average inhalation time, average exhalation volume, average exhalation time and average breath-holding time) were not statistically significantly different between the TCH and TCL groups.
Figure 2. Respiratory patterns.
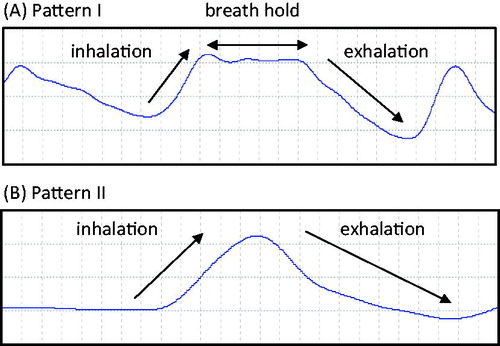
Table 3. Distribution of breathing pattern.
Biomarkers of exposure
Urinary nicotine equivalents (both mg/24 h and mg/cig) and COHb were statistically significantly lower during the TCL smoking period compared to the TCH cigarette smoking period.
Product Assessment Questionnaire responses
Participants generally rated the test cigarettes lower in liking, strength and draw compared to their own brand of cigarettes. The TCL was rated lower than the TCH for liking, strength and draw during both sequences. No test product related differences were observed for self-reported depth of inhalation.
Discussion
The main finding from this study is that we found no indication of changes in respiratory parameters, particularly inhalation time and volume, between study participants smoking lower versus higher yield cigarettes. These findings are further supported by the lack of change in self-reported depths of inhalation while smoking the test cigarettes.
There were some differences between groups for puffing topography parameters, which is consistent with a number of other studies published (Bridges et al., Citation1990; Djordjevic et al., Citation2000; Herning et al., Citation1981; Tobin & Sackner, Citation1982; Zacny et al., Citation1986). Despite the slight increase in cigarette consumption and statistically significant changes in puffing parameters, the biomarkers of exposure in participants smoking TCL were statistically significantly lower compared to that for TCH. These observations confirm literature reports that partial compensation occurs when smokers switch to lower yield cigarettes; however, this compensation is not sufficient to offset the reductions in biomarkers of exposure.
Furthermore, the biomarker data provide no indication of deeper inhalation when smoking low-yield cigarettes compared with higher yield cigarettes. Post-baseline urinary nicotine equivalents and carboxyhemoglobin were statistically significantly lower in the study participants when smoking a lower yield cigarette compared to the higher yield cigarette.
In a previous study, Feng et al. (Citation2007) have utilized the identical respiratory inductive plethysmography device (Life-Shirt Device) as used in the present study to examine the retention of various smoke constituents under three predefined smoking patterns: no inhalation, normal inhalation and deep inhalation. The average inhalation volumes were reported to be 1081 ± 395 mL for the normal breathing patterns and 2370 ± 765 mL for the deep inhalation patterns. The results from this study suggest that if indeed the participants were taking a deep inhalation, we would have observed a substantial increase in the inhalation volume. The relatively large differences in inhalation volume when participants actually took deep inhalation also validates the utility of the Life-Shirt device in detecting differences between normal and deep inhalation patterns.
The findings reported in our study are consistent with findings from previous published studies. Rawbone et al. (Citation1978) used a mercury strain gauge chest pneumograph to compare inhalation patterns in 10 habitual “middle tar” smokers with five habitual “low tar” smokers. These investigators developed a “smoke exposure index”, which they defined by summing the area under the curve of the chest pneumograph tracing for each inhalation of smoke. According to the investigators, this index accounted for both depth of inhalation of smoke and the length of time smoke remained in the lungs. The investigators reported no significant difference in the smoke exposure index between habitual “middle tar” and “low tar” cigarette smokers. The results of our study are consistent with these findings.
Guillerm & Radziszewski (Citation1978) used impedance pneumography to measure puff volume and inhalation volume for eight smokers. A high-tar cigarette was compared to an experimental low-tar cigarette of approximately the same yield of nicotine. The experimental cigarette also contained activated carbon in the filter. Although the authors corroborate our study results regarding no significant differences in inhalation volume, they did not observe any differences in puff volume, perhaps due to the variability observed with small number of subjects.
Another study (Tobin & Sackner, Citation1982) measured both puffing and inhalation parameters simultaneously in 10 subjects using inductive plethysmography. Comparisons were made between subjects smoking either high-tar or low-tar cigarettes. In this study, Tobin et al. report that puff volume (mean ± SD) was significantly higher, while smoking low-tar cigarettes (52 ± 15 mL) compared with smoking high-tar cigarettes (39 ± 10 mL). No significant difference (mean ± SD) between smoking low-tar versus high-tar cigarettes was observed for breath-hold duration (5.5 ± 2.6 s versus 5.6 ± 2.4 s) or inhalation volume (841 ± 517 mL versus 748 ± 323 mL). The results of our study are similar to the observations reported by these investigators.
McBride et al. (Citation1984) studied nine smokers with three different cigarettes: their own brand, a low-tar cigarette and a medium-tar cigarette. Measurements of puff volume and inhalation volume were made by a respiratory inductive plethysmograph. The measured puff volumes (mean ± SD) were 42.1 ± 7.5 mL, 47.5 ± 9.4 mL and 38.2 ± 8.0 mL in order of own brand, low tar and medium tar. The measured inhalation volumes were: 549 ± 166 mL, 560 ± 150 mL and 585 ± 245 mL. The puff volume was statistically significantly higher for the low-tar cigarette compared to own brand. Similar to the findings of McBride, we observed no indication of significant differences in inhalation volumes between subjects smoking cigarettes with different tar yields.
A study by Zacny et al. (Citation1986) measured puff volumes and inhalation volumes for cigarettes of different tar levels. In a series of smoking sessions, seven cigarette smokers smoked one of each of an ultra-low tar commercial cigarette in which the ventilation holes had been unblocked, or blocked with tape at 50%, or blocked 100%. As tar yield increases with ventilation blocking, these cigarettes can be designated low tar, medium tar and high tar, respectively. Puff parameters were measured by a pressure sensitive switch and pressure transducer. Inhalation volumes were measured by respiratory inductive plethysmograph. Puff volume (mean ± SD) was significantly elevated (63.3 ± 1.7 mL versus 42.8 ± 2.2 mL) for low tar versus high tar, but was unchanged for low tar versus medium tar (54.8 ± 2.0 mL). Lung exposure duration was significantly reduced for low tar versus high tar (mean ± SD): 4.5 ± 0.32 s versus 5.4 ± 0.35 s, but was unchanged for low tar versus medium tar (4.9 ± 0.3 s). Inhalation volume expressed as percent of vital capacity was the same for the three cigarettes (mean ± SD): 18.3 ± 1.3, 19.9 ± 1.2 and 19.0 ± 1.1 for low tar, medium tar and high tar, respectively. Therefore, these results demonstrate no difference in respiratory parameters between smokers across a wide range of cigarette ventilation levels and tar yields. Our study results agree with the findings of Zacny et al.
Zacny & Stitzer (Citation1988) conducted a follow-up study in 10 subjects smoking their own brand and four additional commercial cigarette brands each for five days over a study period that lasted for five weeks. Subjects first smoked their own brand (average nicotine yield of 1.0 mg by the Cambridge filter method). The subjects were then switched in random order to commercial brands with nicotine yields of 0.1, 0.4, 0.7 and 1.1 mg; and tar yields of 1, 5, 10 and 16 mg, respectively. Puff volumes were measured using a pneumotachograph to measure pressure changes. Inhalation volumes were measured by respiratory inductive plethysmograph. Mean puff volumes (64.7, 58.0, 61.1, 52.4 and 53.4 mL) trended lower for higher nicotine yield cigarettes (0.1, 0.4, 0.7 and 1.0–1.1 mg). There was no effect of cigarette nicotine yield on either inhalation volume or lung exposure time. Inhalation volume ranged from 670 mL to 774 mL, and lung exposure time ranged from 5.0 s to 5.6 s. The observations from our study corroborate these findings.
Nil et al. (Citation1986) measured puffing and respiration behavior for cigarettes of lower tar compared to subjects’ own higher tar brand. Respiratory measurements were made by the transthoracic impedance plethysmography. It was a large study with 69 male subjects and 48 female subjects. Puff volume (mean ± SD) was statistically significantly larger for lower tar in men only (50.2 ± 16.3 mL versus 42.3 ± 14.5 mL). The authors report no statistically significant differences between lower tar and higher tar for men or women for any of the respiratory variables measures. The results (mean ± SD) comparing lower to higher tar were: inspiration latency (0.35 ± 0.38 s versus 0.39 ± 0.48 s for men; 0.16 ± 0.19 s versus 0.17 ± 0.26 s for women), inspiration time (1.28 ± 0.53 s versus 1.25 ± 0.43 s for men; 1.14 ± 0.46 s versus 1.17 ± 0.42 s for women), expiration time (1.96 ± 0.59 s versus 1.87 ± 0.66 s for men; 1.95 ± 0.91 s versus 1.82 ± 0.84 s for women), inspiration volume (600 ± 500 mL versus 500 ± 300 mL for men; 400 ± 300 mL versus 400 ± 300 mL for women) and expiration volume (600 ± 400 mL versus 600 ± 400 mL for men; 600 ± 400 mL versus 500 ± 300 mL for women). The results from our study are generally consistent with these observations.
More recently, St. Charles et al. (Citation2009) conducted post-puff respiration measurements of smokers whose own brands spanned a tar yield range from 1 to 17 mg by the Cambridge filter method. Seventy-four established smokers were categorized into groupings according to the tar yield of the cigarettes they customarily smoked. These were 1–3 mg; 4–6 mg; 1–13 mg and 14 + mg. Inhalation patterns were measured by respiratory inductive plethysmography. Comparing the lowest versus highest tar, St. Charles found a mean ± SD of 778 ± 240 mL versus 876 ± 270 mL for inhalation volume; 841 ± 259 mL versus 960 ± 285 mL for exhalation volume, and 2.04 ± 1.92 s versus 1.87 ± 1.07 s for inhalation time. For respiratory volumes normalized to resting tidal volume, no significant differences were observed between the different tar bands for inhalation volume, exhalation volume, inhalation duration and exhalation duration. Our results agree with the conclusions drawn from this study.
The findings of this study should be considered in light of several limitations. One such limitation is the small number of subjects participating in the study. Nevertheless, the number of subjects used in this study is typical of other studies of this type published in the scientific literature. Despite the small sample size, both the puffing topography and respiratory parameter findings are consistent with other published studies as noted above. Moreover, the biomarker and self-reported depth of inhalation data support the apparent lack of differences in respiratory parameters. Another limitation is that subjects were switched from their own brand of cigarettes to either high tar or to low tar test cigarettes with blend characteristics likely to be different from their own brands. The subjective ratings data suggest smokers did not like the test cigarettes as much as their own brand. It is possible that smokers may have altered their smoking behavior as a result of switching from a product to which they were accustomed to a test product. Because this study evaluated short-term switching, it is possible that smoking behavior had not stabilized during the study periods. Finally, these studies were conducted under laboratory condition, which may have altered the way subjects smoked compared to a natural setting. However, it would not be feasible to conduct the type of measurements described in this study in an ambulatory setting. For example, it would be difficult to ensure compliance to the protocol and confirm that participants use the test product, in a non-clinic-based setting. Nevertheless, despite these limitations, the findings of the study reported here are consistent with several other published studies providing no indication of increased depth of inhalation volume when smoking low-tar cigarettes.
It is not surprising that smoking low-tar cigarettes would not lead to an increased depth of inhalation. The prevailing theory about compensation behavior suggests smokers compensate by altering their smoking behaviors to obtain a desired level of nicotine (Benowitz, Citation2001). This could include taking larger and/or more frequent puffs, smoking more or less of the full length of individual cigarettes, or adjusting the number of cigarettes smoked per day. However, studies have shown that nearly 100% of nicotine is absorbed from tobacco smoke during typical inhalation volumes (Armitage et al., Citation2004; Baker & Dixon, Citation2006; Feng et al., Citation2007; Zacny et al., Citation1987). Therefore, there would nothing to be gained by deeper inhalation as far as nicotine uptake is concerned.
The belief that smoking low-yield cigarettes results in deeper inhalation continues to persist despite the lack of supporting evidence and a large collective body of evidence to the contrary. A possible explanation for this may be that some investigators appear to conflate changes in puffing behavior with inhalation behavior. For example, Wynder (Citation1998) stated “…smokers inhale the smoke of cigarettes with low-nicotine yields more deeply into the lungs, having changed their smoking pattern from taking about one 35-mL puff per minute in the 1930s and 1940s to taking one to three puffs per minute with puff volumes up to 65 mL in recent years (7) ()”. In this example, the author refers to a paper that contains no depth of inhalation data, and to a table that contains only puffing topography data but no inhalation data. Similarly, Brooks et al. (Citation2005) cite Zacny & Stitzer (Citation1988) in support of the statement that there is “an altered inhalation pattern” and suggests this change causes deeper penetration of smoke in the lungs. However, while Zacny & Stitzer (Citation1988) reported differences in puffing parameters between high- and low-yield cigarettes, regarding inhalation, the authors concluded that “in the present study, subjects did not alter either inhalation volume or lung exposure duration in response to cigarette yield alterations”.
Conclusions
In conclusion, under the conditions of this study, we found no indication of changes in respiratory parameters, particularly inhalation time and volume, between study participants smoking lower versus higher yield cigarettes. A unique aspect and strength of this study is the inclusion of biomarkers of exposure to support findings from the puffing topography and respiratory parameter measurements. The biomarker data, particularly carboxyhemoglobin, which is traditionally considered a biomarker of smoking intensity provide no indication of deeper inhalation when smoking low-yield cigarettes compared with higher yield cigarettes. Differences between groups for puffing topography parameters were observed as have been reported in previous studies. These collective findings, are consistent with the published literature, indicate smoking low-yield cigarettes does not result in an increased depth of inhalation.
Declaration of interest
The authors are employees of Altria Client Services Inc.
References
- Armitage AK, Dixon M, Frost BE, et al. (2004). The effect of inhalation volume and breath-hold duration on the retention of nicotine and solanesol in the human respiratory tract and on subsequent plasma nicotine concentrations during cigarette smoking. Beitr Tabakforsh Int 21:240–9
- Baker RR, Dixon M. (2006). The retention of tobacco smoke constituents in the human respiratory tract. Inhal Toxicol 18:255–94
- Benowitz N. (2001). Compensatory smoking of low-yield cigarettes. In: Shopland DR, et al. (eds.) Risks associated with smoking cigarettes with low machine-measured yields of tar and nicotine. Smoking and tobacco control monograph 13. Bethesda, MD: U.S. Department of Health and Human Services, Public Health Service, National Institutes of Health, National Cancer Institute, 39–64
- Bridges RB, Combs JG, Humble JW, et al. (1990). Puffing topography as a determinant of smoke exposure. Pharmacol Biochem Behav 37:29–39
- Brooks DR, Austin JH, Heelan RT, et al. (2005). Influence of type of cigarette on peripheral versus central lung cancer. Cancer Epidemiol Biomarkers Prev 14:576–81
- Burns DM, Anderson CM, Gray N. (2011). Has the lung cancer risk from smoking increased over the last fifty years? Cancer Causes Control 22:389–97
- Djordjevic MV, Stellman SD, Zang E. (2000). Doses of nicotine and lung carcinogens delivered to cigarette smokers. J Natl Cancer Inst 92:106–11
- Feng S, Plunkett SE, Lam K, et al. (2007). A new method for estimating the retention of selected smoke constituents in the respiratory tract of smokers during cigarette smoking. Inhal Toxicol 19:169–79
- Guillerm R, Radziszewski E. (1978). Analysis of smoking pattern including intake of carbon monoxide and influences of changes in cigarette design. In: Raymond T. (ed.) Smoking behaviour: physiological and psychological influences. Edinburgh and London: Churchill Livingstone, 361–70
- Herning RI, Hunt JS, Jones RT. (1983). The importance of inhalation volume when measuring smoking behavior. Behav Res Meth Instrum 15:561–8
- Herning RI, Jones RT, Bachman J, Mines AH. (1981). Puff volume increases when low-nicotine cigarettes are smoked. Br Med J (Clin Res Ed) 283:187–9
- Institute of Medicine (US) Committee to Assess the Science Base for Tobacco Harm Reduction (IOM). (2001). Clearing the smoke: assessing the science base for tobacco harm reduction. Washington, DC: National Academies Press
- Konno K, Mead J. (1967). Measurement of the separate volume changes of rib cage and abdomen during breathing. J Appl Physiol 22:407–22
- McBride MJ, Guyatt AR, Kirkham AJ, Cumming G. (1984). Assessment of smoking behaviour and ventilation with cigarettes of differing nicotine yields. Clin Sci (Lond) 67:619–31
- Mendes P, Liang Q, Frost-Pineda K, et al. (2009). The relationship between smoking machine derived tar yields and biomarkers of exposure in adult cigarette smokers in the US. Regul Toxicol Pharmacol 55:17–27
- Nil R, Buzzi R, Battig K. (1986). Effects of different cigarette smoke yields on puffing and inhalation: Is the measurement of inhalation volumes relevant for smoke absorption? Pharmacol Biochem Behav 24:587–95
- Patil Y, Lopez-Meyer P, Tiffany S, Sazonov E. (2013). Detection of cigarette smoke inhalations from respiratory signals using reduced feature set. Conf Proc IEEE Eng Med Biol Soc 2013:6031–4
- Rawbone RG, Murphy K, Tate ME, Kane SJ. (1978). The analysis of smoking parameters: inhalation and absorption of tobacco smoke in studies of human smoking behaviour. In: Raymond T. (ed.) Smoking behaviour: physiological and psychological influences. Edinburgh and London: Churchill Livingstone, 171–94
- Sackner MA, Watson H, Belsito AS, et al. (1989). Calibration of respiratory inductive plethysmograph during natural breathing. J Appl Physiol 66:410–20
- St. Charles FK, Krautter GR, Mariner DC. (2009). Post-puff respiration measures on smokers of different tar yield cigarettes. Inhal Toxicol 21:712–18
- Sutton SR, Russell MA, Iyer R, et al. (1982). Relationship between cigarette yields, puffing patterns, and smoke intake: evidence for tar compensation? Br Med J (Clin Res Ed) 285:600–3
- Thun MJ, Carter BD, Feskanich D, et al. (2013). 50-Year trends in smoking-related mortality in the United States. New Engl J Med 368:351–64
- Tobin MJ, Sackner MA. (1982). Monitoring smoking patterns of low and high tar cigarettes with inductive plethysmography. Am Rev Respir Dis 126:258–64
- U.S. Department of Health and Human Services (USDHHS). (1988). The health consequences of smoking: nicotine addiction. A report of the Surgeon General. Atlanta, GA: U.S. Department of Health and Human Services, Public Health Service, Centers for Disease Control, National Center for Chronic Disease Prevention and Health Promotion, Office on Smoking and Health
- U.S. Department of Health and Human Services (USDHHS). (2010). How tobacco smoke causes disease: the biology and behavioral basis for smoking-attributable disease: a report of the Surgeon General. Atlanta, GA: U.S. Department of Health and Human Services, Centers for Disease Control and Prevention, National Center for Chronic Disease Prevention and Health Promotion, Office on Smoking and Health
- U.S. Department of Health and Human Services (USDHHS). (2014). The health consequences of smoking – 50 years of progress. A report of the Surgeon General. Atlanta, GA: U.S. Department of Health and Human Services, Centers for Disease Control and Prevention, National Center for Chronic Disease Prevention and Health Promotion, Office on Smoking and Health [Printed with corrections, January 2014]
- Wynder EL. (1998). Cigarette smoking and the histopathology of lung cancer. J Natl Cancer Inst 90:1486–7
- Zacny JP, Stitzer ML, Brown FJ, et al. (1987). Human cigarette smoking: effects of puff and inhalation parameters on smoke exposure. J Pharmacol Exp Ther 240:554–64
- Zacny JP, Stitzer ML, Yingling JE. (1986). Cigarette filter vent blocking: effects on smoking topography and carbon monoxide exposure. Pharmacol Biochem Behav 25:1245–52
- Zacny JP, Stitzer ML. (1988). Cigarette brand-switching: effects on smoke exposure and smoking behavior. J Pharmacol Exp Ther 246:619–27