
Abstract
Context: Acrolein is a reactive aldehyde mainly formed by combustion. The critical effect is considered to be irritation of the eyes and airways; however, the scarce data available make it difficult to assess effect levels.
Objective: The aim of the study was to determine thresholds for acute irritation for acrolein.
Methods: Nine healthy volunteers of each sex were exposed at six occasions for 2 h at rest to: clean air, 15 ppm ethyl acetate (EA), and 0.05 ppm and 0.1 ppm acrolein with and without EA (15 ppm) to mask the potential influence of odor. Symptoms related to irritation and central nervous system effects were rated on 100-mm Visual Analogue Scales.
Results: The ratings of eye irritation were slightly but significantly increased during exposure to acrolein in a dose-dependent manner (p < 0.001, Friedman test) with a median rating of 8 mm (corresponding to “hardly at all”) at the 0.1 ppm condition and with no influence from EA. No significant exposure-related effects were found for pulmonary function, or nasal swelling, nor for markers of inflammation and coagulation in blood (IL-6, C-reactive protein, serum amyloid A, fibrinogen, factor VIII, von Willebrand factor, and Clara cell protein) or induced sputum (cell count, differential cell count, IL-6 and IL-8). Blink frequency recorded by electromyography was increased during exposure to 0.1 ppm acrolein alone but not during any of the other five exposure conditions.
Conclusion: Based on subjective ratings, the present study showed minor eye irritation by exposure to 0.1 ppm acrolein.
Introduction
Acrolein is a reactive aldehyde formed by burning wood, plastic, diesel fuel, paraffin wax, smoking, and cooking but no data on occurrence and levels of acrolein have been found in Swedish environment. Reports from other countries indicate that the substance is often found in indoor air. Few studies suggest that indoor levels were higher in summer than winter (suggesting that higher moisture content and temperature increase the formation of acrolein) (Seaman et al., Citation2007). A study in the United States (Logue et al., Citation2010) has calculated the cumulative health impact of 1192 substances in indoor air in the United States. Particulate matter (PM 2.5), acrolein, and formaldehyde were listed as the most important agents. The overall health impact (non-cancer effects) of acrolein was estimated to 47 DALYs (Disability Adjusted Life Years) per year and 1000 residents. Researchers in Japan came to similar results, out of 93 substances in indoor air formaldehyde and acrolein were judged to have the highest risk levels (Azuma et al., Citation2007).
Acrolein is commonly used as intermediate in chemical manufacturing and as herbicide or slimicide in canals for water irrigation. It is also produced by burning wood, plastic, gasoline, diesel exhaust, cigarette smoke, and emission from cooking (Beauchamp et al., Citation1985). Acrolein is generated in environment by incomplete combustion from both fixed and mobile sources; it represents up to 8% of the total aldehydes produced from vehicles and residential fire places and 13% of total atmospheric aldehyde (Ghilarducci & Tjeerdema, Citation1995). Small amount of acrolein is also present in our body as metabolite of allyl alcohol, allylamine, spermine, spermidine, cyclophosphamide, and as a product of UV radiation of skin and lipid triolein (Ghilarducci & Tjeerdema, Citation1995). Furthermore, small amounts are found in food when animals or vegetable fats are heated more than 300 °C. A large proportion of the population is predominantly exposed via air (smoke from cigarettes, automobiles, industrial processes, and structural and vegetation fires). Firefighters may be exposed to extremely high levels of acrolein (Faroon et al., Citation2008a). The US Environmental Protection Agency (EPA) estimates that about 75% of ambient acrolein originates from mobile sources, with the remainder from agriculture, industrial processes, tobacco smoke, and forest fires (Ghilarducci & Tjeerdema, Citation1995).
Acrolein is a highly reactive electrophile and binds to cellular nucleophiles such as glutathione. It can also react and form adducts with cysteine, histidine, and lysine residues of protein and with nucleophilic sites of DNA (Kehrer & Biswal, Citation2000). Acrolein adducts altered the function of these molecules which may explain cytotoxicity, genotoxicity and mutagenic activity in Drosophila (Sierra et al., Citation1991). Further, acrolein caused gene mutations in E. coli and Salmonella typhimurium without addition of exogenous metabolic system. Acrolein also caused DNA–protein cross-links and DNA strand breaks in cultured mammalian cells (IARC, Citation1995). It is known as pulmonary toxicant (Grafström et al., Citation1987).
Acrolein is considered to be highly irritating to eyes and respiratory tract. Weber-Tschopp et al. (Citation1977) have performed a study were subjective methods (questionnaires), eye blink frequency and respiration rate were used to examine irritation of acrolein. They found eye, nasal, and throat irritation beginning at exposure to 0.09 ppm, 0.26 ppm, and 0.43 ppm, respectively. In one of their experiments eye blink frequency increased significantly during the first 20–30 min of exposure to 0.3 ppm and a decrease in the average respiration rate after 40 min of exposure was found.
Inhalation of air pollutants creates a low-grade inflammatory response and an increase of inflammatory markers in the blood (Brook et al., Citation2010). During the 1997 Southeast Asian forest fires IL-6 levels in blood increased among firefighting staff (Van Eeden et al., Citation2001). Acrolein is a major irritant in fire smoke and might be a major responsible agent causing the increase in IL-6.
The Swedish short-term occupational exposure limit (OEL) is 0.3 ppm and the 8 h OEL is 0.1 ppm set in 1974 (Swedish Work Environment Authority, Citation2011). However, the basis for the OELs is scanty. The 8 h OEL in United States is also 0.1 ppm (American Conference of Government Industrial Hygienists, ACGIH).
The aim of the study was to estimate the threshold levels for acute irritation of acrolein. To this purpose we exposed human volunteers to low levels of acrolein and performed a wide spectrum of tests (e.g. pulmonary function, nasal swelling, blink frequency, inflammatory markers) together with subjective ratings. The subjects were exposed to lower levels of acrolein and performed a wider spectrum of tests compared to in previous studies of acute effects of acrolein (Weber et al., Citation1976; Weber-Tschopp et al., Citation1977).
Material and methods
Subjects
The subjects were students recruited by advertisement at Karolinska Institutet. The inclusion criteria were: 20–50 years old, healthy, nonsmoker, and without chronic diseases. A medical examination, including clinical blood chemistry tests, was performed prior to exposure. To avoid unintended fetal exposure, females performed a pregnancy test (Instalert hCG test, Innovacon Inc, San Diego, CA) immediately before each exposure (6 times during the study). None of the subjects used contact lenses in the exposure chamber. The subjects were informed about the design of the study, the possible hazards, and their right to immediately and unconditionally interrupt the exposure. Each participant signed a written consent after the presentation of oral and written information. The study was performed according to the Helsinki declaration and was approved by the Regional Ethical Review Board in Stockholm.
Experimental design
A pilot study was performed with 4 males and 4 females to roughly determine the limits of odor and irritation of acrolein according to a previously used design (Ernstgård et al., Citation2009b). The aim of the pilot study was to set the high and low exposure levels in the main study. In the pilot study volunteers were exposed to increasing concentrations of acrolein starting with 0.02, 0.04, 0.07, 0.1, 0.2, and 0.3 ppm, in an exposure chamber. Each exposure level lasted for 10 min and at each level volunteers rated symptoms on visual analog scales as described below. Based on the results of the pilot study, the exposure levels were set at 0.05 and 0.1 ppm acrolein in the main study. The latter included 18 healthy volunteers, nine women (average age 23, range 20–26 years) and nine men (25, 21–38 years). Up to three subjects at the same time were exposed in the chamber for 2 h on six different occasions to: clean air (control), 15 ppm ethyl acetate (EA), 0.05 ppm acrolein (low ACR), 0.05 ppm ACR and 15 ppm EA (low ACR + EA), 0.1 ppm ACR (high ACR) and 0.1 ppm ACR, and 15 ppm EA (high ACR + EA). EA was used to mask the potential influence of acrolein odor while seated in an exposure chamber with controlled climate. Each exposure session was separated by at least one exposure-free week and the exposure sequences followed a balanced design. The subjects were instructed not to discuss their symptoms or assumed exposure conditions with anyone until after the final exposure session.
Test substance
Acrolein ≥99% (FLUKA Analytical, Sigma-Aldrich, Buchs, Switzerland) and EA ≥99% (Merck, Darmstadt, Germany) were used for the chamber exposure.
Exposure chamber
The exposures were carried out in 20 m3 dynamic exposure chamber with 18–20 air changes per hour. Temperature, relative humidity, and carbon dioxide level of chamber air were continuously monitored via an analog digital converter (Squirrel Data Logger 2020 series, Grant, Cambridge, UK). During the experiments temperature and humidity were very close to the target temperature 24.0 °C and humidity 30% (common indoor humidity in Sweden is 20–40%) with little variation (standard deviation (SD) 0.1–0.5 °C and 0.7–5.3%, respectively) (). To avoid leakage of acrolein and EA vapors into the surrounding laboratory, the outlet airflow rate was set higher than the inlet rate. Acrolein and EA vapors were generated by injecting liquid acrolein (0.1%) and EA into inlet air by means of a high pressure chromatography piston pump. The inlet air was dispersed in the chamber ceiling (the exposure chamber is described in more detail in Ernstgård et al., Citation2009a).
Table 1. Exposure conditions.
The air in the exposure chamber was monitored for acrolein and EA by gas chromatography. The air was sucked with an air pump from the upper (20 cm below the ceiling) central part of the exposure chamber through a Teflon®-coated tube. The gas chromatograph (Auto system, Perkin Elmer, Norwalk, CT) was equipped with a wide bore capillary column (CP wax 58, 25 m, 0.32 ID, 0.02 μm, Varian) and a flame ionization detector. Nitrogen was used as a carrier gas at a column pressure of 9.6 psi. The temperature of the injector was 250 °C and of the detector 275 °C. The column temperature was kept at 60 °C. Calibration standards were prepared by filling Tedlar bags (1–3 l, SKC, Inc., Eighty Four, PA) with known volumes of clean air by means of a calibrated pump (AirCheck sampler, Model 224-PCXR8, SKC, Inc., Eighty Four, PA) and known amounts of acrolein or EA added in gas-tight Micro Syringes (Hamilton). The limit of detection (LOD), calculated from the minimum peak area that could be identified by the integrator, was about 0.01 ppm for both acrolein and EA.
The measured chamber air concentrations of acrolein were close to the target concentrations (within 10%) and varied 6–7% (coefficient of variation, CV) between exposure sessions. The EA concentrations were also close to target with low variability (CV 2–4%) ().
The methods to measure symptoms and effects in the eyes, airways, and nose were the same as previously used (Ernstgård et al., Citation2006a,b Citation,c,Citation2009a,2012) but are briefly described below for convenience.
Symptoms ratings
The volunteers rated symptoms on a 0–100 mm visual analog scale graded from “not at all” through “hardly at all”, “rather”, “quite”, “very” to “almost unbearable” in a questionnaire with 10 questions. The questions were (1) “discomfort in the eyes: burning, irritated, or running eyes”; (2) “discomfort in the nose: burning, irritated, or running nose”; (3) “discomfort in the throat or airways”; (4) “dyspnea”; (5) “smell”; (6) “headache”; (7) “fatigue”; (8) “nausea”; (9) “dizziness”; and (10) “feeling of intoxication”. Symptoms rating were performed immediately before exposure, during exposure (3, 60, and 118 min from start of exposure), and post-exposure (20 and 180 min, and 22 h).
Eye blink
The blink movements of the left eye were measured by electromyography (EMG) via three skin electrodes, two on M. orbicularis oculi and one reference electrode on the cheek bone. The EMG signal was amplified and transferred via telemetry to a personal computer. Blink frequency was continuously recorded from 2 min before exposure and throughout the entire exposure period. All eye blinks during exposure were counted in 20-min intervals blinded to the exposure conditions. A dedicated software program was developed in Borland C++ for counting of the blink frequency. Basically, two filters were used, one for amplitude and one for latency, to identify the characteristic EMG signal pattern of a complete blinking, i.e. a sharp positive signal peak immediately followed by a negative peak with less amplitude approximately 50 milliseconds later.
Airway measurements
Pulmonary function parameters were measured prior to, immediately after, and at 3.5 h post-exposure. The pulmonary function tests were performed using a spirometer (Vitalograf 21210; Buckingham, UK) along with designated computer software (Spirotrac 3, v 2.0, Buckingham, UK). The measurements included vital capacity (VC), forced vital capacity (FVC), forced expiratory volume in 1 s (FEV1), peak expiratory flow (PEF) and forced expiratory flow at 5%, 50%, and 75% of FVC (FEF25, FEF50, FEF75). The highest values of three slow and three forced exhalations were used. We have since many years routinely used both FVC and VC in our pulmonary function measurements since several investigators suggest that in subjects with airway obstruction, VC may be a more appropriate measure than FVC (Cotes et al., Citation1997; Miller et al., Citation2005; Paoletti et al., Citation1986).
The breathing frequency was measured by means of respiratory inductive plethysmography (Xact Trace, Becker Meditec, Karlsruhe, Germany), using a flexible belt mounted around the subject’s chest. After the exposure the logged data were transferred to a personal computer and displayed as breathing curves on a computer screen using the Variograph software (v 4.70, Becker Meditec, Karlsruhe, Germany). The breathing frequencies were counted by visual inspection of the curves by a technician blinded to the exposure condition.
Nasal swelling
Nasal swelling was assessed by acoustic rhinometry before, immediately after and at 3.5 h after exposure. The instrument (SRE2000, Rhinometrics, Assens, Denmark) and the corresponding software (Rhinosan, v 2.6, Assens, Denmark) have been described previously (Wålinder et al., Citation1998). The volumes of the nasal cavity of each nostril were measured between 0 and 22 mm (VOL1) and between 23 and 54 mm (VOL2) from the opening of the nostril. The minimum nasal cross-sectional areas between 0 and 22 mm (MCA1) and between 23 and 54 mm (MCA2) were also determined. The average of three measurements from each side of the nose was used in the subsequent analyses. The measurements were performed in a sitting position with the head placed in a frame.
The blocking index, a measure of the nasal airway resistance was calculated as the difference between the mouth and nasal PEF values, divided by the mouth PEF value (Taylor et al., Citation1973). A PEF meter (Mini-Wright, Clement Clarke International Ltd, London, UK) was used to assess nasal and mouth PEF rates. During nasal exhalation, the flow meter was connected to a face mask and the subject exhaled maximally into the flow meter with his mouth closed (Nihlén et al., Citation1998). PEF measurements were performed prior to, immediately after, and at 3.5 h post-exposure. The highest of three measurements was recorded at each occasion.
Inflammatory and coagulation markers in blood
Interleukin-6 (IL-6), C-reactive protein (CRP), serum amyloid A (SAA), fibrinogen, factor VIII, von Willebrand factor, and Clara cell protein (CC16) were analyzed in venous plasma or serum collected before, 3.5 and 22 h post-exposure. CC16 and IL-6 were analyzed using the Human Uteroglobin DuoSet® ELISA Developmental system and Human IL-6 Quantikine® HS Elisa High Sensitivity kit both from R&D Systems® (Minneapolis, MN) respectively according to the protocol by the manufacturer. The LODs were 7.81 pg/ml and 0.016 pg/ml for CC16 and IL-6, respectively.
Inflammatory markers in induced sputum
Sputum induction and processing were performed at 6 h from the start of exposure in control and high ACR exposure as previously described (Strandberg et al., Citation2008). Briefly, the sputum weight was determined and an equal volume of dithiothreitol 0.1% (Sputolysin® reagent, Calbiochem, San Diego, CA) was added to the whole sputum sample and rocked for 15–20 min in a 37 °C in a shaking water bath. The sample was centrifuged (10 min at 280 g). The cell pellet was re-suspended in 2 ml phosphate-buffered saline and put on ice. Total cell count and viability tests with Türk (Histolab Products AB, Gothenburg, Sweden) and Trypan blue (Sigma Aldrich, Steinheim, Germany) were performed. Cytocentrifuge-prepared slides were stained with May-Grünwald Giemsa stain (Sigma Aldrich, Steinheim, Germany) and 300 cells (squamous cells excluded) were assessed for differential cell counts. The sputum samples were included in the analysis if they contained less than 30% squamous cells. The supernatant was dispensed into aliquots and kept in −70 °C until analysis. IL-6 and interleukin-8 (IL-8) were analyzed in supernatant of the sputum. They were analyzed by using Human IL-6 Quantikine® HS Elisa High Sensitivity kit and Human CXCL/IL-8 duo set from R&D Systems® (Minneapolis, MN). The LOD were 0.016 pg/ml and 31.2 pg/ml for IL-6 and IL-8, respectively.
Statistics
The VAS ratings were not normally distributed; therefore, Friedman test was used to explore the differences in symptoms ratings between exposure levels. To examine gender differences in symptom ratings Mann–Whitney U test was used. The non-parametric Wilcoxon matched pair was used to investigate markers in sputum. Blocking index and markers in blood were log transformed prior to the analysis of variance (ANOVA). All the other analyses were performed by repeated measure ANOVA. The STATISTICA (V.10, V.12, Statsoft Inc, Tulsa, OK) software was used for statistical analysis and the significance level was set at 0.05 in all tests.
The statistical analyses of the ratings of irritation were also performed with logistic quantile regression (Bottai et al., Citation2010). When regression models for the different quantiles are estimated jointly, the difference between any regression coefficients can be tested across different quantiles. The analyzed quantiles were 0.25, 0.50, and 0.75 corresponding to the 25th, 50th (median), and 75th percentile. The sampling error was estimated with a cluster bootstrap resampling technique that took the repeated-measures design into account. The same method was also used to analyze correlations between ratings of irritation and inflammatory markers in blood. The effect of exposure on the inflammatory markers was expressed as ratios. For each subject and exposure level the value at 3 h after exposure was divided with the pre-exposure value. The ratios obtained for 0.05 and 0.1 ppm acrolein were then divided by the ratio obtained for control exposure. Thus, a value of 1 for the ratio indicates no change in the inflammatory marker level due to acrolein exposure.
Results
Pilot study
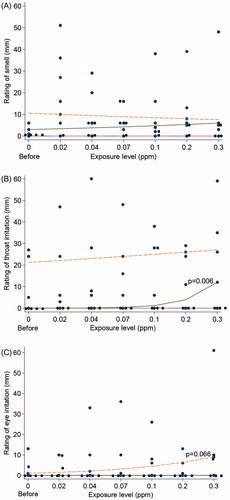
The ratings of smell increased immediately after volunteers entered in to the chamber whereas further increases in concentration had no effect (). The aim of the pilot study was to define the high and low exposure levels for the main study. The logistic quantile regression analyses suggested dose-effect relations for the ratings of irritation, i.e. a significantly increased throat irritation (p = 0.006) for the 50th percentile (median) and a tendency of increased eye irritation (p = 0.066) for the 75th percentile (). However, no clear effect thresholds could be identified (see all results of the ratings in Appendix A). We therefore decided, for ethical reasons, to use the Swedish 8 h OEL of 0.1 ppm as the high level and half of it as the low level.
Figure 1. Ratings of smell (A), irritation in the throat (B), and irritation in the eyes (C) by Visual Analogue Scale (VAS) in eight volunteers in the pilot study with stepwise increasing concentrations of acrolein (10 min per step). The curves represent the 25th, 50th (median), and 75th percentile. Logistic quantile regression analysis revealed significant increased throat irritation (p = 0.006) for the 50th percentile and a tendency of increased eye irritation (p = 0.066) for the highest percentile.
Main study
Symptoms ratings
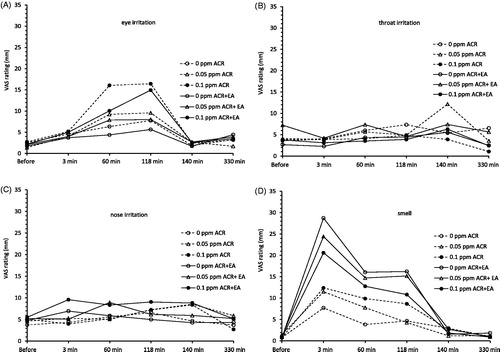
Ratings of eye irritation increased during exposure to acrolein in a dose-dependent manner median values; 0 mm, 1.5 mm (verbally close to “not at all”) and 8 mm (a little more than “hardly at all”) at 118 min of exposure to control, 0.05 ppm and 0.1 ppm of acrolein respectively, (p < 0.001, Friedman test, ). Exposure to EA did not influence the ratings of eye irritation. Median ratings of nose irritation were low (at 3–4 mm) at four exposure conditions but slightly higher (6 mm, hardly at all) at 0.1 ppm acrolein + EA (). The ratings of irritation in the throat were not affected by exposure to neither acrolein, nor EA (). The ratings of smell increased immediately upon entering the chamber and were, as expected, higher during exposure to EA than during exposure to acrolein only (). The ratings of fatigue were increased at all time-points during exposure, with no influence by exposure to acrolein or EA (Appendix B). The other ratings of CNS symptoms were not affected by acrolein, EA or combined exposure of acrolein and EA (Appendix B). No gender differences were observed in any of the ratings except for higher ratings by the females at 60 min of exposure to 0.5 ppm of acrolein and the day after exposure to 0.1 ppm acrolein + EA.
Figure 2. Average ratings of eye irritation (A), nose irritation (B), irritation in the throat (C), and smell (D), in 18 volunteers before, during, and after 2 h exposure to 0 ppm (control), 0.05 ppm and 0.1 ppm acrolein (ACR) and to ethyl acetate (EA 15 ppm), EA + 0.05 ppm ACR and EA + 0.1 ppm ACR. The dotted curves indicate exposure to ACR only, the solid curves EA + ACR.
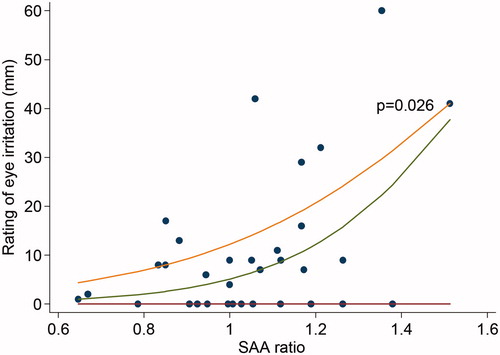
Regarding ratings of eye irritation, the result of the logistic quantile regression analysis showed that the most sensitive subjects (subjects that rated highest), had a significant association (75th percentile, p = 0.026) with higher ratio of SAA after exposure to acrolein (). This was the only significant association between any of the ratings and inflammatory markers in blood. Further analyses revealed no significant correlations between symptom ratings and exposure levels.
Figure 3. Relation between average rating of eye irritation during exposure (3, 60, and 118 min) and serum amyloid A ratio, calculated as ((SAA after acrolein exposure/SAA before acrolein exposure)/(SAA after control exposure/SAA before control exposure)). Each dot represents one subject and one exposure. The curves represent the 25th, 50th (median), and 75th percentile. Logistic quantile regression analysis indicates a significant positive association in the highest percentile, i.e. among the most sensitive subjects with respect to eye irritation (p = 0.026).
Measurements of effects on eyes, airway, and nose
Blink frequency was slightly increased the last 20 min of exposure to 0.1 ppm acrolein compared to the first 20 min of exposure (p = 0.049, ANOVA), an effect not seen in the control or 0.05 ppm exposures (). However, this effect was not observed in the combined exposure to acrolein and EA. No gender differences were observed in blink frequency. No exposure-related effect observed on the breathing frequencies at control and high exposure. There were no exposure-related effects seen in the pulmonary function tests (). No gender differences were observed except for the ratios FEV1/VC and FEV1/FVC, where females, irrespective of exposure, had higher ratios. No exposure-related differences were observed on the nasal measurements such as VOL1, VOL2, MCA1, and MCA2 (). Notably, VOL1 and MCA1 were higher in males.
Table 2. Blink frequency.
Table 3. Pulmonary function and blocking index.
Table 4. Acoustic rhinometry measurements.
Inflammatory and coagulation markers in blood and sputum
Markers of inflammation and coagulation in blood (IL-6, CRP, SAA, fibrinogen, factor VIII, von Willebrand factor, and CC-16) were unaffected by exposure to acrolein (, IL-6 only tested at 0 and 0.1 ppm). Moreover, cell count, differential cell count, IL-6 and IL-8 in the induced sputum samples were not influenced by exposure to acrolein (). No gender differences where seen for any of the markers.
Table 5. Inflammatory markers in plasma.
Table 6. Inflammatory markers in sputum.
Discussion
Acrolein is a highly reactive, potent upper respiratory tract and mucous membrane irritant (Faroon et al., Citation2008a Citation,b). The result of our study showed minor subjective eye irritation at exposure to acrolein at 0.1 ppm. Our findings are in agreement with the study by Weber-Tschopp et al. (Citation1977) who reported a significant increase in eye irritation at 0.09 ppm. The present study comprised a wider spectrum of objective tests (e.g. pulmonary function, nasal swelling, blink frequency, inflammatory markers in blood and sputum) together with subjective ratings compared with previous studies (Weber et al., Citation1976; Weber-Tschopp et al., Citation1977). The purpose of the study was to increase the tools to study low-level acrolein exposures.
In the pilot study volunteers experienced the smell of acrolein immediately when they entered in to the chamber at the concentration 0.02 ppm, with a median rating of 13 mm (Appendix A). This concentration is lower than the previously reported odor threshold of acrolein odor of 0.03 ppm (Sinkuvene, 1970, cited in CICAD, Citation2002) but higher than the odor threshold of 0.0036 ppm suggested by Nagata (Citation2003). Nagata (Citation2003) used a trained panel which might explain the ten-fold lower odor threshold compared to, possibly, naïve subjects. However, after entering the exposure chamber the volunteers were rapidly adapted to the smell and the ratings dropped to about 5 mm, in spite of increased exposure levels. We have previously performed similar pilot studies with various chemical vapors (white spirit, acetic acid, dioxane, hexanal) (Ernstgård et al., Citation2006a,b,c,2009a). In none of those studies did we observe this pattern of decreased ratings of smell in spite of increased exposure levels. One may speculate that the volunteers rate smell due to expectations of odors when entering the exposure chamber so we compared the ratings of smell in the pilot study (after 3 min of exposure) with ratings of smell in the control exposure with clean air in the main study (after 3 min). The median rating of smell in the pilot study was twice as high as in the main study (13 mm versus 6 mm), suggesting that the volunteers did indeed perceive the odor of acrolein. Further, in the main study, the rating of smell was higher during co-exposure to EA than during exposure to acrolein alone. It was suggested by Lang et al. (Citation2008) that EA (12–16 ppm) has a very strong influence on ratings of irritation due to its intensive odor. In spite of this, no significant effect of co-exposure to EA at 15 ppm was observed on ratings other than smell or on measurements of the objective symptoms in this study. Odor may interfere with sensory perception (Doty et al., Citation2004). However, the ratings of smell decrease (), whereas the ratings of eye irritation () increase over time. Further, the ratings of eye irritation during acrolein exposure do not increase when EA is added. Taken together, these two findings suggest that the increased rating of eye irritation from acrolein is not explained by the smell of neither acrolein itself, nor EA.
In the present study, eye irritation was the most prominent effect observed during the 2 h exposures to acrolein. The use of contact lenses might influence the degree of eye irritation. Therefore, the subjects were instructed not to use contact lenses during the experiments. Since the exposure started early in the morning they came directly from home and all subjects with poor eyesight wore glasses (and not contact lenses) when they arrived. Theoretically, but unlikely, some may have used contact lenses for some short period in the morning before arriving to the lab. The ratings of eye irritation before exposure were generally low (median 0 mm), speaking against irritation from contact lenses or other irritating items. The ratings of eye irritation increased during exposure to acrolein in a dose-dependent manner (median values 0, 1.5, and 8 mm at 118 min of exposure to control, 0.05 and 0.1 ppm acrolein, respectively). Co-exposure to EA or exposure to EA alone did not influence the ratings of eye irritation. As these ratings were the only ones that were significantly increased, eye irritation should be considered as the critical effect. However, the median rating only reached 8 mm at the 0.1 ppm condition, this value corresponds to little more than “hardly at all” (at 6 mm) on the VAS scale. Therefore the effect must be considered as minor. Our finding of eye irritation is in agreement with the few previous studies on acrolein available. Weber-Tschopp et al. (Citation1977) performed a study with three acrolein exposure scenarios regarding acute effects in humans. In all experiments, irritation was rated in a questionnaire and eye blink frequency and respiration rate were measured. In the first experiment, 53 subjects were exposed to gradually increasing concentrations of acrolein for 35 min up to 0.6 ppm and then the exposure remained constant for 5 min. Compared to controls, eye irritation was significantly higher beginning at 0.09 ppm. In the second experiment, exposure for 1.5 min to successive concentrations of 0, 0.15, 0.3, 0.45, and 0.6 ppm acrolein (N = 44) was performed. Between each exposure subjects were allowed to recuperate in a clean room for 8 min. Compared to controls eye irritation was significantly higher beginning at 0.3 ppm. In the third experiment, comprising 60 min exposure to a constant acrolein concentration of 0.3 ppm (N = 46), eye irritation increased significantly during the first 20–30 min of exposure compared to controls, after which a plateau was reached. Eye irritation during acrolein exposure was also reported in three older studies (Alarie, Citation1966; Esterbauer et al., Citation1991; Sim & Pattle, Citation1957). It is difficult to compare with those older results as exposures were very short (20 s to 10 min) and at much higher levels (0.8, 1.2, 5.5, and 22 ppm). The development of sensory irritation over time is complex, with time effects sometimes disappearing, or even reversing, after a relatively short period, depending on the test compound. Nevertheless, sensory irritation generally depends more on the concentration and less on the exposure duration, at least within relevant time frames (from several minutes and longer) (Shusterman et al., Citation2006). This is partly supported by our experiment which suggests a marginal increase in the rating of eye irritation after 3 min compared to pre-exposure ratings (). However, these ratings continue to increase especially during the first hour of exposure to acrolein. Similarly, Weber-Tschopp et al. (Citation1977) reported increased eye irritation during the first 20–30 min of exposure to 0.3 ppm of acrolein, whereafter a plateau was reached. More detailed studies are needed to clarify the time dependency of perceived irritation.
Blink frequency, another measure of eye irritation, was significantly higher during the last 20 min compared to the first 20 min of acrolein exposure (0.1 ppm) in the present study. This was not observed for any of the other five exposure conditions. However, it is difficult to interpret the result of the blink frequency measurement in this study. It seems that the combined exposures disturb the effect of blink frequency in comparison with single acrolein exposures (). Significantly increased blink frequency during exposure to acrolein was also reported by Weber-Tschopp et al. (Citation1977), although at a higher exposure level (0.26 ppm).
In our study the majority of the subjects were young (average age 24 years). Young people generally have a more robust eye tear film, thus possibly less sensitive to irritants than older people.
Regarding nasal irritation no significant effect in ratings or objective measures in the pilot or main study was found. Weber-Tschopp et al. (Citation1977) reported that nasal irritation was significantly higher compared to controls beginning at 0.26 ppm after exposure gradually increasing concentrations of acrolein up to 0.6 ppm and after 20–30 min of constant exposure to 0.3 ppm of acrolein (the experiments are further described above). Nasal irritation was also reported in three older studies (Alarie, Citation1966; Esterbauer et al., Citation1991; Sim & Pattle, Citation1957), although at much higher exposure levels. In line with previous findings (Doty et al., Citation2004), eye irritation is clearly more prominent than nose irritation in our study.
No subjective throat irritation was found in the main study with highest exposure level of 0.1 ppm acrolein. However, the quantile regression analysis suggested a dose-effect relation in the pilot study using concentrations up to 0.3 ppm, in agreement with Weber-Tschopp et al. (Citation1977) who also found throat irritation at 0.3 ppm. Objective airway measurements did not show any exposure-related effect in exposure levels up to 0.1 ppm of acrolein. Weber-Tschopp et al. (Citation1977) found a decrease in the average respiration rate (in 16 subjects) after 40 min of constant exposure to 0.3 ppm of acrolein.
The quantile regression analysis further revealed a positive association between eye irritation and the inflammatory marker SAA in the volunteers with the highest ratings of irritation (). This suggests an up-regulation of the SAA response to acrolein in sensitive subjects. Exposure to acrolein has previously been shown to up-regulate SAA in mice (Conklin et al., Citation2011). The effect could be mediated by the receptor TRPA1 which mediates the inflammatory response to environmental irritants such as acrolein (Bautista et al., Citation2006). TRPA1 has been shown to have genetic variations (3–4 haplotypes) (Kim et al., Citation2006) which might explain the variation in ratings among the volunteers in the present study.
In this study, the biomarkers in induced sputum (total cell numbers, differential count, IL-6, and IL-8) were chosen to evaluate if acrolein at the highest concentration induces an airway inflammation. Previous studies have shown that smokers have increased number of cells and especially neutrophils and cigarette smoke contains acrolein. IL-8 is a chemoattractant for neutrophils and is increased in both upper and lower airways of smokers. IL-6 is a pro-inflammatory cytokine that also increase in the airways in connection to an inflammatory stimulus. Since acrolein has high water solubility we could have chosen to measure biomarkers in nasal lavage fluid. However, in our experience, inflammatory markers in nasal lavage have a huge variability, making the method unsuitable to detect mild inflammation.
In conclusion, the present study showed minor subjective eye irritation at short-term exposure to acrolein at 0.1 ppm with no such effect observed at 0.05 ppm. Our findings are in agreement with the study by Weber-Tschopp et al. (Citation1977) who found a significant increase in eye irritation at 0.09 ppm. No effects on nasal swelling, pulmonary function, or inflammatory markers were seen at these exposure levels.
Acknowledgements
We are indebted to Mrs Lena Possne for technical assistance during exposure, Dr Britt-Marie Sundblad for sputum induction tests and Jie Ji for analysis of inflammatory markers.
Declaration of interest
The authors report no conflict of interest. The authors alone are responsible for the content and writing of this article. This research has been funded by grants from the Swedish Research Council for Health, Working Life and Welfare (FORTE, no 2013-0044), and the Heart and Lung Foundation (grant nos. 20120376 and 20120818).
Related Research Data
References
- Alarie Y. (1966). Irritating properties of airborne materials to the upper respiratory tract. Arch Environ Health 13:433–49
- Azuma K, Uchiyama I, Ikeda K. (2007). The risk screening for indoor air pollution chemicals in Japan. Risk Anal 27:1623–38
- Bautista DM, Jordt SE, Nikai T, et al. (2006). TRPA1 mediates the inflammatory actions of environmental irritants and proalgesic agents. Cell 124:1269–82
- Beauchamp RO, Jr. Andjelkovich DA, Kligerman AD, et al. (1985). A critical review of the literature on acrolein toxicity. Crit Rev Toxicol 14:309–80
- Bottai M, Cai B, McKeown RE. (2010). Logistic quantile regression for bounded outcomes. Stat Med 29:309–17
- Brook RD, Rajagopalan S, Pope CA III, et al. (2010). Particulate matter air pollution and cardiovascular disease: an update to the scientific statement from the American Heart Association. Circulation 121:2331–78
- CICAD. (2002). CICAD. Concise International Chemical Assessment Document (Acrolein). Geneva: World Health Organization. 43 p
- Conklin DJ, Prough RA, Juvan P, et al. (2011). Acrolein-induced dyslipidemia and acute-phase response are independent of HMG-CoA reductase. Mol Nutr Food Res 55:1411–22
- Cotes JE, Chinn DJ, Reed JW. (1997). Lung function testing: methods and reference values for forced expiratory volume (FEV1) and transfer factor (TL). Occup Environ Med 54:457–65
- Doty RL, Cometto-Muniz JE, Jalowayski AA, et al. (2004). Assessment of upper respiratory tract and ocular irritative effects of volatile chemicals in humans. Crit Rev Toxicol 34:85–142
- Ernstgård L, Iregren A, Juran S, et al. (2009a). Acute effects of exposure to vapours of standard and dearomatized white spirits in humans. 2. Irritation and inflammation. J Appl Toxicol 29:263–74
- Ernstgård L, Iregren A, Sjögren B, et al. (2006a). Acute effects of exposure to vapours of acetic acid in humans. Toxicol Lett 165:22–30
- Ernstgård L, Iregren A, Sjögren B, et al. (2006b). Acute effects of exposure to vapours of dioxane in humans. Hum Exp Toxicol 25:723–9
- Ernstgård L, Iregren A, Sjögren B, et al. (2006c). Acute effects of exposure to hexanal vapors in humans. J Occup Environ Med 48:573–80
- Ernstgård L, Lind B, Johanson G. (2009b). Acute effects of exposure to vapours of standard and dearomatized white spirits in humans. 1. Dose-finding study. J Appl Toxicol 2:255–62
- Ernstgård L, Sjögren B, Johanson G. (2012). Acute effects of exposure to vapors of hydrogen peroxide in humans. Toxicol Lett 212:222–7
- Esterbauer H, Schaur RJ, Zollner H. (1991). Chemistry and biochemistry of 4-hydroxynonenal, malonaldehyde and related aldehydes. Free Radic Biol Med 11:81–128
- Faroon O, Roney N, Taylor J, et al. (2008a). Acrolein environmental levels and potential for human exposure. Toxicol Ind Health 24:543–64
- Faroon O, Roney N, Taylor J, et al. (2008b). Acrolein health effects. Toxicol Ind Health 24:447–90
- Ghilarducci DP, Tjeerdema RS. (1995). Fate and effects of acrolein. Rev Environ Contam Toxicol 144:95–146
- Grafström RC, Sundqvist K, Dypbukt JM, Harris CC. (1987). Pathobiological effects of aldehydes in cultured human bronchial cells. IARC Sci Publ 84:443–5
- IARC. (1995). Acrolein. IARC Monogr Eval Carcinog Risks Hum 63:337–72
- Kehrer JP, Biswal SS. (2000). The molecular effects of acrolein. Toxicol Sci 57:6–15
- Kim H, Mittal DP, Iadarola MJ, et al. (2006). Genetic predictors for acute experimental cold and heat pain sensitivity in humans. J Med Genet 43:e40
- Lang I, Bruckner T, Triebig G. (2008). Formaldehyde and chemosensory irritation in humans: a controlled human exposure study. Regul Toxicol Pharmacol 50:23–36
- Logue JM, Small MJ, Stern D, et al. (2010). Spatial variation in ambient air toxics concentrations and health risks between industrial-influenced, urban, and rural sites. J Air Waste Manag Assoc 60:271–86
- Miller MR, Hankinson J, Brusasco V, et al. (2005). Standardisation of spirometry. Eur Respir J 26:319–38
- Nagata Y. (2003). Measurement of odor threshold by triangle odor bag method. International Symposium on Odor Measurement. Asian Network on Odor Measurement and Control. Japan Association on Odor Environment; Tokyo, Japan; 118–127
- Nihlén A, Löf A, Johanson G. (1998). Controlled ethyl tert-butyl ether (ETBE) exposure of male volunteers II. Acute effects in humans. Toxicol Appl Pharmacol 148:281–7
- Paoletti P, Pistelli G, Fazzi P, et al. (1986). Reference values for vital capacity and flow-volume curves from a general population study. Bull Eur Physiopathol Respir 22:451–9
- Seaman VY, Bennett DH, Cahill TM. (2007). Origin, occurrence, and source emission rate of acrolein in residential indoor air. Environ Sci Technol 41:6940–6
- Shusterman D, Matovinovic E, Salmon A. (2006). Does Haber’s law apply to human sensory irritation? Inhal Toxicol 18:457–71
- Sierra LM, Barros AR, Garcia M, et al. (1991). Acrolein genotoxicity in Drosophila melanogaster. I. Somatic and germinal mutagenesis under proficient repair conditions. Mutat Res 260:247–56
- Sim VM, Pattle RE. (1957). Effect of possible smog irritants on human subjects. J Am Med Assoc 165:1908–13
- Strandberg K, Ek A, Palmberg L, et al. (2008). Fluticasone and ibuprofen do not add to the effect of salmeterol on organic dust-induced airway inflammation and bronchial hyper-responsiveness. J Intern Med: 83–94
- Swedish Work Environment Authority. (2011). Occupational exposure limits. AFS 2011:18
- Taylor G, Macneil AR, Freed DL. (1973). Assessing degree of nasal patency by measuring peak expiratory flow rate through the nose. J Allergy Clin Immunol 52:193–8
- Van Eeden SF, Tan WC, Suwa T, et al. (2001). Cytokines involved in the systemic inflammatory response induced by exposure to particulate matter air pollutants (PM(10)). Am J Respir Crit Care Med 164:826–30
- Weber-Tschopp A, Fischer T, Gierer R, et al. (1977). [Experimentally induced irritating effects of acrolein on men (author’s transl)]. Int Arch Occup Environ Health 40:117–30
- Weber A, Jermini C, Grandjean E. (1976). Irritating effects on man of air pollution due to cigarette smoke. Am J Public Health 66:672–6
- Wålinder R, Norbäck D, Wieslander G, et al. (1998). Nasal patency and biomarkers in nasal lavage-the significance of air exchange rate and type of ventilation in schools. Int Arch Occup Environ Health 71:479–86