
This issue of Ocular Immunology & Inflammation (OII) contains ten original, retrospective, clinic-based surveys reporting on various aspects of the demographic and clinical features of uveitis subjects seen in tertiary referral clinics in Chile,Citation1 Germany,Citation2 India,Citation3 Iran,Citation4 Japan,Citation5 Lebanon,Citation6 Saudi Arabia,Citation7 Singapore,Citation8 Thailand,Citation9 and Turkey.Citation10 Such retrospective studies of less common conditions like uveitis are valuable in that they provide important information that otherwise would be difficult to obtain using more robust, prospective epidemiologic methodologies – including data regarding regional differences and changes in patterns and prevalence of uveitis over time. Clinic-based studies also provide an opportunity to explore or probe possible associations between patient features on the one hand and disease progression and outcome on the other. As discussed below, these studies need to be designed and interpreted with careful attention to inherent analytic limitations.Citation11–15
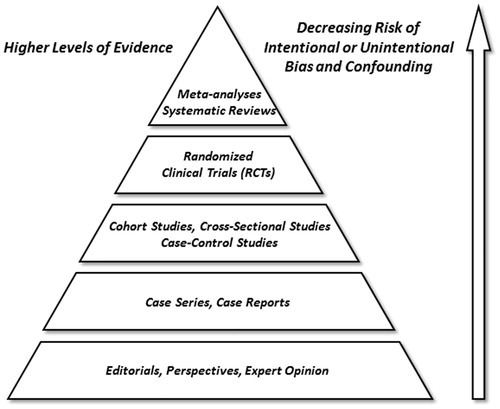
Clinical studies in uveitis vary substantially in size, design complexity, and cost. Tiered hierarchies, or pyramids, of clinical evidence have been proposed based on relative reliability and impact of various study types.Citation16–19 Such schemas generally place individual and aggregated randomized clinical trial (RCT) results at the top; cohort, cross-sectional, and case-control studies in the middle; and retrospective case series and single case reports toward the bottom of this evidence pyramid (). While methodologically quite robust regarding questions of therapeutic intervention, RCTs and prospective cohort studies are expensive, resource intensive, and often impractical, if not impossible, to perform - particularly in patients with uncommon conditions. Moreover, clinical questions exist for which well-designed cohort studies, case series, or even single case reports offer the best investigative approach.Citation20 Most often, in fact, there is a natural interdependence and evolution in the collection of clinical evidence from description, to identification of associations, and then to isolated and controlled testing of cause and effect. Dr. Lawrence Yannuzzi has illustrated these points eloquently in his editorial entitled “A case for the case report and case series in evidence-based management of retinal disease.”Citation21 To quote Dr. Yannuzzi, “… a case report not uncommonly leads to a case series, which becomes a pathway for incorporation of new ideas and observations in an evidence-based clinical setting for new medical diagnostics and interventional forms of treatment …. [In fact,] the introduction of new technology [in ophthalmology] has seldom been subjected to a trial for use in the clinical setting. Once developed, it is usually presented in the format of a case report, published, tested and, if useful, adopted. While not situated at the pinnacle of the evidence pyramid, [retrospective studies] can be the first and only line of evidence for these new observations, ideas, and concepts.” Such has been the norm for many areas of medicine, and particularly so for the heterogeneous group of disorders known collectively as uveitis, where much of what we know has come from clinic-based studies, case series, and case reports.Citation22–25
FIGURE 1. Evidence-based medicine pyramid.
Bias in clinical research refers to a methodological error that results when any characteristic of the investigator, clinical site, study population, or study conduct interferes in a systematic way with the ability to accurately measure or interpret an outcome of interest.Citation11–15 Major potential sources of systematic error encountered in retrospective clinical studies include referral bias, selection bias, treatment bias, evaluator bias, and, publication bias. Here, the biases most relevant to clinic-based studies are the setting, patient source, and management approaches for each clinic – hence referral, selection and treatment biases.
Confounding, in contrast, occurs when an association between an occurrence, such as an exposure or clinical characteristic, and an outcome is erroneously assumed to be causal due of the unrecognized influence of a third, uncontrolled factor related to both the occurrence and the outcome. Examples here might include the inference that the possession of matches is causally associated with the development of lung cancer, or that the number of visits to the uveitis clinic is causally associated with worse outcomes, when, in fact, smoking and disease severity, respectively, are the associations of causal relevance. For this reason, factors that might confound an outcome of interest should be balanced across the analyses by either matching or stratification, or controlled for using mathematical modeling, such as multiple regression. Randomization avoids indication-for-treatment bias and mitigates unrecognized confounding (more so if the sample size is large), whereas evaluator biases can be avoided in both randomized and non-randomized studies by masking. In prospective comparator trials, up to two or three important known confounding factors can be controlled for by stratification at enrollment – although this is rarely required for large RCTs where recognized and unrecognized confounded tend to be assigned evenly to the treatment groups. Referral and selection bias are difficult to control for in all clinic-based studies, including RCTs. In fact, selection bias can actually be exaggerated in RCTs - at least with regard to application of the final results to the general population – due to use of stringent inclusion and exclusion criteria that may produce a study population quite different from patients encountered in routine clinical practice. We encourage all those who submit manuscripts to OII to summarize potential sources of bias and, when bivariate analyses are performed, to specifically discuss cross-comparator balance of factors with the potential to influence outcomes of interest.
Whereas RCTs are almost always experimental and intended to test the effect of a single treatment, procedure or program over time, clinic-based studies, case series, and case reports tend to be descriptive and cross-sectional, often with the added goal of exploring the strength of possible associations between demographic and clinical features. A potential, yet avoidable, error in clinical studies is the failure to analyze eye-related findings or outcomes properly by eye – an error that can take two forms. The first is the simple error of calculating the prevalence or incidence of eye-related findings on a per-patient, as opposed to per-eye, basis. Here, since a given patient may have different findings in each eye, the per-eye basis is typically the correct analysis. The second, more nuanced, error occurs when exploring associations and relates to the fact that while the findings in the two eyes of a given patient may differ, as noted above, they tend more often to be alike or correlated; i.e., not independent. This is important since failure to correct for fellow eye correlation tends to exaggerate statistical differences, which typically assume independence of the observations. As stated simply by Holopigian and Bach, “adding the fellow eye data [without correction] can nearly be the same as duplicating each data point.”Citation11 Such effects can be further amplified by studying both eyes in multiple family members, where there is potential for both intra- and inter-subject correlation. One way to deal with the issue of fellow eye correlation is to use only one eye, say the more severely affected eye, from each subject. Another way to address the issue, only relevant for continuous data, is to average the data from the two eyes when both are used in the analysis. However, both of these approaches, while simple, sacrifice statistical power by ignoring some available data. The most mathematically efficient way of dealing with fellow eye correlation is with statistical methods that adjust for correlation using mathematical models based on patient-specific data. Such models can be thought of as variably penalizing statistical precision based on the degree of correlation observed between eyes in the data set. Most statistical software packages have simple means of implementing such a procedure for the major forms of regression used in clinical studies.
An additional analytical error to be avoided in clinical studies involves failure to correct p-values when multiple bivariate comparisons are made and, related to this, inferring ‘statistical significance’ from one or more uncorrected p-values that happen to be less than or equal to 0.05 - a form of “Type 1” error. Some have referred to this problem as ‘p-hacking,’ or ‘fishing for significance,’Citation12 since the probability of such an error increases well beyond 5% as the number of comparisons increase. This issue can be addressed in exploratory analyses or studies by acknowledging the number of “false positives” likely to have been observed with a Type 1 error probability of 0.05.Citation25 Even more problematic is whether an appropriately corrected and, by inference, ‘statistically significant’ p-value of 0.05 reflects a clinically meaningful outcome, which is particularly relevant in the interpretation of large studies with relatively small effects.Citation25–27 Conversely, it is also an error to incorrectly infer absence of an association from a study with too few subjects; i.e., “Type 2” error, where a real difference is overlooked because of inadequate power to detect it. Type 2 errors are particularly prevalent when reporting safety of relatively uncommon adverse events, where the tendency is to declare a given treatment or intervention ‘safe’ based on too few subjects. Here, ‘the rule of three’ provides good general guidance: if none of ‘n’ subjects has the adverse event in question, then one can be reasonably (∼95%) confident that the true rate of this event in the population is no more than 3 over n (3/n).Citation28 Hence, with 300 subjects, one can be roughly 95% confident that no more than 3/300 (1%) in the population to which the results are to be generalized have the outcome or adverse event of interest, whereas for a sample of 30 this confidence limit estimate increases to about 10% and for a cohort of six it rises to 50%. For this reason, we encourage authors to report point estimates, such as the proportion of patients with an adverse event or treatment success, together with 95% confidence intervals.
Occasionally, subjects in retrospective, non-randomized studies are followed longitudinally over time and their course and/or response to various interventions or treatments are either tracked or compared in an attempt to infer trends or causality; i.e., “cohort study.” Such approaches present additional analytic challenges,Citation11–15 the most important of which is the issue of variable and/or incomplete follow up. Here, the common, and often incorrect, tendency is to report the proportion of patients with a given finding, complication, or visual acuity at a convenient, historically defined time – typically presentation and last visit. While such approaches are fine if findings at presentation are representative of symptom or disease onset, or when there is complete and comparable follow up, such strict criteria are rarely satisfied in retrospective studies. It should be acknowledged, therefore, that the study results may have been biased by variable time and treatment from disease onset to presentation, and analyses of occurrences over time should take patient-specific or eye-specific length of follow up into account. This latter goal can be achieved by using event rates expressed as events per person (or eye)-year, most appropriate when the rate is assumed to be constant over the period of interest, or by using a life-table or Kaplan-Meier approach. Kaplan-Meier curves are best applied to changes in visual acuity by reporting the proportion of patients to reach a clinically important threshold, such as 20/50 (6/15) or worse or 20/200 (6/60) or worse, or of those who experience what is acknowledged to be a clinically meaningful three-line loss or improvement in vision. Of note, events commonly of interest in uveitis, such as visual acuity and activity of inflammation, are not necessarily irreversible as survival analysis methods might imply, and so mistakes can be made if vision loss event rates are used as surrogates for the number of patients (or eyes) likely to reach a given functional status, such as disability, since isolated event rates assume no possibility of recovery.
Because all clinical research has potential biases, and since there is no statistical method to “adjust” for these systematic effects, it is important for investigators to conduct sensitivity analyses to determine whether the qualitative results of the study would have differed assuming alternate, yet plausible, scenarios. For instance, if a uveitis study shows better outcomes for the subgroup of patients treated with immunosuppression, this result may well be “real” since immunosuppressive therapy should be beneficial, but the treatment effect also might be understated since such agents tend to be given to the more severe cases in the cohort. Similarly, if a clinician is well-known as an expert in a certain disease, his or her practice population is likely to be enriched for patients with that condition and so overall outcomes may be biased toward outcomes more typical of that disease. In these specific instances, subgroup sensitivity analyses using baseline severity and etiology, respectively, might help address the relative contribution of various factors.
Last, while it can be difficult or impossible to harmonize data collected prior to 2005, we would encourage investigators to do their best to utilize the now widely accepted and standardized uveitis nomenclature when codifying various uveitis entities, and when describing both the visual acuity and the onset, duration, course, location, severity and overall activity of intraocular inflammation.Citation29,Citation30 Such efforts will facilitate both individual study interpretation and allow for more meaningful cross-study comparisons.
We thank the authors for choosing to publish their findings in OII and invite our readers to examine, with an epidemiologically enlightened eye, the relevance of these findings for their own practice and patients.
AcknowledgEments
Supported in part by The Pacific Vision Foundation (ETC), The San Francisco Retina Foundation (ETC), the Harold G. Scheie Teaching and Research Fund (Philadelphia, PA, USA [JHK]), Research to Prevent Blindness (New York, NY, USA [JHK]), the Paul and Evanina Mackall Foundation (New York, NY, USA [JHK]), and the Lois Pope Life Foundation (New York, NY, USA [JHK]).
References
- Liberman P, Gauro F, Berger O, Urzua CA. Causes of uveitis in a tertiary center in Chile: a cross-sectional retrospective review. Ocul Immunol Inflamm. 2015;23
- Grajewski RS, Caramoy A, Frank KF, et al. Spectrum of uveitis in a German tertiary center: review of 474 consecutive patients. Ocul Immunol Inflamm. 2015;23
- Ganesh S, Bala A, Ahmed A, et al. Pattern of padiatric uveitis seen at a tertiary referral center from India. Ocul Immunol Inflamm. 2015;23
- Kianersi F, Mohammadi Z, Ghanbari H, et al. Clinical patterns of uveitis in an Iranian tertiary eye-care center. Ocul Immunol Inflamm. 2015;23
- Nakahara H, Kaburaki T, Takamoto M, et al. Statistical analyses of endogenous uveitis patients (2007–2009) in central Tokyo area and comparison with previous studies (1963–2006). Ocul Immunol Inflamm. 2015;23
- Abdulaal M, Antonios R, Barikian A, et al. Etiology and clinical features of ocular inflammatory diseases in a tertiary center in Lebanon. Ocul Immunol Inflamm. 2015;23
- Al Dhahri H, Al Rubaie K, Hemachandran S, et al. Patterns of uveitis in a university-based tertiary referral center in Riyadh, Saudi Arabia. Ocul Immunol Inflamm. 2015;23
- Mi H, Ho SL, Lim WK, et al. Trends in patterns of posterior uveitis and panuveitis in a tertiary institution in Singapore. Ocul Immunol Inflamm. 2015;23
- Silpa-Archa S, Noonpradej S, Amphornphruet A. Pattern of uveitis in a referral ophthalmology center in the central district of Thailand. Ocul Immunol Inflamm. 2015;23
- Nalcacioglu-Yuksekkaya P, Ozdal PC, Yazici A, Tirhis H. Clinical and demographic characteristics of patients with uveitis starting later in life. Ocul Immunol Inflamm. 2015;23
- Jabs DA. Clinical research in uveitis. In Zierhut M, Pavesio C, Ohno S, Orefice F, Rao N (eds), Intraocular Inflammation. Chapter 7, Springer: London; 2015:113–126
- Thompson JT. Three kinds of lies. Am J Ophthalmol. 2014;121:1315–1316
- Kempen JH. Appropriate use and reporting of uncontrolled case series in the medical literature. Am J Ophthalmol. 2011;151:7–10.e1
- Holopigian K, Bach M. A primer on common statistical errors in clinical ophthalmology. Doc Ophthalmol. 2010; 121:215–222
- Jabs DA. Improving the reporting of clinical case series. Am J Ophthalmol. 2005;139:900–905
- Wang JJ, Attia J, Evans J. Study designs in epidemiology and levels of evidence. Am J Ophthalmol 2010;149:367–370
- Evans J. Evidence-based reviews and meta-analysis. Am J Ophthalmol 2010;149:701–703
- Patsopoulos NA, Analatos AA, Ioannidis JP. Relative citation impact of various study designs in the health sciences. JAMA. 2005;293:2362–2366
- Guyatt GH, Sackett DL, Sinclair JC, et al. Users’ guides to the medical literature. IX. A method for grading health care recommendations. Evidence-Based Medicine Working Group. JAMA. 1995;274:1800–1804
- Kempen JH, Daniel E, Gangaputra S, et al. Methods for identifying long-term adverse effects of treatment in patients with eye diseases: the Systemic Immunosuppressive Therapy for Eye Diseases (SITE) cohort study. Ophthalmic Epidemiology 2008;15:47–55
- Yannuzzi LA. A case for the case report and case series in evidence-based management of retinal disease. Retin Cases Brief Rep. 2011; 5:97–103
- Thorne JE. Weighing the evidence: evaluating contributions from case reports and case series. Retin Cases Brief Rep. 2012;6:337–338
- Schachat AP. Case reports and small case series: some comments and prejudices. Retin Cases Brief Rep. 2011;5:273–274
- Liesegang TJ. The role and preparation of case reports: resident education. Retin Cases Brief Rep. 2011;5:181–183
- Wang R, Lagakos SW, Ware JH, et al. Statistics in medicine–reporting of subgroup analyses in clinical trials. N Engl J Med. 2007;357:2189–2194
- Siontis GC, Ioannidis JP. Risk factors and interventions with statistically significant tiny effects. Int J Epidemiol. 2011;40:1292–1307
- Sun X, Ioannidis JP, Agoritsas T, et al. How to use a subgroup analysis: users’ guide to the medical literature. JAMA. 2014;311:405–411
- Schachat AP, Chambers WA, Liesegang TJ, Albert DA. Safe and effective. Ophthalmology 2003;110:2073–2074
- Jabs DA, Nussenblatt RB, Rosenbaum JT; Standardization of Uveitis Nomenclature (SUN) Working Group. Standardization of uveitis nomenclature for reporting clinical data. Results of the First International Workshop. Am J Ophthalmol. 2005;140:509–516
- Jabs DA, Busingye J. Approach to the diagnosis of the uveitides. Am J Ophthalmol. 2013;156:228–236