
Abstract
Purpose: Trachoma control programs are underway in endemic regions worldwide. They are based on the SAFE strategy (Surgery for trichiasis, Antibiotic distribution, Facial cleanliness, and Environmental improvement). Although much is known about the effect of community-wide treatment with antibiotics on the prevalence of Chlamydia trachomatis, the impact of the SAFE strategy on severe ocular disease sequelae (the main focus of the Global Elimination of blinding Trachoma by 2020 program) remains largely unknown.
Methods: We use a mathematical model to explore the impact of each of the components of the SAFE strategy, individually and together, on disease sequelae, arising from repeat infection and subsequent conjunctival scarring. We ask whether two elimination goals, to reduce the prevalence of trachomatous trichiasis to 1 per 1000 persons, and the incidence of corneal opacity to 1 per 10,000 persons per annum, are achievable, and which combinations of interventions have the greatest impact on these indicators.
Results: In high prevalence communities (here, >20% infection of children aged 1–9 years), a combination of efforts is needed to bring down sustainably the prevalence and incidence of ocular disease sequelae.
Conclusion: The mass delivery of antibiotics is highly beneficial for the clearance of infection, inflammation and prevention of subsequent scarring, but needs to be supplemented with sustained reductions in transmission and surgery to consider realistically the elimination of blindness by the year 2020.
Introduction
Trachoma remains the world’s leading infectious cause of blindness. In 2003, the World Health Organization (WHO) estimated that 84 million people had active disease (an inflammatory conjunctivitis) that could lead to visual impairment, and that 7.6 million were severely visually impaired or blind as a result of trachoma.Citation1 Recently revised estimates have halved the number of people with active trachoma, probably due to the collection of more accurate data since the introduction of the SAFE strategy (Surgery for trichiasis, Antibiotic treatment of the causative bacteria Chlamydia trachomatis, Facial cleanliness, and Environmental improvement),Citation2 the success of SAFE implementation, and socioeconomic improvements in endemic areas.Citation3 Yet, the number of people with trichiasis (inward turning of eyelashes causing corneal damage that will ultimately lead to blindness) is currently about 8.2 million.Citation3
The WHO’s simplified grading schemeCitation4 discriminates follicular and inflammatory trachoma (TF and TI, respectively). With repeated ocular chlamydial infection, episodes of inflammation lead to a scarring immunopathological response, defined as trachomatous scarring (TS).Citation4 Further inflammation leads to worsening of scarring that may turn the eyelid inward and cause eyelashes to abrade the corneal surface (trachomatous trichiasis, TT). If trichiasis is not treated through surgical intervention, the eye may become irreversibly damaged leading to corneal opacity (CO) and eventually blindness.
Mass drug administration (MDA) programs, using the antibiotic azithromycin, are part of the SAFE strategy (the “A” component). The International Trachoma Initiative (ITI) estimates that by 2015 MDA programs will be active in 42 countries.Citation5 Recently, the London Declaration on Neglected Tropical Diseases (endorsed on 30 January 2012), pledged to support efforts to help eliminate blinding trachoma by the year 2020.Citation6 Because the time between the administration of treatment and its observed effects on disease (and, in particular, trichiasis and CO) can be very long, mathematical models can provide valuable tools for predicting the long-term effects of treatment and for assessing the feasibility of the 2020 goals. In previous papers,Citation7 we have shown that relatively simple mathematical models reproduce adequately many of the qualitative and quantitative patterns of infection and disease observed in trachoma-endemic communities prior to the introduction of MDA.
This paper investigates the effects of perturbing the model through simulated treatment schedules to ascertain (1) what effect these control interventions might have on ocular disease, (2) whether the Global Elimination of blinding Trachoma by 2020 (GET2020) program goals are achievable, and (3) how long these goals might take to achieve.
Materials and Methods
Since the goals set by the WHO GET2020 alliance primarily concern the elimination of prevalent cases of TT (and, formerly, incident cases of CO), as well as a reduction in the prevalence of active trachoma (TF, TI),Citation8 it was necessary to construct a mathematical model that explicitly included the progress of individuals to such disease sequelae.
The model presented by Gambhir and co-authors,Citation7 fitted to age-stratified prevalence data of TS and TT for the high prevalence setting of Kongwa, Tanzania, described by West and colleagues,Citation9 was used as the basis from which to investigate the treatment schedules explored in this paper. Details of the model structure and the values of the parameters are given in the Supplemental Appendix (available online only). The model used here is similar in structure to that published by Lietman and co-workers,Citation10 and is based on the simple susceptible-infected-susceptible framework; here, however, the infection transmission mechanism is simplified to allow for an additional model feature, namely the path individuals take to the development of disease sequelae. We considered a treatment naive high-prevalence setting to be a reliable source of data for the prevalence of disease sequelae since in such a setting the influence of environmental or socioeconomic secular trends will have been minimal, and it is reasonable to assume that infection dynamics were at equilibrium, allowing us to clearly associate infection transmission with disease sequelae.
Using estimated transmission parameters from this high prevalence setting (>20% infection of children aged 1–9 years), we simulated the administration of multiple antibiotic annual treatment rounds to populations whose initial infection prevalence level was high. We examined the impact of MDA alone, and a combination of surgery, MDA and “transmission reduction,” on each of the disease sequelae prevalence levels, with host age and time, and the impact of these interventions on the incidence of severe disease sequelae. We refer to the third of the interventions we tested as “transmission reduction” rather than F&E since the effectiveness of F&E is not well understood and we wanted to prevent readers from conflating our simulated intervention with F&E. It is likely that F&E (and, indeed, Water, Sanitation and Hygiene; WASH) interventions would be modeled as “transmission reduction,” but the disease modeling community awaits further evidence before making this link more explicit.
Model and Assumptions
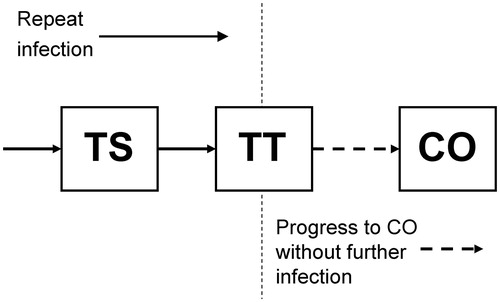
The mathematical framework of our model has previously been described in detail,Citation7 its prototype having been presented by Gambhir and co-authors. Briefly, the model is based on the process of ocular reinfection of individuals with C. trachomatis as they come into contact with others who are infected. Progressive conjunctival fibrosis/scarring (TS) is believed to be initially caused by recurrent C. trachomatis infection. However in the late stages of the disease, other stimuli such as non-chlamydial bacterial infection, may also contribute to this inflammatory-cicatricial process.Citation11 Members of the population eventually accumulate threshold numbers of infection episodes, and these thresholds are interpreted as points beyond which individuals show signs of the disease sequelae TS and TT. The third, and more severe disease sequela, CO, has a different etiology, which we model by assuming that once individuals show signs of TT, mechanical damage of the cornea will gradually cause them to progress to CO, regardless of whether they continue to be infected ().
FIGURE 1. Trachoma disease model diagram. Compartmental disease model based on the ladder of infection framework of Gambhir and colleaguesCitation7 with an extension to take into account development of corneal opacities (CO) from the population of those who previously developed trachomatous scarring (TS) and then trichiasis (TT). The disease states TS and TT are developed through repeat infection, but development of CO is not linked to further infection and occurs at a constant rate as a consequence of mechanical corneal damage incurred by those with TT (see Supplemental Appendix for model parameters).
The rate of recovery of individuals from an episode of infection increases with age,Citation12 and the model includes this more rapid recovery by postulating its cause as the increasingly rapid clearance of each successive infection.Citation13 Additionally, the infectivity of individuals is assumed to be proportional to the bacterial infection load they carry and this value drops with age, which is likely to be another consequence of acquired immunity.Citation14,Citation15 Model populations were parameterized by fitting the model to endemic infection and disease sequelae prevalence data from Kongwa, Tanzania. This model was also found to exhibit disease sequelae incidence rates that closely matched those published for this district.Citation16 Thus calibrated to the disease sequelae “steady-state,” we had a model that could be used to simulate control interventions. Mathematical details of the model are presented in the Supplemental Appendix.
Simulation of the Interventions Individually and Together
We first ran the model for a 200-year equilibration period to ensure a steady state was reached. We simulated control scenarios based on the transmission and disease parameters estimated from fitting the model to a high prevalence setting at baseline (Kongwa district, TanzaniaCitation7,Citation9). Each intervention component of the full strategy was simulated at a high, medium or low intensity of effort (as detailed in ). Antibiotic treatment (A), was simulated by shifting a proportion of the population in the infected classes to the closest susceptible classes according to an antibiotic efficacy of 95%,Citation17 and a therapeutic coverage level equal to 86% of the total population, which was the level achieved by the first MDA round in the high prevalence field study in Kongwa.Citation9 At the time of treatment, a population fraction given by efficacy × coverage had its bacterial carriage effectively reduced to zero. Each MDA round was conducted in successive years (and each set of three MDA rounds was conducted in successive 3-year periods). The simulation results were examined to determine the effect of antibiotic treatment on age-dependent prevalence and incidence levels of disease sequelae over the whole population. The “transmission reduction” intervention was simulated as an annual linear decrease in the transmission rate over such a period that the final transmission rate was 10% of its initial value (i.e. a high-endemicity setting had been transformed into a low-endemicity one). The rates of decrease were chosen so as to achieve this decline in transmission in 10, 20 or 30 years. The slowest-acting of the “transmission reduction” interventions might be interpreted as the rate associated with steady economic development and the resulting environmental improvement, an example of which occurred in the Gambia between the mid-1980s and the mid-1990s without concerted intervention.Citation18 The provision of surgery (S) for TT was simulated as a decrease in the number of cases of TT over time at a rate such that, from the onset of community surgery, the average amount of time an individual spends with TT would be 2, 5 or 10 years (ie, mean residence time in the TT disease state is 2, 5 or 10 years, the mid value of which is in line with current WHO guidelinesCitation1). Note that, while the population to whom surgery is provided no longer suffer from TT, they are still subject to the rest of the infection and recovery dynamics in the model. So, transmission of infection across the population is not affected by surgery. When these three interventions were implemented together (in pairs, or all three at once), the intensities of the interventions were combined like-with-like, so that interventions were implemented at a low level for all three component interventions (i.e. low S + low A + low “transmission reduction”). All seven possible intervention combinations are detailed in . The time taken to achieve the elimination or control goals was estimated by focusing on the two goals relating to the elimination of blinding trachoma; (1) reduction in the prevalence of TT to ≤1 case per 1000 persons, and (2) reduction in the number of incident cases of CO to <1 per 10,000 persons per annum,Citation8,Citation19 a previously codified goal for elimination, although this is now no longer a formal target due to the difficulty in estimating CO incidence in an endemic area. Life table estimates from the WHO for the year 2001 were used in the model for the age-specific death rates and the overall population birth rate for Tanzania.Citation20
TABLE 1. Trachoma treatment schedules implemented at three individual control interventions and three intensity levels. Each set of three simulated annual MDA rounds, for medium and high intensities of the antibiotic intervention, are conducted immediately following the previous three annual rounds.
TABLE 2. Global Elimination of blinding Trachoma by 2020 (GET2020) program goals and the implementation of components of the full intervention strategy individually and in concert. Each component of the full intervention strategy is implemented at a low, medium or high intensity, corresponding to the schedules detailed in . Outcome measures are stated here such that a value of 1.0 represents achievement of the GET2020 goals. The dark-shaded cells are those in which the GET2020 goals have been achieved and cells that are light-shaded correspond to schedules in which the goal is almost achieved (i.e. within 100% of the goal).
Table S1 from the Supplemental Appendix summarizes the variables and parameters of the model, provides their values when these were chosen from previous work or set to mimic different endemicity levels, and indicates which parameters were estimated by fitting the model to the data.
We also calculated the time course of the prevalence of TS, TT and CO and the incidence of CO for each of the interventions. Each of the interventions was implemented in populations that were initially in a high prevalence state for trachoma infection (>20% infection prevalence in children 1–9 yearsCitation21). The reason that we did not investigate the effect of these interventions on sequelae levels in medium- and low-endemicity settings (10–20%, or <10% infection prevalence, respectivelyCitation21) is because, in a steady state, the infection process is not sufficient to generate new cases of TT and CO in these lower endemic settings. However, it does appear to be the case that several currently low-endemicity regions were initially high-endemicity and, therefore, a higher prevalence than expected of disease sequelae may be found in these settings. Our intervention simulations mimic this effect by considering “transmission reduction” interventions on the high-endemicity population, which rapidly reduce infection but leave previously developed TS, TT and CO, and allow for the continuous generation of CO cases, which do not require further infection.
Results
Prevalence of Disease Sequelae Following Implementation of the Components of the Full Intervention Strategy Individually and in Combination
illustrates the impact on the age-dependent prevalence of disease sequelae of the three interventions selected from the full set described in and . The first of these () shows that the impact on prevalence of sustained antibiotic intervention alone, acting at a high intensity of control effort (three annual rounds of MDA followed by a further two sets of three annual rounds) is such that there is little change in prevalence; the transmission rate is too high and infection rebounds very rapidly following MDA, which in turn sustains a steady number of new cases of TS, TT and CO.
FIGURE 2. Response of trachoma disease sequelae prevalence to treatment. Simulated age-dependent prevalence of disease sequelae (trachomatous scarring [TS], dark blue lines [left]; trachomatous trichiasis [TT], light blue lines [middle]; and corneal opacities [CO], green lines [right]), in a high-endemicity trachoma setting at baseline, following three treatment schedules; (A) antibiotics (A) only, at high intensity; (B) A+ transmission reduction (TR) both at high intensity; (C) surgery (S) + A + TR all at high intensity. In each plot, the thicker lines represent baseline prevalence over age and each subsequent lower curve is plotted at 5-year intervals such that the bottom-most curves represent the prevalence levels 20 years after baseline. In (A), the markers indicate the prevalence values of TS, TT, and CO observed in Kongwa, TanzaniaCitation9 with error bars representing 95% confidence intervals of the collected dataset.
![FIGURE 2. Response of trachoma disease sequelae prevalence to treatment. Simulated age-dependent prevalence of disease sequelae (trachomatous scarring [TS], dark blue lines [left]; trachomatous trichiasis [TT], light blue lines [middle]; and corneal opacities [CO], green lines [right]), in a high-endemicity trachoma setting at baseline, following three treatment schedules; (A) antibiotics (A) only, at high intensity; (B) A+ transmission reduction (TR) both at high intensity; (C) surgery (S) + A + TR all at high intensity. In each plot, the thicker lines represent baseline prevalence over age and each subsequent lower curve is plotted at 5-year intervals such that the bottom-most curves represent the prevalence levels 20 years after baseline. In (A), the markers indicate the prevalence values of TS, TT, and CO observed in Kongwa, TanzaniaCitation9 with error bars representing 95% confidence intervals of the collected dataset.](/cms/asset/13bff604-a0fc-49f5-95db-2a529241ba4b/iope_a_1081249_f0002_c.jpg)
The combination of antibiotic MDA and “transmission reduction” (), each at a high level of intensity, reduces the transmission rate to 10% of its initial value in 10 years and effectively transforms the transmission setting from a level of high- to low-endemicity. However, the impact of this intervention takes years to become evident in the prevalence of scarring sequelae, and it is only 20 years after the cessation of the intervention that significant changes in the prevalence pattern are seen. However, when the entire strategy is deployed (), the prevalence of TT can be reduced to 0% in 20 years because surgery for trichiasis is also intensely implemented. The incidence of CO is also more rapidly reduced by the full strategy, but there is a delay in its reduction due to the slow disappearance (via any-cause mortality) of those cases of CO that arose prior to the intervention. Other than the surgery-induced large decline in TT prevalence shown in , the declines seen in sequelae prevalence levels are largely demographic; they occur as a consequence of natural mortality in populations with TS, TT and CO, since surgery is the only effective measure available to reverse progress toward more severe disease among individuals with TT.
Prevalence and Incidence of Disease Sequelae on Implementation of Interventions
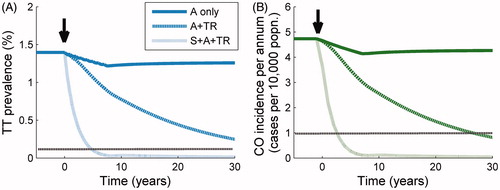
illustrates the population prevalence of TT and incidence of CO over time during and following the three selected treatment schedules that we used to project the prevalence profiles in . The small drop in these measures for the “antibiotic only” schedule (solid lines, ), in which nine annual MDA rounds are administered, creates a small but long-lasting decrease in both disease levels due to the decline in the number of new cases generated through infection, as well as the damage due to TT. This benefit of antibiotic administration should not be underemphasized since it will result in fewer cases of blindness and severe discomfort, but there will be a steady tendency to rebound (to pre-intervention levels) of both disease sequelae. The time course of the incidence of CO and the prevalence of TT following the initiation of the A + “transmission reduction” intervention (dashed line, ) is much more persistently downward, but it is not until surgery is added to the combination of interventions (dot-dashed line, ) that the prevalence of TT and incidence of CO is brought down sufficiently quickly to make achieving the GET2020 program goals by the year 2020 feasible.
FIGURE 3. Response of trachomatous trichiasis (TT) prevalence and corneal opacity (CO) incidence to treatment. Trend in: (A) prevalence of TT, and (B) incidence of CO through time following three treatment schedules initiated at 0 years (black arrow). From the uppermost to the bottom curve, the population is subjected to mass drug administration (MDA) at high intensity (dark solid line), MDA + transmission reduction (TR) both at high intensity (upper dark dotted line), and MDA + TR + surgery (S), all at high intensity (lower light dotted line). The horizontal dotted line represents the relevant threshold for the Global Elimination of blinding Trachoma by 2020 (GET2020) program goals (a level of one case of CO per 10,000 persons per annum, and a prevalence of one case of TT per 1000 persons).
Incidence of CO, Prevalence of TT and the GET2020 Program Goals
Results from a comprehensive exploration of the impact of each of the components of the full intervention strategy, individually and together, are given in . The outcome measures included in the table are those associated with the GET2020 program goals, namely the incidence of CO (persons per 10,000 per annum), and the prevalence of TT (as a percentage) 5, 10 and 20 years following the beginning of the interventions. Here, it can clearly be seen which control strategies employed alone or together result in the achievement of the GET2020 program goals. The strategy components and combinations that succeed are dark-shaded and those that bring sequelae levels very close to the goal (here quantified as a CO incidence of two persons per 10,000 per annum, or TT prevalence of two persons per 1000) are light-shaded. Several general trends can be seen; first, the inclusion of greater numbers of the intervention components leads more readily to the accomplishment of the (current or former) GET2020 program goals; second, the implementation of surgery is immensely important and, indeed, surgery is the intervention component that most surely results in the achievement of the sequelae-related goals when implemented alone; third, the TT goal is not quite as readily achieved as the CO goal, which is a consequence of the time delay in the drop in prevalence compared with incidence, resulting in the achievement of this goal taking longer than the year 2020 target.
Discussion
In this paper, we investigated the impact on TS and blinding disease sequelae of the components of a multi-pronged intervention strategy implemented at various degrees of control effort intensity, individually and together. In the absence of data on the long-term impact of treatment on these sequelae, mathematical models may provide helpful projections of treatment impact to help assess the feasibility of reaching the year 2020 goals.
Referring to the three questions we sought to answer at the beginning of this article, we find that: (1) Increased intensity of all interventions will more quickly positively impact ocular disease incidence and prevalence levels. Increased levels of surgery will most surely impact the indictors included in the GET2020 program goals. However, surgery alone is a stopgap measure, until transmission can be reduced and, once reduced, the impact on ocular disease of MDA is also enhanced. (2) The GET2020 program goals are still achievable in theory if all interventions are implemented simultaneously (and with the proviso that our “transmission reduction” intervention may not be easily implemented on the ground). (3) Under current intervention regimes and in high-transmission settings (i.e. in hyperendemic communities) the GET2020 program goals may be difficult to achieve sooner than around 20 years from now.
A few studies have observed declines in prevalence of infection and disease that have occurred either disproportionately with respect to the antibiotic treatment administered,Citation22,Citation23 or even entirely without antibiotics.Citation24 The elimination of ocular chlamydial infection from many countries in which it was previously endemic preceded the widespread use of antibiotic treatment for trachoma and was probably related to economic and infrastructural improvement.Citation25 The facial cleanliness (F) and environmental improvement (E) components of the SAFE strategy seek to lower the level of bacterial transmission so that antibiotic treatment has a greater impact, or the infection is driven to elimination without the need for antibiotics. We have shown that in high-endemicity settings, infection may rebound too quickly to give rise to a sustained reduction of the incidence of disease sequelae when antibiotic treatment is administered alone. In such cases, the S, F and E components of the SAFE strategy would appear to be crucial and could result in the local elimination of infection as well as a rapid reduction in the number of new cases of CO and blindness.Citation25 Our model does not explicitly include the F&E intervention, since little is known of its effectiveness in reducing population infection and disease. However, a recent meta-analysis of the available data for WASH interventions and their preventative impact on trachoma has found that a clean face is highly associated across many studies with the absence of TF.Citation26 Quantitative estimates of risk reductions such as these may be translated into changes in model parameters in future work that explicitly examines the F&E intervention. Background secular trends (e.g. non-programmatic environmental improvements, washing practices, and fly density reduction) would be similarly modeled.
The main GET2020 program goal, namely, the elimination of incident blindness as a result of trachoma by 2020,Citation1,Citation8,Citation19 is linked, in the model, to the interruption of the transmission of infection and the slowing down or stopping of progress along the ladder of infection, although we represent the path from TT to CO as a process with constant rate without the need for further infection. We find that the incidence of CO drops by around 20% of its initial value following nine annual MDA rounds (), and it is only after the transmission rate has been reduced very substantially and surgery for TT is intensely provided that these sequelae are no longer incident.
Model Limitations
The model implemented here is limited by its simplicity. First, it is deterministic, which precludes the possibility of investigating infection elimination, second, it assumes that contact between individuals is homogeneous between sexes, although not over ages, third, it does not take into account differences in transmission within and between households, a heterogeneity in transmission that has been shown to be important in trachoma epidemiology,Citation27 an issue investigated in a recent modeling study,Citation28 and fourth, the “transmission reduction” intervention was modeled as a linear decline in transmission and is not currently calibrated to published effectiveness levels, which remain very uncertain and are yet to be evaluated in highly-controlled study settings. This uncertainty is very important, since estimates of the time to achieve elimination under “transmission reduction” are strongly dependent on its effectiveness. We have accounted for this by performing time-to-elimination calculations over a range of “transmission reduction” effectiveness values, to allow readers to gain insight into the change in likelihood of elimination with increases in intensity of each intervention. The simplicity of the current model therefore limits investigations into the effects of targeted treatment (e.g. to children, or to households in which there is at least one case of active disease). Our simplified representation of trachoma natural history and, particularly, the abrupt threshold number of prior infections necessary to reach the disease states TS and TT, might also be modified in future work by associating a probability with the development of TS and TT over a range of infection levels, or by using a disease sequelae model closer to those used for helminth-induced disease, in which the population moves towards severe disease states, with a rate depending on the number of prior infections.Citation29 Fifth, the observed persistence of active disease following the elimination of infectionCitation11,Citation30 underscores the idea that repeat infection does not drive disease alone, and forecasting efforts will need to account for this. Finally, our results were obtained by fitting our model to data from Kongwa district, Tanzania, and our conclusions would be more robust if, in future work, we used the model fit to other data sets.
Policy Implications
The policy implications of the tabular summary of all intervention permutations () are clear; for communities with high infection prevalence at baseline, a combination of efforts is needed to bring down the prevalence and incidence of sequelae sustainably to achieve the GET2020 program goals. highlights the importance of surgery to create a pathway to achieving the 2020 goals. Previous studies have shown that MDA is beneficial for the clearance of inflammation and prevention of subsequent scarring, but we show here that it needs to be coupled with sustainable reductions in transmission (most likely through environmental and water and sanitation improvement) before the elimination of blinding disease due to trachoma can be considered realistically. For medium- and low-endemicity communities at baseline, the model generates far fewer new cases of TT and CO, and a combination of surgery to clear the backlog of TT cases and antibiotics to clear infection may be enough to eliminate blindness. This conclusion is also implied by , since the aim of a “transmission reduction” campaign is to change permanently the conditions propitious for a highly-endemic setting into those of a low-endemic (or non-endemic) setting. Our model suggests that antibiotics can reduce trachoma in communities such as Kongwa, but a secular trend will be necessary to keep it from returning. Summaries of the potential impact of interventions such as those provided in , may prove very useful for program managers to optimize their decisions at the beginning or during interventions, particularly in resource-constrained settings, where careful consideration needs to be given to those interventions or combinations thereof which will provide the best value for money. Similar model-based analyses have allowed the systematic exploration of combining existing malaria control interventions (i.e. in the absence of an effective vaccine)Citation31 which is now a cornerstone of the debate on malaria elimination. Such summaries of the paths to elimination will need to be accompanied by health-economic analyses in future work to obtain greater clarity of the relative cost-benefits and cost-effectiveness of the strategies, and therefore the overall effort necessary to implement each of the interventions simulated here. In addition to studies conducting scenario analyses, important next steps would be to fit mathematical models to post-intervention longitudinal data, once sufficient data have been collected, as well as extend the complexity of models to allow for population immigration and the inclusion of regions of differing endemicity (as have Lietman and colleaguesCitation10).
In conclusion, trachoma disease sequelae will continue to develop in the years to come, particularly in highly endemic regions, and so there is a need for the ongoing provision of services, such as surgery for trichiasis, even when the prevalence of active disease is dropping. Evidence for the effectiveness of the F&E intervention is needed to allow transmission reduction to be achieved with greater certainty than is currently possible. The GET2020 program goals may yet be achievable, but unless infection can be eliminated with mass antibiotics, then a substantial and sustained effort will be required to provide surgery and continue implementing all components of the SAFE strategy.
Supplemental Material Supplemental data for this article can be accessed on the publisher’s website.
Appendix
Download MS Word (130.5 KB)Acknowledgments
At the International Trachoma Initiative, we thank the former staff members, Jacob Kumaresan, Felicity Turner, Ibrahim Jabr, and Danny Haddad, and the current Research Director Huub Gelderblom, for their very valuable support.
The study did not require IRB approval due to its anonymous nature and dependence on previously published data.
Declaration of interest
The authors report no conflicts of interest. The authors alone are responsible for the content and writing of the paper.
The International Trachoma Initiative (ITI) financed the initial development of the trachoma models presented here. NCG acknowledges the Royal Society for a University Research Fellowship, and the Medical Research Council, UK, for Centre funding support. MJB thanks the Wellcome Trust for a fellowship [Grant No: 098481/Z/12/Z]. M-GB thanks the Wellcome Trust and the Royal Society for project grants in neglected tropical diseases. The field studies used to develop the model were supported by a Wellcome Trust-Burroughs Wellcome Fund grant to DCM and RLB [Grant No. 052134]. The funders had no role in study design, data collection and analysis, decision to publish, or preparation of the manuscript.
References
- WHO. Prevention of blindness and visual impairment: Trachoma. 2009. Accessed June 25, 2009 from: http://www.who.int/blindness/causes/trachoma/en/index.html
- Kuper H, Solomon AW, Buchan J, et al. A critical review of the SAFE strategy for the prevention of blinding trachoma. Lancet Infect Dis 2003;3:372–381
- Mariotti SP, Pascolini D, Rose-Nussbaumer J. Trachoma: global magnitude of a preventable cause of blindness. Br J Ophthalmol 2009;93:563–568
- Taylor HR. Trachoma grading: a new grading scheme. Rev Int Trach Pathol Ocul Trop Subtrop Sante Publique 1987;64:175–181
- ITI Frequently Asked Questions. 2012. Accessed June 5, 2012 from: http://trachoma.org/iti-frequently-asked-questions
- London Declaration on Neglected Tropical Diseases, 2012. Accessed June 5, 2012 from: http://www.unitingtocombatntds.org/downloads/press/ntd_event_london_declaration_on_ntds.pdf
- Gambhir M, Basáñez MG, Burton MJ, et al. The development of an age-structured model for trachoma transmission dynamics, pathogenesis and control. PLoS Negl Trop Dis 2009;3(6): e462
- WHO. Trachoma control: a guide for programme managers. 2006. http://www.who.int/blindness/causes/trachoma_documents/en/index.html
- West ES, Munoz B, Mkocha H, et al. Mass treatment and the effect on the load of Chlamydia trachomatis infection in a trachoma-hyperendemic community. Invest Ophthalmol Vis Sci 2005;46:83–87
- Lietman TM, Gebre T, Ayele B, et al. The epidemiological dynamics of infectious trachoma may facilitate elimination. Epidemics 2011;3:119–124
- Burton MJ, Bowman RJ, Faal H, et al. The long-term natural history of trachomatous trichiasis in the Gambia. Invest Ophthalmol Vis Sci 2006;47:847–852
- Grassly NC, Ward ME, Ferris S, Mabey DC, Bailey RL. The natural history of trachoma infection and disease in a Gambian cohort with frequent follow-up. PLoS Negl Trop Dis 2008;2(12):e341
- Gambhir M, Basáñez MG, Turner F, et al. Trachoma: transmission, infection, and control. Lancet Infect Dis 2007;7:420–427
- Burton MJ, Holland MJ, Makalo P, et al. Re-emergence of Chlamydia trachomatis infection after mass antibiotic treatment of a trachoma-endemic Gambian community: a longitudinal study. Lancet 2005;365(9467):1321–1328
- Solomon AW, Holland MJ, Burton MJ, et al. Strategies for control of trachoma: observational study with quantitative PCR. Lancet 2003;362(9379):198–204
- West SK, Munoz B, Mkocha H, et al. Progression of active trachoma to scarring in a cohort of Tanzanian children. Ophthalmic Epidemiol 2001;8:137–144
- Bailey RL, Kajbaf M, Whittle HC, et al. The influence of local antichlamydial antibody on the acquisition and persistence of human ocular chlamydial infection: IgG antibodies are not protective. Epidemiol Infect 1993;111:315–324
- Dolin PJ, Faal H, Johnson GJ, et al. Trachoma in The Gambia. Br J Ophthalmol 1998;82:930–933
- WHO. Report of the 2nd Global Scientific Meeting on Trachoma, 2003: http://www.who.int/blindness/2nd%20GLOBAL%20SCIENTIFIC%20MEETING.pdf
- WHO. WHO Statistical Information System (WHOSIS), 2006: http://www3.who.int/whosis/menu.cfm?path=whosis,life
- Lietman T, Porco T, Dawson C, et al. Global elimination of trachoma: how frequently should we administer mass chemotherapy? Nat Med 1999;5:572–576
- Jha H, Chaudary JS, Bhatta R, et al. Disappearance of trachoma from Western Nepal. Clin Infect Dis 2002;35:765–768
- Thein J, Zhao P, Liu H, et al. Does clinical diagnosis indicate ocular chlamydial infection in areas with a low prevalence of trachoma? Ophthalmic Epidemiol 2002;9:263–269
- Dolin PJ, Faal H, Johnson GJ, et al. Reduction of trachoma in a sub-Saharan village in absence of a disease control programme. Lancet 1997;349(9064):1511–1512
- Chidambaram JD, Lietman TM. The order is rapidly fadin’. Br J Ophthalmol 2005;89:789–790
- Stocks ME, Ogden S, Haddad D, et al. Effect of water, sanitation, and hygiene on the prevention of trachoma: a systematic review and meta-analysis. PLoS Med 2014;11:e1001605
- Harding-Esch EM, Edwards T, Mkocha H, et al. Trachoma prevalence and associated risk factors in The Gambia and Tanzania: baseline results of a cluster randomised controlled trial. PLoS Negl Trop Dis 2010;4(11): e861
- Blake IM, Burton MJ, Solomon AW, et al. Targeting antibiotics to households for trachoma control. PLoS Negl Trop Dis 2010;4(11):e862
- Basáñez MG, McCarthy JS, French MD, et al. A research agenda for helminth diseases of humans: modelling for control and elimination. PLoS Negl Trop Dis 2012;6:e1548
- Solomon AW, Harding-Esch E, Alexander ND, et al. Two doses of azithromycin to eliminate trachoma in a Tanzanian community. N Engl J Med 2008;358:1870–1871
- Griffin JT, Hollingsworth TD, Okell LC, et al. Reducing Plasmodium falciparum malaria transmission in Africa: a model-based evaluation of intervention strategies. PLoS Med 2010;7(8):pii: e1000324