Abstract
Recent structures of the potassium channel provide an essential beginning point for explaining how the pore is gated between open and closed conformations by changes in membrane voltage. Yet, the molecular details of this process and the connections to transmembrane gradients are not understood. To begin addressing how changes within a membrane environment lead to the channel’s ability to sense shifts in membrane voltage and to gate, we performed double-bilayer simulations of the Kv1.2 channel. These double-bilayer simulations enable us to simulate realistic voltage drops from resting potential conditions to depolarized conditions by changes in the bath conditions on each side of the bilayer. Our results show how the voltage sensor domain movement responds to differences in transmembrane potential. The initial voltage sensor domain movement, S4 in particular, is modulated by the gating charge response to changes in voltage and is initially stabilized by the lipid headgroups. We show this response is directly coupled to the initial stages of pore domain motion. Results presented here provide a molecular model for how the pre-gating process occurs in sequential steps: Gating charge response, movement and stabilization of the S4 voltage sensor domain, and movement near the base of the S5 region to close the pore domain.
Introduction
Transmembrane potentials occur based on differences of the electrical charge distributions on the intracellular and extracellular surfaces. In particular, K+ channels play a key role in maintaining this ionic balance across the membrane [Citation1–7]. These channels undergo a voltage dependent gating transition when a change in transmembrane voltage produces a structural change within the channel to create a passage of potassium ions across the cellular membrane [Citation7]. One of the most studied K+ channels is the Kv1.2 channel. The X-ray structure of this channel was solved by Long et al.[Citation8]. The mammalian Kv1.2 channel is a member of the Shaker K+ channel family and is closely related in amino-acid sequence and electrophysiological properties to other K+ channels [Citation8]. It consists of a homotetramer with each of the subunits containing six transmembrane segments, S1–S6, and a cytosolic T1 domain [Citation8]. The S5–S6 region forms the ion-conducting pore and determines ion selectivity, whereas the S1–S4 region forms the highly charged voltage sensor domain which includes the ‘paddle domain’. The voltage sensor domain is thought to move in direct response to a change in voltage difference across the membrane. The voltage domain response is mediated by specifically charged amino acids called ‘gating charges’.
Potassium channels cycle between two states, a closed state under a resting potential (−90 mV to −50 mV) and an open state under depolarization (−5 mV to +40 mV), as the strength of the voltage gradient across the bilayer varies [Citation7]. Studies of these channels and their relationship with differing voltage gradients date back to the initial voltage clamp experiments performed by Hodgkin and Huxley in 1952 [Citation6]. In computational simulations, the difficulty in simulating conditions comparable to a voltage clamp experiment lies in determining the spatially and temporally averaged potential on a detailed atomic level. The molecular dynamics timescale is relatively brief compared to an experimental timescale, so the simulations to be discussed can only touch on the initial changes due to a single voltage step, rather than following the full voltage dependent response.
There are several proposed approaches for modeling a transmembrane potential that have been applied to explore the effect of voltage on channel function [Citation9–14]. One method represents the transmembrane potential through the use of a constant electric field [Citation9]. In this approach one creates a constant electric field by adding a force dependent on the partial charge’s z-position relative to the xy-bilayer plane and the magnitude of the voltage drop. In this way a time-averaged constant voltage can be maintained across the bilayer. Recently, a study of the Kv1.2 channel was performed using this method [Citation11]. The study examined how the electric field within the membrane becomes ‘focused’ resulting from interactions of the gating charges with their surroundings. ‘Focusing’ in this context refers directly to these changes brought about by the charge distributions (fixed on the channel and mobile) that create a much larger voltage drop at one location relative to other locations. Another transmembrane potential method was introduced by Delemotte et al. to study the conductance of a nanotube embedded within a bilayer [Citation10]. They considered a bilayer surrounded by electrolyte baths enclosed by an air/water interface slab. The potential is established by an asymmetric distribution of ions on both sides of the membrane. With the constant-field model or the model with the air/water slab, several important characteristics of membrane systems may still not be captured, such as the ionic surface associations and fluctuations of the potential away from the average.
In this study, we investigate fluctuations of the Kv1.2 channel and its environment under different transmembrane potentials. Our approach for simulating the channel under various voltage gradients uses the double-bilayer method, an approach that was first used for pure bilayer simulations [Citation12,Citation13]. For this method, the voltage drops are dependent solely on the explicit charge concentrations felt across the bilayer. The method accounts for a transmembrane potential by simulating more than one bilayer per unit cell thus establishing two baths separated by two bilayers (); the total number of atoms between each simulation remains the same. In contrast with the constant-field method, the double-bilayer method has the ability to observe fluctuations and to determine local charge interactions within separate baths. While the air-water method has the ability to observe fluctuations similar to the double-bilayer, the contributions and interactions of the baths may not be entirely separate due to the effect of the air/vacuum slab across the periodic boundary. The advantage of our double-bilayer systems is that one can address both the fluctuations and the averages of the potential distributions.
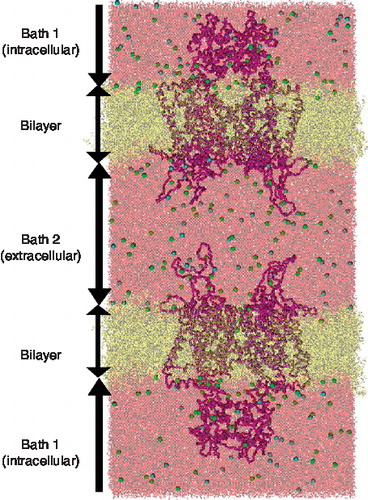
Figure 1. All-atom depiction of Kv1.2 channel double-bilayer system. The left and right boundaries are periodically connected. The K+ channels are represented as a purple Cα trace. The DOPC lipids (yellow) separate Bath 1 and Bath 2 displayed in pink. The chloride (green) and the potassium (blue) distribution within each bath are described in . This Figure is reproduced in colour in Molecular Membrane Biology online.
Our K+ channel calculations, with nearly 813,000 atoms, are the largest systems constructed and simulated using this type of method to date [Citation12–14]. This series of all-atom molecular dynamics (MD) simulations allow us to investigate the movement and interactions of the gating charges and voltage sensor domain behaviour as the transmembrane potential changes. Using these MD simulations in combination with Principal Component Analysis (PCA), we further investigate how motions of the S4 domain are coupled to fluctuations of the pore domain. We comment on the nature and degree of fluctuations for both the voltage sensor domain and the pore domain at different voltage drops across the bilayer (see ). Based on these fluctuations, we suggest several pre-gating steps leading up to the full Kv1.2 channel gating process.
Table I. Bath charge concentrations of the Kv1.2 channel.
Methods
Channel modeling
The structure of the Kv1.2 channel was solved using X-ray crystallography to a resolution of 2.90 Å (PDB ID: 2a79) [Citation8]. The structure represents residues 32 through 421 of the entire Kv1.2 channel and has some missing loop regions. A structural alignment using ClustalW [Citation15] was used to determine the best position of the sequence in comparison with the crystallographically determined regions of the channel, thus filling in the missing loop and sidechain segments and completing the full structure of the channel. The ClustalW results indicated that residues 203–218, 244–254, 276–287 would be loop regions, residues 255 through 275 (the UNK C crystallographic region) aligned with the S3 region, and residues 133 through 202 (the UNK D crystallographic region) aligned with the S1 and T1-S1 linker regions. To confirm the secondary structure of residues 32 through 421 of the entire Kv1.2 channel, the residue sequence was submitted to TMHMM Server v2.0 program [Citation16]. Our secondary transmembrane structure prediction results were validated for that region of the Kv1.2 sequence (See Supplementary Figure 1 in Supplementary information, online version only).
To construct coordinates for the missing regions and place the residue sidechains of the Kv1.2 channel, we used the CHARMM program (version c32b1) with CHARMM27 parameters [Citation17,Citation18]. The titratable residues were simulated using their default charged state in the CHARMM program, where Arg and Lys had a charge of +1, Glu and Asp had a charge of −1, and His had a neutral charge. After the loop coordinates were constructed, a series of short MD simulations were run with constrained non-loop coordinates under GBSW implicit membrane conditions [Citation19–22] to sample for various loop orientations. The GBSW membrane parameters used 30 Å for the thickness of the membrane hydrophobic core, 5 Å for each membrane interface, and a surface tension coefficient of 0.04 kcal/(mol*Å2) to represent the non-polar solvation energy. The model represents a total membrane thickness of 40 Å to mimic a bilayer of dioleoylphosphatidylcholine (DOPC). The simulations were run using a 1 fs timestep at a temperature of 300K for 2 ns. The final loop configuration for each monomer was selected based on the loop configuration that exhibited the lowest energy value.
The most recent Kv1.2-Kv2.1 chimeric structure (PDB ID:2R9R) was released after the completion of our simulations. This replaces the Kv1.2 helix-turn-helix domain (S3b–S4) with that of the Kv2.1 channel [Citation47]. The loops constructed on our Kv1.2 channel do differ from this structure, but not so dramatically that they change channel behaviour. This is because the configurations of the functionally relevant regions of the Kv1.2 channel (2a79) are similar to that of the chimeric channel (2r9r). The backbone root means square difference (RMSD) of the functionally relevant regions (S1, S2, S3, S4, S4–S5 linker, S5, P, and S6) between the two structures is 0.98 Å regions (Supplementary Figure 8, online version only). The full backbone RMS difference between the structures is 5.7 Å, stemming from the differences in loop configurations and a difference in the T1–S1 linker domain (Supplementary Figure 8, online version only). This confirms that our initial construction of loop conformations would not significantly affect the overall channel structure.
Ensemble preparation
We modeled the Kv1.2 channel (with ions in the pore region) in an all-atom double-bilayer system to understand how the channel responds to a transmembrane electrostatic potential and to enhance sampling efficiency (). An initial double-bilayer system was constructed using dioleoylphosphatidylcholine (DOPC) lipids. The dimensions of the unit cell was 150 ×150 × 340 Å. The DOPC bilayers each contained a channel and was spaced 137 Å apart to avoid direct surface interactions and interdependence between the two bilayers or channels. The resting-potential (RP = −56 mV) double-bilayer system was created by replacing a water molecule with either a K+ or Cl– ion until the starting concentration was ∼ 100 mM for each bath. The placement of the ions was based on energetically favorable locations for a RP voltage drop across the bilayer. The positions of two K+ located within the selectivity filter domain were preserved. The selectivity filter positions one and three, (S1 and S3), were used to maintain a conductive pore conformation throughout the simulations. These two ions were initially fixed only during the equilibration of the starting system to prevent collapse of the selectively filter domain. During the double-bilayer production simulations, these ions in the selectivity filter fluctuated within the S1 and S3 filter positions by tenths of an Angstrom (Supplementary Figure 11, online version only). The initial system was equilibrated for 11 ns with constant lipid surface area conditions and a Nosé-Hoover thermostat to hold the simulation at a temperature and pressure near 300 K and 1 atm.
Based on the equilibrated RP system, five different depolarized systems (DP) were created by the exchange of ions located in opposite baths. The ion exchange between the two baths facilitated the creation of a transmembrane electrified potential. The net potential for each system can be calculated based on the charge distributions listed in . The potentials used in this paper differ from previous membrane dipole potentials: The applied transmembrane potentials are smaller and remain within the physiological voltage potential conditions. The resting potential system and the five depolarized systems each contained a total of 812,614 atoms.
MD simulations
All-atom molecular dynamics (MD) simulations of all constructed ensembles were performed using Large-scale Atomic/Molecular Massively Parallel Simulator (LAMMPS) version June 2007 and CHARMM27 force field parameters [Citation18,Citation23,Citation24]. LAMMPS has been used for previous biomolecular transmembrane potential simulations with great success, having excellent parallel scaling abilities [Citation13,Citation14]. The simulations of the six different systems were performed at Sandia National Laboratories on the large-scale Computational Plant (Cplant) cluster. An average of 0.8 ns per day on 250 processors was completed.
The unconstrained MD simulations were performed for an equilibration time of 1–2 ns and a simulation run time of 10 ns at a temperature of 300 K for each of the simulations. These unconstrained MD simulations allows for flexibility of the sidechain and backbone of the protein and a free-flow movement for the lipid, water, and ion molecules. The SHAKE algorithm held the bonds of the hydrogen atoms rigid to enable a 2 femtosecond timestep. The TIP3 waters were also held rigid by SHAKE. Each system was simulated under constant lipid surface area conditions and allowing only the simulation cell length in the z-direction to fluctuate in order to maintain isobaric conditions. A Nosé-Hoover thermostat held the simulations at a temperature and pressure near 300 K and 1 atm, values that are consistent with CHARMM lipid force fields. The z-direction box length remained around 340 Å, with minor fluctuations of about 1–1.5 Å, for both the RP and the DP systems. The final dimensions for the periodic boundary conditions of each system were 150 Å × 150 Å × 340 Å. The separation between the bilayers had minor fluctuations of about 1 to 1.5 Å throughout the 10 ns. The particle-particle-particle-mesh (P3M) method was used to compute the long-range electrostatics, which is similar to the commonly used particle mesh Ewald (PME) method. We used a real-space cut-off of 10 Å and smoothly switched the van der Waals (vdW) interaction to zero between 8 and 10 Å.
While a total simulation time of 10 ns is short compared to the timescale of the full gating-transition (microseconds to milliseconds), the use of an ensemble of double-bilayer simulations at different transmembrane potentials gives us some insights into the initial stages of the gating process. At the same time, we want to note that any large molecular dynamics simulation would have sampling problems for those events that are not observed in the simulations. We thus report on averages and analysis of rare events (observed once or twice in a simulation) and attempt to represent our confidence with error bars and discussion in what follows.
Analysis
The analysis for the all-atom calculations was predominately completed using MDAnalysis scripts, an analysis library developed by Michaud-Agrawal [Citation25]. The potential profiles were calculated based on the average of the charge distribution over time and space for particular one-dimensional z-slices. This calculation is similar to the calculation performed by Lee et al., Sachs et al. and Denning and Woolf [Citation12–14]. The phosphate headgroup distance and angle cut-off values used to assess our lipid hydrogen-bond patterns were rHB = 0.35 nm and αHB = 60° and have been used to evaluate hydrogen-bond patterns in other studies [Citation14,Citation26–28]. For the number of coordinating water molecules, distance cutoff values of rHB = 0.35 nm, 0.40 nm, and 0.50 nm were used, similar choices have been made in other studies [Citation14,Citation26–28].
To determine whether equilibrium conformational fluctuations of the pore vary with the voltage drop across the bilayer, additional analysis was performed. Principal component analysis (PCA) determines the effective normal modes observed in the MD trajectory. The method we use is similar to that used to reveal key fluctuations of the NikR protein by Bradley et al. [Citation29]. PCA for α carbons of the channel pore domain used the quasiharmonic vibran module in CHARMM. The vector (Δx) described the displacement of α carbon atoms from the minimized starting open to a final closed structure determined by X-ray crystallography. The Kv1.2 open and closed structures were created through homology modelling using Modeller and threading the Kv1.2 sequence through the K+ channel pore X-ray structures. The KcsA structure (1k4c) represented the closed conformation and the Kv1.2 (2a79) structure represented the open conformation. The question of whether the displacement vector from the X-ray structures, Δx, represented in the vector space described by subsets of PCA modes change as a function of voltage was accomplished by calculating the weight factor (α(i)) for each PCA mode as follows:
Then a subset S of modes was used to calculate a reconstructed vector (![]() ) as follows:
) as follows:
The similarity between Δx and each PCA mode (vi or ![]() ) was assessed by their overlap as measured by the angle between the two vectors:
) was assessed by their overlap as measured by the angle between the two vectors:
The relative correspondence of the reconstructed vectors was computed:
This relative correspondence provides a measure of how well the displacement due to the reconstructed vector agrees with the observed crystallographic displacement vector. This calculation assesses conformational fluctuations when compared across different voltages and the number of modes required to represent these motions. For each of the different voltages, the relative correspondence, ϵ, as a function of the mode number, x, was found to decay exponentially, i.e., ϵ(x) = exp(-m*x), and thus can be characterized by a single parameter m (or the decay constant 1/m). We calculated m from a linear fit to y = ln(ϵ(x)) via a least-squares linear regression:
where m is the slope, n represents the number of data points (180), x is the mode number, and y is the natural logarithm of the relative correspondence at a particular x value. This fit for the relative correspondence allows us to understand how the conformational fluctuations changed as a function of voltage, averaged over the full trajectory.
Results
Voltage drop profile
The potassium channel undergoes several pre-gating steps in preparation to change conformation between a closed state under a resting potential (−90 mV to −50 mV) and an open state under depolarization (−5 mV to +40 mV) [Citation7]. To simulate physiological changes in voltage and explore steps key to the K+ channel gating process, the Kv1.2 channel was simulated using the double-bilayer method. shows the nature of the double-bilayer method. The use of two independent baths allows the explicit variation of salt concentrations between the inner and outer baths which establishes a biological voltage gradient. Placing a single channel in each bilayer supports thorough sampling for changes in channel behavior that occur under the same applied transmembrane potential conditions.
The transmembrane potentials used here reflect physiological conditions necessary to stimulate the channel gating process. Five different voltage systems were used to simulate depolarized states, relative to the resting potential state, for the K+ channel. Each of our simulations represents a different physiological transmembrane potential gradient associated with a distinctive voltage profile. The voltage drop across a bilayer for each system established itself over a time period of 1 ns (). The smoothness of the 1 ns voltage profile indicates that the strength of the ionic concentration and the mobile charge distribution is evenly distributed within the two baths for each simulation. While this is not a proof that the voltage drop is constant over each simulation, this suggests that the long-time and spatial average produced within each simulation is that of a Nernst potential determined by the salt baths. The advantage of our double-bilayer systems is that one can address both the fluctuations and the averages of the potential distributions. This benefit allows one to examine questions of how the local charge distributions can contribute to the conformational changes discussed in later sections.
Figure 2. Establishing K+ channel potentials. (A) Transmembrane potential profiles at time specific averages. (Dotted line = 100 ps; dot-dashed = 1 ns; solid = 10 ns). Arrows indicate locations of bilayer. (B) Transmembrane potential profiles. The line colour corresponds to the expected voltage gradient for each system (RP = resting potential, DP = depolarized potential). The arrows along the axis indicate the location of the baths and the bilayer regions. The simulations contain a constant total number of ions. To establish the different voltage gradients ions were exchanged between the two baths. (C) The two-dimensional (xz-plane) transmembrane potential profile of the DP5 system has a 15 mV drop and shows the inhomogeneous nature of the voltage drop across the bilayer (see arrows). This Figure is reproduced in colour in Molecular Membrane Biology online.
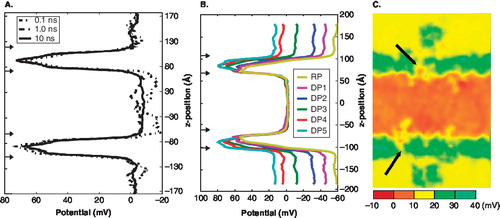
The six different voltage profiles, seen in , show how the voltage drop across the bilayers varies as the ionic concentrations within the two baths is changed. These simulations represent the shift from a resting potential (−56 mV) to a depolarized potential (+15 mV). The local charge contributions made from the channel and bilayer distributions are located where the local voltage has the highest values (). These peaks can be attributed to the contributions of the partial charges of the channel and lipids. To further examine the charge distribution details found within the peak regions, a two-dimensional (2D) voltage profile was calculated. Similar to the one-dimensional voltage profile, the 2D voltage profile of the xz-plane establishes itself over a time period of 1 ns (Supplementary Figure 6, online version only). shows a time-averaged 2D voltage profile of the xz-plane for the DP5 system. This Figure shows how the electric field is focused near the S4 domain. Similar behaviour has also been observed in other studies and it has been hypothesized that such a focusing effect contributes to an increased switching sensitivity of the channel as the voltage drop changes [Citation27,Citation28,Citation30,Citation31].
This sensitivity near the S4 domain is a result of the different interaction patterns of the gating charges with their environment as the transmembrane potential changes. shows that within the channel/bilayer regions the peaks shift toward Bath 1, the extracellular bath, by ∼ 2–3 Å as the voltage drop across the membrane becomes depolarized. The shifting of these peaks is due to the re-adjustment of the gating charges within a membrane environment. In other words, as the S4 helix shifts toward the extracellular bath the individual gating charges become more solvated thus shifting the electric field further toward the remaining charges buried within the bilayer (solvation of these charges are later discussed in more detail). In the next section, we show how gating charge interactions with lipid and water molecules in a membrane environment lead to earlier steps of the gating process.
Gating charge interactions
The lipid and water molecule interactions are important for understanding how charged residues behave within a bilayer environment [Citation32–34]. In particular, the atomic interactions of the gating charges, Arg294, Arg297, Arg300, and Arg303 located on the S4 domain, are of interest because their movements are considered to be the driving force for voltage sensor domain motions [Citation11,Citation14,Citation27,Citation28,Citation30–41]. As no constraints were used during these simulations, the arginine positions are influenced by their interactions with lipid and water molecules and thus contribute to changes within the local electrical field of the membrane [Citation11,Citation14,Citation27,Citation28,Citation30,Citation31]. Note that our understanding of their response to voltage depends on convergence of sampling and thus we are limited to what is seen within the 10 ns simulations at each voltage level. Previous studies of smaller systems, involving only the helix-turn-helix motif of the voltage sensor domain, observed fluctuations in the total number of lipid and water hydrogen-bonds around the gating charges for all proteins when varying the voltage from the resting potential to a depolarized potential [Citation14,Citation30]. Due to the unconstrained nature of our MD simulations, environmental effects such as lipid or water molecule coordination influence arginine sidechain behavior (e.g., flexibility and position within the bilayer). A full understanding of these effects would clearly require several orders of magnitude greater simulation time to understand how frequently different environmental changes occur. In the much shorter time of our simulations, we examined the fluctuations in the total number of lipid hydrogen-bonds and coordinating water molecules with these gating charges using the cutoff values noted in the Methods section. As can be seen in Supplementary Figures 4 and 5 (online version only), the initial fluctuations in the number of lipid headgroups and water molecules with each subunit and each residue are subtle and no major change is detected during the 10 ns of our simulations. To determine how the collective environmental effects are distributed across a single channel as the transmembrane voltage changes, the average number of lipid headgroups and water molecules per subunit were calculated for each channel. These average changes reflect the behavior over a 10 ns time interval and should not be interpreted as changes that occur immediately upon a voltage change.
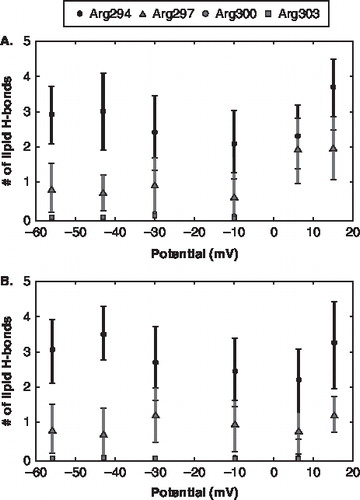
Our averaged-results show that in the initial stages of gating the number of lipid headgroups in close contact with Arg294 and Arg297 is voltage-dependent (). The charged residues coordinate differently with lipids depending on the strength of the applied potential. As the potential becomes more depolarized the number of lipids that form hydrogen-bonds with Arg294 and Arg297 increased, while hydrogen-bonding with Arg300 and Arg303 remained negligible. This lipid response only occurred for a single channel while the number of lipid hydrogen-bonds for the other channel with the system remained constant independent of changes in voltage. This indicates that the timescales for initial formation of lipid-protein hydrogen bonds to occur may be on the order of nanoseconds.
Figure 3. The lipid hydrogen bond pattern for the individual channels as a function of voltage. (The square dot represents Arg294; triangle dot represents Arg297; diamond dot represents Arg300; circle dot represents Arg303) The error bars represent the standard deviation. (A) Channel 1 gating charges and the number of lipid hydrogen bonds. (B) Channel 2 gating charges and the number of lipid hydrogen bonds.
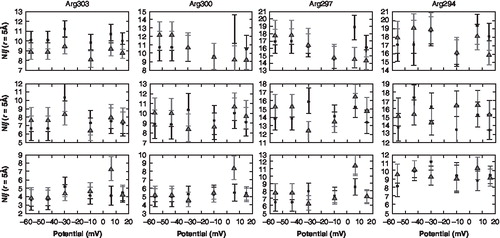
While the number of lipid hydrogen-bonds in our simulations changed relative to the transmembrane potential, the number of water molecules coordinating the gating charges did not change appreciably in the early stages of pre-gating (). The number of coordinating water molecules for each of the gating charges was calculated at different cut-off distances rHB (). Arg300 and Arg303 had an average of 3–5 water molecules coordinating within an rHB = 3 Å, while an average of 6–8 water molecules were coordinating Arg294 and Arg297. The number of water molecules surrounding the gating charges increased with rHB of the gating charges. While it is not observed in this study, previous work, in smaller systems, has found that the total number of water molecules around the arginines changed after 10–30 ns when the voltage was varied from −190 mV to +100 mV [Citation14,Citation30]. Due to the short timescales of our simulations, one would expect that on longer timescales the number of water molecules coordinating the gating charges would exhibit a voltage dependence based on the results observed in these previous studies. Both the lipid and the water hydrogen-bonding effects produce changes within the local electrical field of the membrane that influence the position of the gating charges within the membrane and thus cause a shift in the position of the S4 voltage sensor domain.
Figure 4. Water hydrogen bonding pattern for the gating charges. The distributions show the average number of coordinating water molecules (Nij) as a function of the voltage gradient for 3 of the gating charges at different radial distribution values. (The square dot represents channel 1; the triangle dot represents channel 2). The error bars represent the standard deviation.
Gating charge fluctuations
The gating charge’s positions are influenced by their interactions with lipid and water molecules and shift as the local electrical field of the membrane changes [Citation11,Citation14,Citation28,Citation30]. In the open state or under depolarized conditions, previous studies have shown that Arg294 and Arg297 interact more strongly with both lipid headgroups and water molecules shown by the hydrogen-bond partner analysis [Citation14,Citation30]. Arg300 and Arg303 were also shown to form salt-bridges with Glu183 from the S1 domain as the transmembrane potential is depolarized [Citation11,Citation28,Citation30,Citation38,Citation44]; Arg300 would compete with Arg303 to form a salt-bridge interaction with Glu226 of the S2 domain [Citation11,Citation28,Citation30,Citation39].
In our simulations, the shift of the S4 domain in the z-direction () repositions the first two gating charges, Arg294 and Arg297. Initially, we examine the centre of mass (COM) z-position for each of the four gating charges relative to the COM of the pore domain over the full 10 ns of our simulations. As seen in Supplementary Figures 3 and 10 (online version only), no collective shifts among the charged residues were detected for either channel. This suggests that a longer timescale is needed to observe the full set of changes that underlie gating, a collective shift of all gating charges within the bilayer. The fluctuations for each residue were averaged among individual channels to determine if a subtle trend in the z-position shift for a particular channel occurs as the voltage drop changes. As the voltage changes from a resting potential to a more depolarized potential, they move from pointing toward the S1–S3 domains to pointing towards the extracellular bath region (). In addition to Arg294 and Arg297 moving in response to changes in voltage, Arg303 also showed a response that correlates to a change in the voltage gradient (). These initial events suggest these three residues contribute to movements of the voltage sensor domain during the early stages of the gating process.
Figure 5. The centre of mass position of the sidechain for the gating charges for each channel versus the voltage drop. The error bars represent the time-averaged standard deviation for each z-position. (The dashed line represents Arg294; the solid line represents Arg297; the dash-dot line represents Arg300; and a dot-dot line represents Arg303) (A) Channel 1 (B) Channel 2.
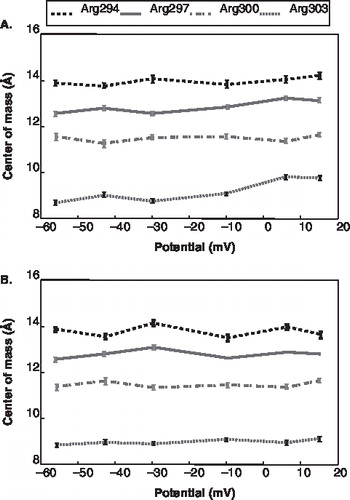
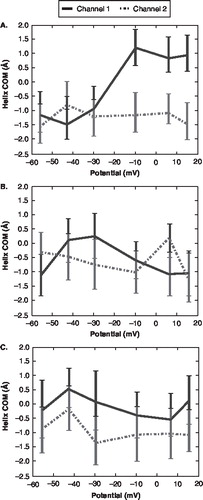
Figure 6. The centre of mass position of the voltage sensor domain for each channel versus the voltage drop. The error bars represent the time-averaged standard deviation for each z-position. (The solid line represent channel 1; the dashed line represents channel 2) (A) S4 domain, (B) S2 domain, (C) S3 domain.
Voltage sensor domain fluctuations
As the voltage sensor domain responds to differences in the transmembrane voltage drop, the gating effect can be seen as a type of domain motion. Previous experimental studies have examined the degree and nature of this domain motion [Citation8,Citation31,Citation38–43] as well as interactions within a bilayer environment [Citation35–37]. The S4 domain motion, in particular, is influenced directly by the response of the gating charges. The S4 domain has been shown to move laterally within the bilayer as gating charges move and the strength of the voltage drop changes [Citation14,Citation30,Citation40,Citation43,Citation44]. For example, previous studies have suggested that S4 domain translation within the bilayer is subtle moving only 2–3 Å [Citation11,Citation44,Citation45]. Upon analyzing the z-position for the COM for individual S4 domains relative to the COM of the pore domain, no collective shifts among four S4 domains for a single channel were observed over our simulation period of 10 ns (Supplementary Figures 2 and 10, online version only). To determine if our fluctuations for individual S4 subunits exhibit a general trend for a particular channel, the average S4 COM position was calculated for both channels. When taking the average COM positions of all S4 domains for each channel, a shift in position along the membrane normal is observed as the transmembrane potential decreases. Under depolarization, the S4 domains move towards the extracellular side by 1–2 Å for this channel (). The degree and the direction of the S4 domain shift is similar to previous computational simulations on longer timescales [Citation44,Citation45]. This shift may begin to occur on a timescale of 10 ns as the S4 domain shift only occurred for one of the channels. The observed S4 domain fluctuations and resulting shift are coupled to the degree of pore domain fluctuation.
The motions of the S4 domain, while subtle, do not occur without additional supporting interactions. Previous studies have shown that both lipid headgroups and small S2 and S3 domain motions may be an important part in stabilizing the motions of the S4 domain [Citation11,Citation28,Citation30,Citation35–40,Citation42,Citation43]. On the timescale of our transmembrane voltage simulations, only small COM fluctuations of the S2 and S3 domains were observed (, ). The small initial fluctuation of S2 and S3 indicate that these domains do not respond directly to changes in voltage during the steps of the pre-gating process. While this is not a direct assessment that the S2 and S3 domains stabilize the S4 domain, this small motion is consistent with other studies of longer timescales [Citation30,Citation44,Citation45] and may be an initial indication that their small movement contributes to the stabilization of the S4 domain movement.
PCA: Pore fluctuations
As the S4 domain shifts during the gating process, its motions drive the structural transition between the open and closed state of the pore domain by influencing the movement of S5 and S6. Our double-bilayer simulations only explore a small portion of the transition, the pre-gating effects; however, even on this small timescale fluctuations could be present that would eventually lead to the large-scale gating transition motions. To explore the context of the structural transition of the Kv1.2 channel pore domain, Principal Component Analysis (PCA) was used. PCA provides an additional avenue to quantitatively determine if the all-atom equilibrium fluctuations carry within them low frequency modes necessary to complete a specific transition. Since our simulation timescale is short compared to the full K+ channel transition, we examine the extent of pore fluctuations to determine which modes are necessary for the transition between the open and closed state, and thus the amount and direction of the motion coupled to different voltage drops across the bilayer.
The initial K+ channel transition between the conductive and non-conductive states can be observed through the use of reconstructed PCA modes and a displacement vector. PCA was performed for the α carbons of 404 pore domain residues from the Kv1.2 equilibrium MD simulations yielding a total of 1212 modes based on 3N mode space, N being the total number of atoms. The first 600 PCA modes out of 1212 modes were analyzed and compared to standards used in previous PCA/MD simulations studies [Citation29].
The question becomes what percentage of the total movement represents similarity between Δx and each PCA mode along the open to closed path is captured within these 600 modes. To do this, the relative correspondence, also known as relative error, of subsets of modes was calculated along a displacement vector for the pore domain atoms. The relative correspondence provides an indication of how subsets of modes describe motions that would lead to the closing of the pore domain. shows the relative overlap for a particular subset of modes with the open to closed displacement vector for each voltage drop. A low relative correspondence indicates a higher percentage of the included modes contribute to the motions closing the channel. As the total number of modes increases, the amount of relevant motion closing the channel increases (). shows that 180 modes out of the 600 modes analyzed capture most of the movement for each of the individual voltage differences. These 180 modes provided a reasonable representation of the conformational change present at each voltage based on standards of PCA/MD simulations studies [Citation29] and this subset of modes captured over 90% of the closing motions of the pore domain (). Since the relative correspondence was found to decay exponentially as a function of the mode number x, was re-plotted () as a logarithmic plot to show how the natural logarithm of the relative correspondence changes as a function of the mode number. Based on the logarithmic plot, one can see that the natural logarithm of the relative correspondence changes linearly as the number of modes increases within the 180 modes.
Figure 7. The percent of displacement overlap for the pore domain as a function of mode for each voltage drop. (Yellow = RP; Pink = DP1; Cyan = DP2; Red = DP3; Green = DP4; Blue = DP5). The displacement vector represents an open ◊ closed channel vector. (A) Basic line plot (B) Natural logarithm plot (C) First 180 modes basic line plot (D) First 180 modes natural logarithm plot. This Figure is reproduced in colour in Molecular Membrane Biology online.
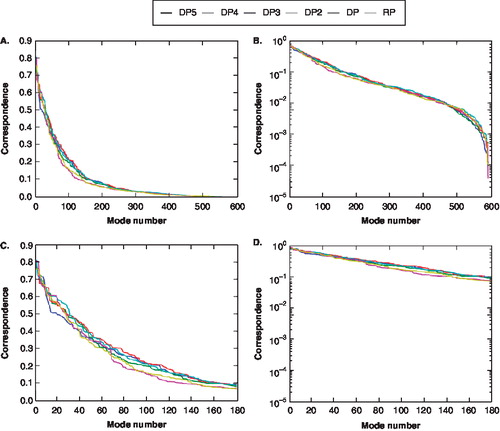
While the natural logarithm relative correspondence seems to follow a linear fit, it is difficult to ascertain how these fluctuations differ between the six double-bilayer simulations. The subtle difference between the correspondence profiles for the six systems may indicate a low signal-to-noise ratio. This result though is not surprising because we only sample on a small portion of the full gating transition during our MD simulations. To further analyze the correspondence profiles, we examine how the natural logarithm of the relative correspondence changes as the subset of included modes increases by calculating a linear fit for the single parameter m (or the decay constant 1/m) for each of the different voltage simulations. This calculation allows us to quantitatively analyze the relative correspondence and thus the overall pore domain fluctuations to determine if they would lead to the closing of the pore.
The rate of movement along the subset of reconstructed vectors differs (). It changes with the voltage drop across the bilayer and its rate of change, the logarithm of the percent correspondence per mode, is shown in . A lower rate of change indicates that the subset of modes involved move more along the open to closed displacement vector. In other words, the lower the rate of change the more the modes at a specific voltage contribute to the global movement toward a more closed state. For example, at −60 mV the rate of change shows the pore domain motions are closing the channel, while at −10 to 15 mV the rate of change values are higher and the modes do not sample along the displacement vector. This result makes sense because the channel is already and should remain in an open state under depolarized conditions (−10 to 15 mV).
Figure 8. Characterization of motions and displacement based on the PCA modes of the pore domain. (A) The Figure shows the rate of change in the error of overlap as a function of voltage. (represents open ◊ closed). The error bars indicate the error based on subsets of the trajectory data. (B, C) The colours indicate the degree and direction of displacement (Blue = high overlap with Δx; White = low overlap with Δx; Red = minimal overall motion) (B) Cα trace of the pore showing the motions at −56 mV. (C) Cα trace of the pore showing the motions at +15 mV. This Figure is reproduced in colour in Molecular Membrane Biology online.
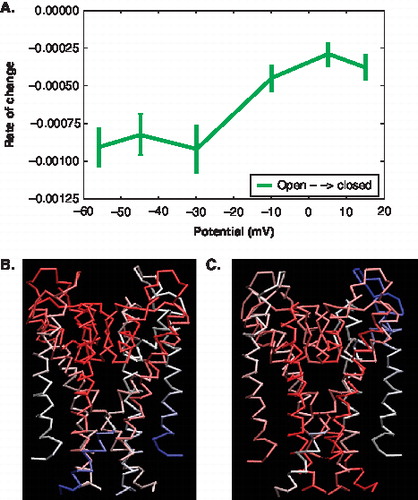
The depolarized potential simulations exhibit less movement along the open to closed displacement vectors. The movement for this simulation is largely around the loop regions of the pore (). The resting potential simulations, ranging from −56 mV to −30 mV, display greater movement along the displacement vector and movement is localized near the connection of the S5 to the S4–S5 linker (). At depolarizing potentials we observe more fluctuations of the S4–S5 linker and these fluctuations are preferentially directed in the direction towards the closed state structure. This is consistent with simulations of longer timescales [Citation45] where the motions near the S4–S5 linker and S5 region correspond to the opening and closing of the pore domain. Although we do not observe a full gating transition, this result indicates that the pore-closing motions are encoded in the open state structure. Furthermore, these motions are enhanced at transmembrane potentials that lead to channel closure under physiological conditions and eventually facilitate the gating transition at longer time scales [Citation46]. Thus motions of the pore domain are shown to be directly associated with motions of the S4 domain.
Discussion
The focus of K+ channel experimental studies has been on understanding the full K+ channel gating transition and how gating charge motion and interactions are coupled to the gating of the pore domain in response to changes in the transmembrane potential [Citation6,Citation35–40,Citation42,Citation43]. Computationally, it is difficult to show the full K+ channel gating-transition on the timescales of an unbiased all-atom MD simulation as the full transitions occurs on a microsecond to millisecond timescale [Citation1–5]. An unbiased MD simulation would allow one to examine the natural course of interactions and events of a transition without the presence of additional forces. Previous and current results shown in this paper illustrate that full rigid body motion of the S4 sensor alone in unbiased MD simulations begins on the order of ns-μs [Citation14,Citation27,Citation28,Citation30,Citation44].
We hypothesize that the gating transition process occurs in steps: gating charges are influenced by changes in their environment, S4 moves laterally in response, and then this change is transmitted along the S4–S5 linker biasing the pore domain to open or close the channel. The MD double-bilayer simulations together with PCA help to investigate how changes in the voltage drop across the bilayer lead to different motions for the Kv1.2 channel. Our results suggest that the dynamics seen in these simulations contain initial fluctuations relevant to the conformational transition between the conductive and nonconductive states.
The first ‘pre-gating’ phase involves the gating charges of the S4 domain interacting with their environment. The biophysical underpinnings of the local voltage changes around the S4 domain are believed to stem from the ability of the gating charges to interact differently with their environment under various transmembrane potential conditions [Citation14,Citation30]. The suggestion is that the fluctuations of these gating charges can signal the initial pore domain fluctuations as the voltage drop changes from a depolarized to resting-state potential and thus their interactions with their environment influence the degree of pore fluctuations. Previous electron paramagnetic resonance (EPR) measurements of the K+ channel show that only residues Arg294 and Arg297 would be exposed to the lipid headgroup region [Citation38]. The EPR study showed that for KvAP the gating charges Arg133 and Arg136 were not exposed to the lipid headgroup environment based on their low probe mobility and their inaccessibility to either O2 or NiEdda [Citation38]. Our results are comparable to the EPR results in that Arg300 and Arg303 of the Kv1.2 channel, the equivalent of residues Arg133 and Arg136 of KvAP channel, do not hydrogen-bond with the lipid headgroups. This result did not change even as the strength of the applied voltage varied. Our results suggest that in the initial stages of gating the number of lipid head groups in close contact with Arg294 and Arg297 is voltage-dependent. The charged residues coordinate differently with lipids depending on the strength of the applied potential.
Water crevices surrounding the voltage sensor domain have been shown to direct the transmembrane electric field around the S4 domain, which leads to an energetic stabilization of the charged domain inside the membrane. It exposes the sensor to strong electrostatic forces so that one would expect the largest motions due to the field to occur at the S4 domain, thus creating a stronger effect within the electric field around the S4 domain [Citation14,Citation27,Citation28]. While this was not analyzed in depth, similar water crevices were observed during our studies (Supplementary Figure 7, online version only). These water crevices are necessary to stabilize and solvate the arginines within the hydrophobic environment of bilayer. Arginines have been found to participate in stable salt-bridges with negatively charged residues from the neighbouring S1 and S2 helices, forming a structural barrier separating the extracellular and intracellular water cavities within the voltage-sensing domains [Citation27,Citation28].
Under physiological conditions, the interactions of the gating charges shift causing a lateral displacement of the S4 domain as the transmembrane potential changes. Experimental studies show the S4 domain moves laterally and rotates within the bilayer plane during gating while the S2 and S3 domains undergo little or no movement [Citation30,Citation31,Citation36,Citation37,Citation42,Citation43]. These fluorescence resonance energy transfer (FRET) and EPR studies showed no variation in signal for these two domains as the potential drop changed indicative of little to no large-scale movement. On the timescale of our transmembrane voltage simulations, the small COM fluctuation of S2 and S3 indicate that these domains do not immediately respond to changes in voltage. This is consistent with other computational studies [Citation11,Citation30,Citation44] and may suggest that their subtle domain motions stabilize the motions of the S4 domain as it rotates within the xy-plane.
The degree and direction of S4 domain shift observed in this study is also similar to the previous experimental and computational simulations on longer timescales [Citation31–40,Citation44,Citation45]. As the voltage drop shifts to a resting-potential, the S4 domain translates in the z-direction within the bilayer by 1–2 Å. The S4 displacement is directly connected to several aspects of the system. This shift affects the local electric field of the bilayer/channel regions and is reflected in a 1–2 Å shift in the voltage profile as the transmembrane potential changes. The S4 domain translation also corresponds to different degrees of pore domain fluctuations.
The shift of the S4 domain is coupled to pore domain fluctuations involved with the closing of the channel gate. As the potential approaches a resting-state value, the S4 domain translates in the z-dimension within the bilayer by 1–2 Å, producing increased fluctuations of the pore domain. The fluctuations of the pore domain increase due to the channel changing conformations to a non-conductive state as the voltage potential relaxes from a depolarized potential to a resting-state potential. In other words, as the strength of the voltage drop decreases so does the degree to which the pore domain fluctuates. The increased pore domain movement occurs near the beginning of the S5 domain. These initial fluctuations may be connected to those interactions between the S4–S5 linker and the C-terminus of the S6 helix responsible for closing the channel observed in other studies [Citation45,Citation46]. However, it is difficult to ascertain a direct connection, as the timescales for these simulations do not extend to the full gating transition. Although the entire transition is not observed these results do indicate that pore-closing motions are encoded in the open state structure and are enhanced during the TM potentials that lead to channel closure under physiological conditions, thus eventually facilitating the gating transition at longer time scales. The coupling between the fluctuations of the pore domain and S4 domain may indicate these are initial pre-gating motions necessary for transitioning between the conductive and non-conductive states.
In summary, the Kv1.2 channel undergoes several steps within the gating process. The results presented here provide evidence for bridging the gap between the initial gating charge response and the motions of the pore domain. Using a combination of MD and PCA, our results suggest how variations in transmembrane potential influence the gating charges and the voltage sensor domain and thus increase pore domain fluctuations. The gating charges are sensitive to changes in the transmembrane potential and it is reflected in their hydrogen-bonding patterns and position. The observed S4 gating domain motions may be indicative that its rigid body motions begin on the order of nanoseconds. The changes in voltage sensor domain position, in particular S4, are associated with pore domain fluctuations that open or close the channel. PCA analysis allows one to provide insights into motions typically observed in longer timescale simulations. This Kv1.2 channel study also contributes to the use of different methods used to study large transmembrane proteins under different voltage gradients and demonstrates the importance of understanding channel behavior and function under physiological conditions.
Supplementary Material
Download JPEG Image (114.1 KB)
Supplementary Material
Download JPEG Image (771.9 KB)
Supplementary Material
Download JPEG Image (901.1 KB)
Supplementary Material
Download JPEG Image (442.5 KB)
Supplementary Material
Download JPEG Image (1.3 MB)
Supplementary Material
Download JPEG Image (417.4 KB)
Supplementary Material
Download JPEG Image (328.1 KB)
Supplementary Material
Download JPEG Image (262.4 KB)
Supplementary Material
Download JPEG Image (161.9 KB)
Supplementary Material
Download JPEG Image (237.7 KB)
Supplementary Material
Download JPEG Image (661.2 KB)
Acknowledgements
The authors thank Oliver Beckstein and Naveen Michaud-Agrawal for valuable discussions and contributions to MDAnalysis. This research was funded by a grant from National Institutes of Health (GM064746). Sandia is a multiprogram laboratory operated by Sandia Corporation, a Lockheed Martin Company, for the United States Department of Energy's National Nuclear Security Administration under contract DE-AC04-94AL85000.
Declaration of interest: The authors report no conflicts of interest. The authors alone are responsible for the content and writing of the paper.
References
- Bezanilla F. 2008. How membrane proteins sense voltage. Nat Rev Mol Cell Biol. 9:323–332.
- Grottesi A, Sands ZA, Sansom MSP. 2005. Potassium channels: complete and undistorted. Curr Biol. 15:R771–774.
- Lindahl E, Sansom MSP. 2008. Membrane proteins: Molecular dynamics simulations. Curr Opinion Struct Biol. 18:425–431.
- Roux B. 2007. Dissecting the coupling between the voltage sensor and pore domains. Neuron. 52:568–569.
- Sigworth FJ. 2007. The last few frames of the voltage-gating movie. Biophys J. 93:2981–2983.
- Hodgkin AL, Huxley AF. 1952. A quantitative description of membrane current and its application to conduction and excitation in nerve. J Physiol. 117:500–544.
- Hille B. 2001. Ion channels of excitable membranes. 3rd ed. Sunderland, MA: Sinauer.
- Long SB, Campbell EB, MacKinnon R. 2005. Crystal structure of a mammalian voltage-dependent Shaker family K+ channel Science. 309:897–903.
- Roux B. 2008. The membrane potential and its representation by a constant electric field in computer simulations. Biophys J. 95:4205–4216.
- Delemotte L, Dehez F, Treptow W, Tarek M. 2008. Modeling membranes under a transmembrane potential. J Phys Chem D. 112:5547–5550.
- Jogini V, Roux B. 2007. Dynamics of the Kv1.2 voltage-gated K+ channel in a membrane environment. Biophys J. 93:3070–3082.
- Lee S-J, Song Y, Baker NA. 2008. Molecular dynamics simulations of asymmetric NaCl and KCl solutions separated by phosphatidylcholine bilayers: Potential drops and structural changes induced by strong Na+-lipid interactions and finite size effects. Biophys J. 94:3565–3576.
- Sachs JN, Crozier PS, Woolf TB. 2004. Atomistic simulations of biologically realistic transmembrane potential gradients. J Chem Phys. 121:10847–10851.
- Denning EJ, Woolf TB. 2008. Double bilayers and transmembrane gradients: A molecular dynamics study of a highly charged peptide. Biophys J. 95:3161–3173.
- Larkin MA, Blackshields G, Brown NP, Chenna R, McGettigan PA, McWilliam H, Valentin F, Wallace IM, Wilm A, Lopez R, Thompson JD, Gibson TJ, Higgins DG. 2007. ClustalW and ClustalX version 2. Bioinformatics 23:2947–2948. http://www.ebi.ac.uk/Tools/clustalw2/index.html.
- TMHMM server v2.0 for predicting transmembrane helices in proteins. Accessed from the website: http://www.cbs.dtu.dk/services/TMHMM/.
- Brooks BR, Bruccoleri RE, Olafson BD, States DJ, Swaminathan S, Karplus M (1983) CHARMM: A program for macromolecular energy, minimization, and dynamics calculations. J Comp Chem 4:187–217.
- MacKerell AD, Bashford D, Bellott M, Dunbrack RL, Evanseck JD, Field MJ, Fischer S, Gao J, Guo H, Ha S, Joseph-McCarthy D, Kuchnir L, Kuczera K, Lau FTK, Mattos C, Michnick S, Ngo T, Nguyen DT, Prodhom B, Reiher WE, Roux B, Schlenkrich M, Smith JC, Stote R, Straub J, Watanabe M, Wiorkiewicz-Kuczera J, Yin D, Karplus M. 1998. All-atom empirical potential for molecular modeling and dynamics studies of proteins. J Phys Chem B. 102:3586–3616.
- Feig M, Im W, Brooks CL. 2004. Implicit solvation based on generalized Born theory in different dielectric environments. J Chem Phys. 120:903–911.
- Feig M, Onufriev A, Lee MS, Im W, Case DA, Brooks CL. 2004. Performance comparison of generalized born and Poisson methods in the calculation of electrostatic solvation energies for protein structures. J Comp Chem. 25:265–284.
- Im W, Feig M, Brooks CL III. 2003. An implicit membrane generalized Born theory for the study of structure, stability, and interactions of membrane proteins. Biophys J. 85:2900–2918.
- Im W, Lee MS, Brooks CL III. 2003. Generalized Born model with a simple smoothing function. J Comp Chem. 24:1691–1702.
- Plimpton SJ. 1995. Fast parallel algorithms for short-range molecular dynamics. J Comp Phys. 117:1–19.
- Plimpton SJ, Pollock R, Stevens M. March 1997. Particle-Mesh Ewald and rRESPA for parallel molecular dynamics simulations. The 8th SIAM Conference on Parallel Processing for Scientific Computing Abstracts. Abstract.
- Michaud-Agrawal N. Accessed from the website: http://code.google.com/p/mdanalysis.
- Spoel D van der, Lindahl E, Hess B, van Buuern AR, Apol E, Meulenhoff PJ, Teileman DP, Sijbers ALTM, Feenstra KA, van Drunen R, Berendsen HJC. 2004. Gromacs User Manual version 3.2. www.gromacs.org.
- Treptow W, Tarek M. 2006. Environment of the gating charges in the Kv1.2 Shaker Potassium Channel. Biophys J. 90:L64–66.
- Sands Z, Sansom MSP. 2007. How does a voltage sensor interact with a lipid bilayer? Simulations of a potassium channel domain. Structure. 15:235–244.
- Bradley MJ, Chivers PT, Baker NA. 2008. Molecular dynamics simulation of the Escherichia coli NikR protein: Equilibrium conformational fluctuations reveal interdomain allosteric communication pathways. J Molec Biol. 378:1155–1173.
- Nishizawa M, Nishizawa K. 2008. Molecular dynamics simulation of Kv channel voltage sensor helix in a lipid membrane with applied electric field. Biophysical J. 95:1729–1744.
- Ahern C, Horn R. 2005. Focused electric field across the voltage sensor of potassium channels. Neuron. 48:25–29.
- Dorairaj S, Allen T. 2007. On the thermodynamic stability of a charged arginine side chain in a transmembrane helix. Proc Nat Acad Sci USA. 104:4943–4948.
- MacCallum J, Bennett WFD, Tieleman DP. 2007. Partitioning of amino acid side chains into lipid bilayers: Results from computer simulations and comparison to experiment. J Gen Physiol. 129:371–377.
- Li L, Vorobyov I, Allen TW. 2008. Potential of mean force and pKa profile calculation for a lipid membrane-exposed arginine side chain. J Phys Chem B. 112:9574–9587.
- Marius P, Zagnoni M, Sandison ME, East JM, Morgan H, Lee AG. 2008. Binding of anionic lipids to at least three nonannular sites on the potassium channel KcsA is required for channel opening. Biophys J. 94:1689–1698.
- Williamson IM, Alvis SJ, East JM, Lee AG. 2002. Interactions of phospholipids with the potassium channel KcsA. Biophys J. 83:2026–2038.
- Xu Y, Ramu Y, Lu Z. 2008. Removal of phospho-head groups of membrane lipids immobilizes voltage sensors of K+ channel. Nature. 451:826–829.
- Cuello LG, Cortes DM, Perozo E. 2004. Molecular architecture of the KvAP voltage-dependent K+ channel in a lipid bilayer. Science. 306:491–495.
- Campos F, Chanda B, Roux B, Bezanilla F. 2007. Two atomic constraints unambiguously position the S4 segment relative to S1 and S2 segments in the closed state of Shaker K channel. PNAS. 104:7904–7909.
- Chanda B, Asamoah OK, Blunck R, Roux B, Bezanilla F. 2005. Gating charge displacement in voltage-gated ion channels involves limited transmembrane movement. Nature. 436:852–856.
- Freites JA, Tobias DJ, von Heijne G, White SH. 2005. Interface connections of a transmembrane voltage sensor. PNAS. 102:15059–15064.
- Gonzalez C, Morera FJ, Rosenmann E, Alvarez O, Latorre R. 2005. S3b amino acid residues do not shuttle across the bilayer in voltage-dependent Shaker K+ channels. Proc Natl Acad Sci USA. 102:5020–5025.
- Pathak MM, Yarov-Yarovoy V, Agarwal G, Roux B, Barth P, Kohout S, Tombola F, Isacoff EY. 2007. Closing in on the resting state. Neuron. 56:124–140.
- Bjelkmar P, Niemelä PS, Vattulainen L, Lindahl E. 2009. Conformational changes and slow dynamics through microsecond polarized atomistic molecular simulation of an integral Kv1.2 ion channel. PLoS Computational Biol. 5:c1000289.
- Treptow W, Marrink SJ, Tarek M. 2008. Gating motions in voltage-gated potassium channels revealed by coarse-grained molecular dynamics simulations. J Phys Chem B Lett. 112:3277–3282.
- Labro AJ, Raes AL, Grottesi G, Hoorick D, Sansom MSP, Snyders DJ. 2008. Kv channel gating requires a compatible S4-S5 linker and bottom part of S6, constrained by non-interacting residues. J Gen Physiol. 132:667–680.
- Long SB, Tao X, Campbell EB, MacKinnon R. 2007. Atomic structure of a voltage-dependent K+ channel in a lipid membrane-like environment. Nature. 450:376–382.