Abstract
Palmitoylation is required for the activities of several cancer-associated proteins, making the palmitoyl acyltransferase (PAT) enzymes that catalyze these reactions potential targets for anticancer therapeutics. In this study, we sought to identify and characterize a human PAT with activity toward N-terminally myristoylated and palmitoylated proteins. NIH/3t3 cells were stably transfected with vectors containing no insert, wild type human DHHC20, or a serine-substituted DHHS20 mutant. Compared with control cells, cells overexpressing wild-type DHHC20 displayed an increase in palmitoylation activity toward a peptide that mimics the N-terminus of myristoylated and palmitoylated proteins, but had no change in activity toward a peptide that mimics the C-terminus of farnesylated and palmitoylated proteins. Cells expressing DHHS20 had no significant change in activity toward either peptide. Overexpression of DHHC20 also caused phenotypic changes consistent with cellular transformation, including colony formation in soft agar, decreased contact inhibition of growth, and increased proliferation under low-serum conditions. Quantitative polymerase chain reaction analyses of human tissues demonstrated that DHHC20 is expressed in a tissue-specific manner, and is overexpressed in several types of human tumors, including ovarian, breast and prostate. Overall, these results demonstrate that DHHC20 is a human N-terminal-myristoyl-directed PAT involved in cellular transformation, that may play a role in cancer.
Introduction
Palmitoylation is the covalent attachment of a 16-carbon palmitate group to cysteine residues on a target protein. Like other post- and co-translational lipid modifications, such as farnesylation and myristoylation, palmitoylation plays an integral role in the regulation of intracellular proteins by increasing protein hydrophobicity, regulating subcellular localization, and/or altering protein conformation [Citation1–3]. A number of important signaling proteins, such as the Src-related tyrosine kinases and Ras proteins, require plasma membrane localization to activate their intracellular signaling pathways [Citation4–6]. It has been demonstrated that targeting of these signaling proteins to the plasma membrane is facilitated by post-translational lipidation events, and that blocking the activity of their lipidating enzymes is an effective way to block signaling through these pathways [Citation7,Citation8].
A diverse set of proteins are known to be palmitoylated [Citation6,Citation9,Citation10], several of which can be categorized based on motifs at their site(s) of palmitoylation [Citation9]. One group of palmitoylated proteins, which includes proteins such as H-, N-, and K2A-Ras, contains a C-terminal farnesyl motif [Citation9,Citation10]. In this group, the palmitoylation motif is composed of a post-translationally farnesylated C-terminal cysteine which is required for palmitoylation to occur at a cysteine adjacent to the primary lipidation event, and the attachment of palmitate through a thioester linkage is catalyzed by a palmitoyl acyltransferase (PAT) enzyme [Citation11]. In addition, it has been demonstrated that this palmitoylation event is required to target these proteins to the plasma membrane and allow complete activation [Citation11–13]. A second group of enzymatically palmitoylated proteins contain an N-terminal myristoyl motif. This group, which includes several Src-related kinases such as Lck and Fyn, has a recognition motif composed of an N-terminal myristoylated glycine with an adjacent cysteine residue(s). This myristoylation modification is required for palmitoylation, via a PAT, to occur at cysteines adjacent to the N-terminus [Citation9]. Again, it has been shown that this palmitoylation modification is imperative for the effective localization of these proteins to the plasma membrane as well as their effective signal transduction [Citation14].
Many enzymatically palmitoylated proteins, such as the Ras isotypes and Src-related kinases, are involved in signaling pathways that drive cellular proliferation and survival [Citation15,Citation16]. Since the activity of these proteins is predicated on localization to the plasma membrane, enzymes that catalyze these reactions are attractive targets for novel therapeutics. In fact, enzymes that catalyze the post-translational lipid modifications of Ras are considered particularly interesting targets for anticancer drug development [Citation17]. However, the development of anti-Ras agents has been primarily focused on inhibiting the process of farnesylation. This is mainly due to the fact that farnesyltransferases have been cloned and used in screens to identify inhibitors [Citation18,Citation19]. In contrast, the discovery of inhibitors of enzymatic palmitoylation has been slow, due primarily to difficulties involved in identifying and characterizing human PATs.
However, progress has been made in the area following seminal studies in Saccharomyces cervisiae that identified Erf2/Erf4 [Citation20] and Akr1p [Citation21] as PATs specific for yeast Ras2 and casein kinase2, respectively. These two enzymes were found to share a common Asp-His-His-Cys (DHHC) motif located within a cysteine-rich domain (CRD). In addition, it has been demonstrated that the cysteine residue of the DHHC-motif is required for enzymatic activity through the formation of an acyl-enzyme intermediate [Citation20]. Subsequently, several groups have used homology searching to identify yeast [Citation21–23], protozoan [Citation24] and mammalian PATs [Citation25–31]. However, to date, no human PAT with activity toward the N-terminal myristoyl motif has been identified. In addition, although many N-terminally myristoylated and palmitoylated proteins drive signaling pathways involved in cancer, the role of their palmitoylating enzymes is not well characterized, and there is no direct evidence that PATs specific for this motif are able to cause cellular transformation.
In this study, we sought to assess DHHC20 as a human N-terminal myristoyl-directed PAT, and to examine its role in cellular transformation. DHHC20 was chosen based on sequence homology and intracellular localization considerations. Although PAT activity has been observed in several compartments including the Golgi, trans-Golgi network, and endoplasmic reticulum [Citation32,Citation33], studies conducted by our lab and others point to the plasma membrane as the likely site of N-terminal myristoyl-specific PAT activity in mammalian cells [Citation32,Citation34]. In addition, the vacuole-localized yeast protein Pfa3 has been shown to palmitoylate the N-terminal myristoylated region of Vac8 [Citation22,Citation35]. Human DHHC20 shares significant sequence homology with yeast Pfa3 and displays plasma membrane localization [Citation36]. Thus, this homology and specific intracellular localization makes DHHC20 a human N-terminal myristoyl-directed PAT candidate. Here we use previously described [Citation37] fluorescently labeled peptides that mimic the C-terminal farnesyl and N-terminal myristoyl motifs to demonstrate that DHHC20 is a human PAT with activity toward the N-terminal myristoyl palmitoylation motif. The results also show that DHHC20 is overexpressed in samples from several human tumor tissues, and that overexpression of the gene causes cellular transformation in vitro. These results validate DHHC20 as an interesting new target for the development of anticancer therapeutics.
Materials and methods
Materials
Palmitoyl-CoA, 2-mercaptoethanol (β-ME) and dimethyl sulfoxide (DMSO) were purchased from Sigma. The fluorescent peptides 7-nitro-2-1,3-benzoxadiazol-4-yl (NBD)-CLC(OMe)-Farn, and Myr-GC-(NBD) were synthesized as t-butyl-disulfide-protected precursors by solution-phase chemistry using mild conditions to maintain chemically labile functional groups (e.g., the farnesyl-cysteine thioether linkage), as described previously [Citation38]. The protected peptides (1 mM in DMSO) were stored at −80°C under argon, and deprotected immediately prior to use by incubation with 2-mercaptoethanol/DMSO (2.7:97.3 or 12:88, v/v, respectively) containing 60 mM Tris, pH 8.0 at 55°C for 25 min with agitation. All other reagents were purchased from Sigma unless otherwise stated.
DHHC20 and DHHS20 constructs
Human DHHC20 cDNA (accession # NM_153251) was obtained from Invitrogen in an Ultimate ORF Clone (Catalogue # HORF01, clone I.D. IOH57578). DHHC20 cDNA was cloned into the pDEST-26 mammalian expression vector (Invitrogen) using the Gateway LR Clonase II Enzyme Mix (Invitrogen). The resultant vector was subsequently sequenced to determine integrity of the clone and to verify that the gene was in-frame. The DHHS20 mutant vector was constructed by mutating the resultant DHHC20-pDEST-26 from above using the GeneTailor Site-Directed Mutagenesis System (Invitrogen, #12397-014) utilizing the 5′ primer 5′-TTAAGATGGATCATCACtctCCTTGGGTGAAT and the 3′ primer 5′-GTGATGATCCATCTTAAGAATACATGAGTCACAGGCT (Invitrogen) to convert the cysteine residue of the DHHC20 catalytic domain to a serine. Details of the TOPO cloning reactions, the expression vector, and the mutagenesis reaction can be found at www.invitrogen.com.
Cell culture
All cell culture reagents were obtained from Gibco (Invitrogen) unless otherwise noted. NIH/3t3 cells (ATCC – CRL-1658) were maintained at 37°C in an atmosphere of 5% CO2/95% air in Dulbecco's Modified Eagle's Medium (DMEM) containing 10% bovine serum (BS), 50 µg/ml gentamycin, and 1mM sodium pyruvate.
Generation of stably transfected clones
NIH/3t3 cells were transfected with an expression vector containing the DHHC20 gene insert, DHHS20 mutant gene insert, or an identical vector without the gene. Transfection of the cells was carried out in Opti-MEMI containing 2 µg/ml vector and 2.5 µg/ml Lipofectamine 2000 (Invitrogen) for 5 h at 37°C. Following transfection the cells were maintained in DMEM containing 10% BS without antibiotics for 48 h at 37°C. After 48 h the transfectants were subjected to selection in media containing 800 µg/ml geneticin for 10 days at 37°C in an atmosphere of 5% CO2/95% air. Individual colonies were harvested using sterile cloning disks (Scienceware) and maintained in selection media containing geneticin at a reduced concentration (200 μg/ml). Several colonies transfected with each vector were grown out and subjected to RT-PCR to determine expression of human DHHC20 and mutant human DHHS20.
Reverse transcription assay
Total RNA from NIH/3t3 cells transfected with the non-insert-containing vector (E1 and E2), cells transfected with the DHHC20-containing vector (DC1 and DC3), and cells transfected with the DHHS20-containing vector (DS1 and DS4) was isolated from each clone using the Rneasy RNA isolation kit (Qiagen 74104). 1 µg of total RNA was amplified in each RT-PCR reaction using the one step RT-PCR kit (Qiagen 210210). DHHC20 and DHHS20 mRNA was amplified using primers designed to span multiple introns. The 5′ primer is 5′- GTG GAG CTC TGC GTG TTT ACTA-3′ and the 3′ primer is 5′- CGT GTA TCT GTC AGT TCA TTC GTC C-3′ (Invitrogen). The 511-bp product was resolved on a 1% agarose gel and visualized using ethidium bromide. As a control, 1µg of mRNA from each sample was subjected to amplification under the same conditions using primers specific for 18s RNA. The 5′ primer is 5′ – TTG GAG GGC AAG TCT GGT G-3′ and the 3′ primer is 5′- CCG CTC CCA AGA TCC AAC TA-3′ (Invitrogen). These samples were run on an adjacent agarose gel and visualized as above. It should be noted that a total of nine clones transfected with the DHHC20-containing vector and nine clones transfected with the DHHS20-containing vector were found to be positive for expression of the genes of interest. Of these, clones DS1, DS4, DC1 and DC3 were chosen for further study because they produced the greatest band intensity by RT-PCR.
qPCR of NIH/3t3 clones
Total RNA from NIH/3t3 cells transfected with the non-insert-containing vector (E1 and E2), cells transfected with the DHHC20-containing vector (DC1 and DC3), and cells transfected with the DHHS20-containing vector (DS1 and DS4) was isolated from each clone using the Rneasy RNA isolation kit (Qiagen 74104). RNA from each sample was converted to cDNA using the SuperScript III First-Strand Synthesis System (Invitrogen 18080-051). Quantitative PCR was carried out on the cDNA from each sample using the DHHC20/DHHS20-specific 5′ primer 5′-GTGGAGCTCTGCGTGTTTACTA -3′, DHHC20/DHHS20-specific 3′primer 5′-GAAGCGGGAGATGTGAAAATT-3′, 18s 5′ primer 5′- TTGGAGGGCAAGTCTGGTG-3′, and 18s 3′ primer 5′- CCGCTCCCAAGATCCAACTA-3′ on the MyiQ Single Color Real-Time PCR Detection System (BIO-RAD).
To determine the relative DHHC20/DHHS20 expression of each clone the average Ct value for 18s and DHHC20/DHHS20 of each clone was determined and the % relative expression was calculated using the equation: % relative expression = (2-(ΔCtE – ΔCtE1&2) × 100, where ΔCtE represents the difference in Ct values between 18s and DHHC20/DHHS20 for each individual sample (i.e., E1, E2,DS1, DS4, DC1, DC3) and ΔCtE1&2 represents the average difference in Ct values between 18s and DHHC20/DHHS20 for the two empty vector clones E1 and E2. Thus, the value of % relative expression is relative to the average expression of the E1 and E2 clones, where 100% represents the average value of the two empty-vector clones. It should be noted that empty vector clones, E1 and E2, were able to be used here as 100% expression because there is some amplification of the endogenous mouse DHHC20 that is present in each of these clones. The data shown represents the average relative expression ± SEM for three experiments.
Membrane fractionation
Subcellular fractions were isolated as described previously [Citation38]. Briefly, each clone was grown in 150 mm tissue culture dishes to confluence and collected by centrifugation. The cells were swollen for 30 min on ice in a hypotonic lysis buffer consisting of 10 mM HEPES (pH 7.4), 10 mM KCl, 1.5 mM MgCl2, and 5 µM phenylmethylsulfonyl fluoride (PMSF). The cells were lysed by homogenization through a 21 gauge needle and the nuclei and debris were removed by centrifugation at 5,600 g for 10 min at 4°C. The supernatant was subsequently centrifuged at 100,000 g for 1 h at 4°C. The pellet produced by ultracentrifugation was collected as the membrane fraction and resuspended in lysis buffer for use in the in vitro palmitoylation (IVP) assays.
IVP assay
The IVP assay was performed in a similar fashion to that previously described in several studies [Citation28,Citation37,Citation38]. Briefly, IVP assays using either the NBD-CLC(OMe)-Farn or MyrGC-(NBD) substrates independently consisted of 10 μM deprotected peptide, 100 µM palmitoyl-CoA, 15 µg membrane protein, and acylation buffer (50 mM citrate, 50 mM phosphate, 50 mM Tris, and 50 mM CAPS at pH 7.2) in a total volume of 50 µl. The peptide substrates were preincubated with membrane fractions derived from the indicated cell lines in acylation buffer for 8 min at 37°C with agitation. To start the reaction palmitoyl-CoA was added, gently vortexed, and the mixture was incubated for a further 15 min at 37°C with agitation. The reaction was terminated by addition of 2 ml of CH2Cl2: methanol: water (2:1:1), extracting the peptide into the organic phase. The organic phase was subsequently dried under N2 and stored at −80°C until analyzed by high-performance liquid chromatography (HPLC) as previously described [Citation37,Citation38]. The mass of the peptide palmitoylated in each reaction was determined based on the ratio of the palmitoylated to the total native peptide in each reaction. Enzymatic palmitoylation was calculated by subtracting the amount of background palmitoylation (reactions containing no enzyme) from the amount of total palmitoylated peptide in each assay. The data shown represents the mean ± SEM of four separate experiments. Statistical analyses were performed using the InStat data-analysis program by One-way Analysis of Variance (ANOVA). A value of p ≤ 0.05 was considered statistically significant.
Soft agar assay
Ten-thousand stably transfected human DHHC20-expressing cells (DC1, DC3), DHHS20-expressing cells (DS1, DS4), and non-DHHC20/DHHS20-expressing cells (E1, E2) in exponential growth phase were plated in DMEM containing 10% bovine serum and 0.6% Bacto-Agar (Difco) in 35 mm plates on day 1 and incubated in the atmosphere noted above. Colonies were scored as roughly greater than or equal to 40 cells/colony 21 days later. The data shown represents the mean ± SEM of three separate experiments. Statistical analyses were performed using the InStat data-analysis program by One-way Analysis of Variance (ANOVA). A value of p ≤ 0.05 was considered statistically significant.
Cellular overgrowth assay
Three-hundred-thousand stably transfected human DHHC20-expressing cells (DC1, DC3), mutant DHHS20-expressing cells (DS1, DS4), and non-DHHC20/DHHS20-expressing cells (E1, E2) in the exponential growth phase were plated in each well of a six-well dish in selection media and incubated as noted above. The cells were allowed to grow to confluence and the media was changed every 3–4 days. At 8 days past confluence, the cells were trypsinized and counted on a hemocytometer. The average number of cells per well was determined and the mean of three separate experiments was calculated with the standard error between the trials. Statistical significance was determined using Graphpad InStat by ANOVA, and a value of p ≤ 0.05 was considered statistically significant.
Cellular proliferation assays
Stably transfected human DHHC20-expressing cells (DC1, DC3), mutant DHHS20-expressing cells (DS1, DS4), and non-DHHC20/DHHS20-expressing cells (E1, E2) were plated in 96-well plates (2,000 cells per well) in selection media. Twenty-four hours later the media was removed, cells were washed with PBS, and media containing 1, 2 or 10% bovine serum was added, and fresh media was added to the remaining plates on day 4. At time point zero (day 1) and at 24-h intervals thereafter the cells were fixed with 10% TCA directly added to the culture media. The cells were subsequently washed with water, stained with sulforhodamine B, washed with 1% acetic acid and destained with 10mM Tris. The samples were then analyzed for absorbance at 560 nm using the Spectramax M5 spectrophotometer (Molecular Devices). The mean absorbance of each clone on each day was calculated and the graphs shown are the mean and standard error of four separate experiments. Statistical significance was determined using Graphpad InStat by ANOVA, and a value of p ≤ 0.05 was considered statistically significant.
qPCR of DHHC20 expression in normal and tumor-derived tissue
Human cDNA from multiple normal and tumor tissues was obtained in the Human Cancer Survey TissueScan Real-Time Panel I from Origene (CSRT101). Quantitative PCR was carried out on β-actin-normalized cDNA using a DHHC20-specific Taqman Gene Expression Assay (Applied Biosystems Hs00863895_g1) on the MyiQ Single Color Real-Time PCR Detection System (BIO-RAD). To determine the relative DHHC20 expression between different normal tissues, the average Ct value for each normal tissue group was determined and the % relative expression was calculated using the equation: % relative expression = (2-ΔCt) × 100, where ΔCt represents the difference in Ct for the tissue group vs. the average Ct for all tissue types. To determine the difference in DHHC20 expression between tumor and matched normal tissue, the average Ct value for each normal tissue and tumor-derived group was determined and the % relative expression was calculated using the equation: % relative expression = (2-ΔCt) × 100, where ΔCt represents the difference in Ct for the tumor-derived samples from the Ct for the matched normal tissue samples. The average expression level was calculated from four separate experiments. Each experiment consisted of analyzing one 96-well dish. Each dish contained the cDNA of nine different tumors of each type and three normal tissue samples of each type from different patients. Each plate contained a separate cDNA sample from the same tissue as the other plates. Statistical analyses were performed using the InStat data-analysis program by two-tailed unpaired t-test. A value of p ≤ 0.05 was considered statistically significant.
Results
Expression of human DHHC20 in transfected NIH/3t3 cells
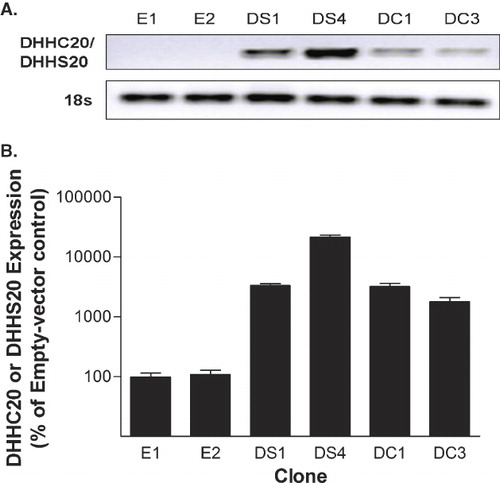
To characterize the activity of DHHC20, vectors with the DHHC20 gene, the mutant DHHS20 gene, or no insert were transfected into NIH/3t3 cells and stable clones were selected. As shown in , DHHC20 and DHHS20 expression was confirmed by RT-PCR analyses of the clonal mRNA. The figure shows that neither the human DHHC20 gene nor the mutant DHHS20 genes are expressed in the empty-vector control clones (E1, E2), whereas the DHHS20 gene is expressed in each of two DHHS20-transfected clones (DS1, DS4), and the Human DHHC20 gene is expressed in each of two DHHC20-transfected clones (DC1, DC3). To quantify the amount of expression, clonal mRNA was converted to cDNA and subjected to qPCR analysis. As shown in , the DS1 and DS4 clones exhibited a 3200% and 21000% higher expression of DHHS20 than the background observed in the empty vector clones, respectively. In addition, the DC1 and DC3 clones were observed to have a 3100% and 1700% higher expression of DHHC20 than the background observed in the empty vector clones, respectively. Thus, these clones can be used to monitor changes in morphologic and phenotypic characteristics caused by the expression of human DHHC20 and mutant human DHHS20. It should also be noted that the expression of DHHC20 was roughly 80% greater in the DC1 clone than in the DC3 clone, and the levels of expression of DHHS20 in both the DS1 and DS4 clones were equal or greater than the expression of DHHC20 in the DC clones.
Figure 1. DHHC20 and DHHS20 mRNA expression in stable NIH/3t3 clones. (A) mRNA from stably transfected 3t3 clones was isolated, reverse transcribed and amplified using primers specific for human DHHC20/DHHS20 and mouse 18s RNA as a loading control. The products were run on a 1% agarose gel and visualized by staining with ethidium bromide. (B) mRNA from stably transfected 3t3 clones was isolated, reverse transcribed, and amplified using primers specific for human DHHC20/DHHS20 and mouse 18s RNA. Amplification and quantification of the products by qPCR was carried out using the MyiQ Single Color Real-Time PCR Detection System.
PAT activity of DHHC20
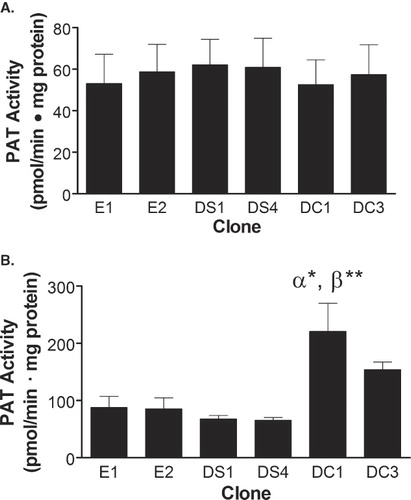
To determine the catalytic PAT activity and substrate-specificity of DHHC20, in vitro palmitoylation (IVP) assays were conducted on membrane fractions collected from each clone. The reactions contained 15 µg of membrane protein, 100 µM palmitoyl-CoA, and 10 µM of either the C-terminal farnesyl-mimicking NBD-CLC(OMe)-Farn or N-terminal myristoyl-mimicking MyrGC-(NBD) peptides, and were conducted under initial velocity conditions. As shown in , there was no statistically significant difference in the PAT activity toward the NBD-CLC(OMe)-Farn peptide among the clones. However, palmitoylation of the MyrGC-(NBD) peptide was significantly elevated when exposed to membrane fractions of DC1 cells compared to the E1, E2, DS1 and DS4 clones. The myristoyl-directed PAT activity of the DC1 clone was 220 ± 49 pmoles peptide palmitoylated per milligram protein per minute, whereas, the control-transfected clone E1 exhibited myristoyl-directed PAT activity of only 87 ± 19 pmoles peptide palmitoylated per milligram protein per minute. This represents a 152% elevation in the palmitoylation of the MyrGC-(NBD) peptide. In addition, the myristoyl-directed PAT activity of the DC3 clone was 153 ± 13. While this was not found to be statistically significantly different than the activities in the control clones, it does represent a 76% elevation in PAT activity. The smaller increase in PAT activity in DC3 compared with DC1 is consistent with the lower expression of the DHHC20 gene in that clone. In contrast, the DHHS20-expressing clones DS1 and DS4 were found to have myristoyl-directed PAT activities of 68 ± 6 and 65 ± 5 respectively, which are slightly, but not statistically significantly, below the values observed in the empty vector control cell lines. It should also be noted that the background palmitoylation of the NBD-CLC(OMe)-Farn and MyrGC-(NBD) peptides in the non-enzyme-containing background controls were 25 ± 6 and 41 ± 8, respectively. Since the enzymatic palmitoylation values noted above for each sample have the background values removed, the signal to noise ratio of the enzymatic samples to the non-enzymatic samples range from a low of 2.6:1 to a high of 6.3:1 depending on the sample in question. This signal to noise ratio is sufficient to distinguish the enzymatic activity from the non-enzymatic background. Overall, these results demonstrate that DHHC20 is a human PAT with enzymatic palmitoylation activity towards the N-terminal myristoyl motif and no detectable activity toward the C-terminal farnesyl motif. Furthermore, the cysteine residue of the DHHC-CRD of DHHC20 is required for this enzymatic PAT activity.
Figure 2. Enzymatic palmitoylation activity of DHHC20. In vitro palmitoylation assays were performed using membrane fractions from each of the indicated clones. The assays consisted of either 10 µM of the NBD-CLC(OMe)-Farn or MyrGC-(NBD) peptides with 100 µM palmitoyl-CoA, 15 µg membrane protein, and acylation buffer in a total volume of 50 µl. The peptide substrates were preincubated with membrane fractions derived from the indicated cell lines in acylation buffer for 8 min at 37°C with agitation. To start the reaction, palmitoyl-CoA was added, gently vortexed, and the mixture was incubated for a further 15 min at 37°C with agitation. Palmitoylated peptides were resolved by HPLC using a reverse phase wide pore butyl column and the amount of the peptide palmitoylated in each reaction was calculated based on the ratio of the palmitoylated to the total native peptide in each reaction. Statistical analyses were performed using ANOVA and the data shown represents the mean of four experiments ± SEM. (α*) indicates p ≤ 0.05 when compared to clone E1, (β**) indicates p ≤ 0.01 when compared to clones E2, DS1 and DS4.
DHHC20-mediated cellular transformation
To determine if the overexpression of DHHC20 can confer anchorage-independent growth, the clones were plated in soft agar and the number of colonies formed per plate was determined 21 days later. As shown in , clones E1, E2, DS1 and DS4 grew an average of 0.3 ± 0.2, 0.2 ± 0.1, 0.4 ± 0.1, and 0.0 ± 0.0 colonies per plate, respectively. In contrast, DC1 and DC3 cells grew an average of 12.7 ± 0.8 and 10.8 ± 0.6 colonies per plate, respectively. Thus, DHHC20-expressing clones produced a 31- and 26-fold increase in soft agar colony formation when compared to the greatest amount produced in any control clone. In addition, neither DHHS20-expressing clone produced a significant increase in colony formation. These data indicate that DHHC20 allows cells to grow in an anchorage-independent manner, whereas, expression of DHHS20 does not confer this phenotypic characteristic.
Figure 3. DHHC20 expression induces transformation of NIH/3t3 cells. (A) Suspensions of each clone in exponential growth phase were plated in DMEM containing 0.33% Bacto-Agar overlaid in 35 mm plates with 0.6% agar gel. The cells were incubated for 21 days and colonies were counted. (B) Clones in exponential growth were plated in each well of a six-well dish in selection media. The media was changed every 3–4 days, and at 8 days past confluence the cells were counted on a hemocytometer. The average number of colonies or cells per plate for each cell line was determined. The data represent the mean ± SEM from three separate experiments. (**) indicates p ≤ 0.01 when compared to clones E1, E2, DS1 and DS4 in . In , (α**) indicates p ≤ 0.01 as compared to clones E1 and E2, (β***) indicates p ≤ 0.001 as compared to clones DS1 and DS4, (χ*) indicates p ≤ 0.05 as compared to clone DS1, and (δ**) indicates p ≤ 0.01 as compared to clone DS4.
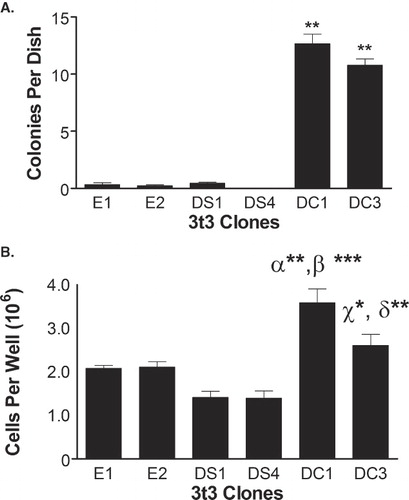
The effects of expression of DHHC20 on contact inhibition of cell growth were also assessed. As shown in , clones E1 and E2 produced an average of 2.1 ± 0.1 × 10⁶ cells per well 8 days following confluence. In contrast, clones DS1 and DS4 produced only an average of 1.4 ± 0.1 × 10⁶ and 1.4 ± 0.2 × 10⁶ cells per well each, representing a 33% decrease in cells per well with the expression of DHHS20 when compared to the control cells. However, clones DC1 and DC3 produced an average of 3.6 ± 0.3 × 10⁶ and 2.6 ± 0.3 × 10⁶ cells per well, respectively. This represents a 73% and 25% increase in the average number of cells per well with the expression of DHHC20 when compared to the controls, and is consistent with higher DHHC20 expression in the DC1 clone. Overall, these data demonstrate that NIH/3t3 cells overexpressing human DHHC20 are able to proliferate past saturation; whereas, cells expressing the DHHS20 mutant are not able to grow past confluence.
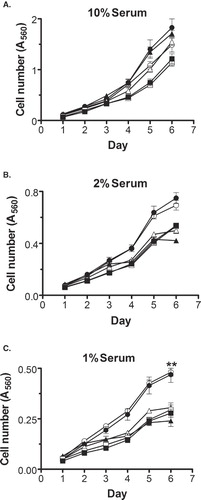
The ability to proliferate in serum-deprived conditions is another phenotypic characteristic of cellular transformation. To determine if DHHC20 allows an increase in cellular proliferation, each clone was grown in media containing reduced (1% or 2%) or standard (10%) bovine serum over the course of 6 days. Samples were fixed each day and stained with SRB to quantify the accumulation of cells over time (). As shown in , clones expressing DHHC20 and DHHS20 proliferate slightly more rapidly than the control cells in a standard 10% serum environment. However, as the amount of serum in the media was decreased to 2% () and 1% (), DHHS20-expressing cells became indistinguishable from the control cells. In contrast the DHHC20-expressing cells proliferated significantly more rapidly than the other cell lines. Thus, it appears that DHHC20 facilitates proliferation, particularly under reduced-serum conditions; whereas, DHHS20 does not affect proliferation under these conditions. Overall, these results demonstrate that the expression of DHHC20 induces phenotypic characteristics associated with cellular transformation; whereas, DHHS20 expression does not.
Figure 4. DHHC20 expression causes elevated proliferation in NIH/3t3 cells. E1 (-▪-), E2 (-□-), DS1 (-▴-), DS4 (-▵-), DC1 (-•-) or DC3 (-○-) cells were seeded onto 96-well plates (2,000 cells/well) in standard media on day 0. On day 1, the media was changed to DMEM containing 10% (A), 2% (B), or 1% (C) Bovine Serum. Plates were fixed at 24-h intervals and subjected to SRB staining and an absorbance reading at 560 nm. The data shown is the mean ± SEM of the absorbance at each time point for four separate experiments. (**) indicates p ≤ 0.01 compared to clones E1, E2, DS1 and DS4.
Expression of DHHC20 in human tissue samples
As noted previously, palmitoylated proteins play an integral role in driving proliferation and survival signaling pathways in cancer cells. In addition, palmitoylation of these proteins is required for proper cellular localization and full activation. Therefore, proteins that drive the palmitoylation of these targets have the potential to be oncogenic or to facilitate oncogenic growth driven through these pathways. This appears to be the case since overexpression of the C-terminal farnesyl-directed PAT DHHC17 [Citation28] and, as shown above, the N-terminal myristoyl-directed PAT DHHC20 cause transformation of NIH/3t3 cells. Therefore, it appears likely that DHHC20 could play a role in human cancer as well. To determine the expression pattern of the gene in humans, we analyzed transcript levels from several normal and tumor tissues by quantitative-PCR. As shown in , DHHC20 (normalized to β-actin) shows a tissue-specific pattern of expression, with transcript levels varying greatly between tissue types. The normalized expression of DHHC20 in prostate tissue is nearly 750% higher than expression in ovarian tissue, and roughly 650% higher than breast tissue. In addition, DHHC20 is expressed in colon tissue at levels roughly 600% and 500% greater than those observed in breast and ovarian tissue, respectively. Overall, these results indicate that DHHC20 is expressed at relatively low levels in ovary, breast and kidney tissues, and at relatively high levels in thyroid, liver, colon and prostate tissue.
Figure 5. Expression of DHHC20 in normal human tissue and tumors. Lyophilized β-actin-normalized cDNA obtained in a 96-well format from Origene Technologies was amplified using a DHHC20-specific primer/probe. (A) Comparative expression of DHHC20 in normal tissue samples. The average Ct value for each tissue group was determined, and the % relative expression was calculated using the equation: % relative expression = (2-ΔCt) × 100, where ΔCt represents the difference in Ct for the tissue group vs. the average Ct for all tissue types. (B) Expression of DHHC20 in tumor vs. matched normal tissue. The average Ct value for each normal tissue and tumor-derived group was determined, and the % relative expression was calculated using the equation: % relative expression = (2 -ΔCt) × 100, where ΔCt represents the difference in Ct for the tumor-derived samples from the Ct for the normal tissue samples. Values represent the mean ± SEM of four experiments. For Panel B, (*) indicates p ≤ 0.05 and (**) indicates p ≤ 0.01.
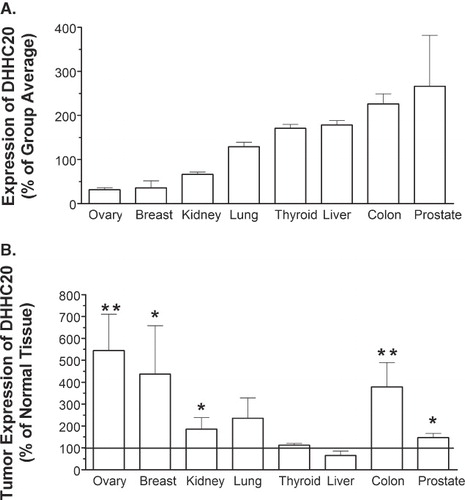
To determine if the expression of DHHC20 is modified in tumor tissue, the transcript levels in tumors were compared to those of matched normal tissues in . The results indicate that DHHC20 expression is elevated at the transcript level in a number of tumor tissues. Statistically significant overexpression of the gene is observed in prostate, kidney, colon, breast, and ovarian tumors, reaching as high as 540% of normal levels in the ovarian tumors. Overall, these results indicate that DHHC20 expression is greatly elevated in several types of human tumors.
Discussion
Post-translational lipidation events are important mediators of the proper localization and activity of many signaling proteins [Citation2–6]. Because of the critical roles of these proteins in important signaling pathways such as cellular activation, survival and proliferation, inhibition of the enzymatic lipidation of these proteins has been considered an attractive area for novel drug development. To date, the majority of effort has focused on the development of farnesyltransferase inhibitors. Inhibitors of PATs have not been developed because the enzymes that catalyze these reactions have not been fully identified and characterized, although significant progress has been made recently [Citation1,Citation2]. This progress can be traced back to the identification of Erf2/Erf4 and Akr1p in yeast as PATs specific for Ras2 [Citation20] and casein kinase2 [Citation21], respectively. These two enzymes share a conserved Asp-His-His-Cys (DHHC) domain that was hypothesized to represent a signature catalytic motif for PATs. This domain has provided the starting point for the identification of mammalian PATs [Citation25–30]. However, while many PATs have been identified, the majority of studies conducted to identify PATs with activity toward N-terminally myristoylated and palmitoylated proteins have primarily focused on mouse genes [Citation26,Citation27]. In addition, although many palmitoylated proteins drive signaling pathways involved in cancer, only DHHC17, a C-terminal farnesyl-directed PAT, has been directly shown to cause cellular transformation [Citation28]. Therefore, in this study we sought to identify the first human N-terminal myristoyl-directed PAT and to assess its potential role in cancer by determining its ability cause cellular transformation in vitro and its pattern of expression in human tissues and tumors.
In the current study, we used fluorescently-labeled lipopeptides to characterize the PAT activity of DHHC20. Lipopeptides that mimic protein palmitoylation sites have proven to be useful tools for the analysis of protein trafficking, localization, membrane interactions as well as PAT activity [Citation39–41]. The current data, generated using these peptides, clearly indicate that human DHHC20 causes an elevation in the palmitoylation of the Myr-GC-(NBD) peptide with no significant affect on the level of palmitoylation of the (NBD)-CLC(OMe)-Farn peptide. In addition, it was determined that the mutant human DHHS20 had no significant affect on the level of palmitoylation of either peptide. Overall, this data indicates that DHHC20 is a PAT with activity toward substrates containing the N-terminal myristoyl palmitoylation motif, and supports previous findings that the cysteine of the DHHC sequence is necessary for catalytic PAT activity [Citation20]. The N-terminal myristoyl palmitoylation motif occurs in several proteins such as the Src-related tyrosine kinases and some Gα subunits. Since DHHC20 and all previously identified PATs in yeast and mammals show specificity toward particular substrates, it appears that specific structural components of the substrate protein (or peptide) are recognized by the PATs. Furthermore, this confirms that different PATs are responsible for the palmitoylation of proteins expressing the C-terminal farnesyl or the N-terminal myristoyl motif as we previously hypothesized on the basis of differential stability and pharmacologic sensitivities of the enzymatic activities toward the lipopeptide substrates [Citation37,Citation42].
To determine if overexpression of DHHC20 promotes cellular transformation, we expressed the gene as well as the mutated DHHS20 gene in NIH/3t3 cells and monitored the cells for phenotypic changes. The results indicate that cells expressing the catalytically inactive DHHS20 were unable to grow in soft agar or grow beyond confluence, whereas cells expressing DHHC20 were able to. An anchorage-independent growth pattern and growth beyond confluence are both phenotypic characteristics associated with cellular transformation, indicating that overexpression of DHHC20 is sufficient to cause transformation of NIH/3t3 cells in vitro, whereas the enzymatically inactive DHHS20 is unable to cause cellular transformation.
Delving more deeply into the data provided by , three points are of particular interest. First, clone DC1 produces a much larger number of cells in the overgrowth assay than clone DC3. This is likely due to the difference in expression of DHHC20 in the two clones, as qPCR data from illustrates that clone DC1 expresses 80% more DHHC20 than clone DC3. It should also be noted that the overgrowth assays had to be halted at 8 days past confluence because the DC1 and DC3 clones began to slough off the plates in large sheets beyond that point, whereas the other clones did not. Thus, the difference observed in the overgrowth assay may be under represented. Second, it is interesting to note that the cell lines expressing DHHS20 both accumulated fewer cells in the overgrowth assay than did the control cell lines, which suggests that the expression of this mutated gene makes NIH/3t3 cells more susceptible to contact inhibition of growth. This phenotypic characteristic could be due to the ability of DHHS20 to bind to target proteins without the ability to catalyze their palmitoylation, thus preventing their palmitoylation by native PATs within the cells to a degree that increases the susceptibility of the cells to contact inhibition. Lastly, while each of the DHHC20-expressing clones produced significantly increased numbers of colonies when grown in soft agar compared to the control lines, only roughly 11 colonies were produced per 10,000 cells, which represents 0.11% of the population. In contrast, the classic oncogene v-src produces colonies from 65% of cells when overexpressed alone in NIH/3t3 cells [Citation43]. However, not all oncogenes produce large numbers of colonies in soft agar when overexpressed alone. For example, the gene bcr-abl does not produce colonies in NIH/3t3 cells when overexpressed alone; however, when overexpressed in conjunction with the IL-3 receptor colonies are formed [Citation44]. In addition, the percent of cells that form colonies when overexpressing DHHC20 is comparable to the amount observed when overexpressing the farnesyl-directed PAT oncogene HIP14 [Citation28]. Overall, the data demonstrates that expression of human DHHC20 in NIH/3t3 cells produces a statistically significant increase in anchorage-independent growth and proliferation beyond confluence, both hallmarks of cellular transformation.
The cellular proliferation studies demonstrate that expression of DHHC20 causes an elevation in proliferation particularly in low-serum environments, whereas expression of the enzymatically inactive mutant DHHS20 does not produce this elevation of proliferation. These results suggest that the enzymatic PAT activity of DHHC20 promotes the activation of signaling pathways that drive cellular proliferation, and are consistent with the phenotypic characteristics produced by activation of many N-terminal myristoyl-motif-containing proteins, particularly the Src-related tyrosine kinases. For example, activation of these kinases drives cellular proliferation, inhibition of apoptosis, and transformation [Citation16,Citation45,Citation46]. Thus, it appears likely that DHHC20 drives cellular proliferation and transformation by palmitoylating N-terminally myristoylated substrate proteins, such as one or more of the Src-related tyrosine kinases. The particular cellular substrates of DHHC20 remain to be identified.
To further characterize DHHC20, we sought to determine its expression in normal human tissue and tumors. Quantitative PCR studies demonstrated that DHHC20 has a tissue-specific expression pattern. Organs such as the thyroid, liver, colon and prostate express relatively high levels of DHHC20; whereas, DHHC20 is expressed at relatively low levels in the ovary and breast. This tissue-specific expression runs contrary to the ubiquitous expression pattern exerted by some DHHC genes such as DHHC4, DHHC 5, DHHC 7, and DHHC 10, but is consistent with previous findings for DHHC20 and some others within the family [Citation36]. Particularly, Ohno et al. observed that DHHC20 was expressed at high levels in the testis and placenta, at somewhat lower levels in the brain, heart, liver, lungs, thymus and leukocytes, and was not expressed at all in skeletal muscle and the small intestine. These results corroborate our findings of DHHC20 expression in the lung and liver. In addition, it is interesting to note that Ohno et al. observed the highest expression of DHHC20 in highly proliferating and differentiating tissues such as the testis and placenta. They also found that DHHC20 was expressed in certain tissues, such as leukocytes and brain tissues that specifically overlap with the expression pattern of some Src-related tyrosine kinases, such as Lyn, Hck, Fgr, Blk and Lck that are not ubiquitously expressed (reviewed in [Citation47]). In addition, we herein demonstrate that DHHC20 expression is significantly upregulated in ovarian, breast, colon, kidney and prostate tumors in comparison with organ-matched normal tissues. Of these, the greatest increases were observed in ovarian, breast and colon tumors. Interestingly, exploration of pathology reports associated with the ovarian and breast tumor samples demonstrated no correlation between the expression of DHHC20 and the expression of HER2 (data not shown) suggesting that the expression of the gene and activity of its product are independent of HER2. This is not surprising considering many potential targets of DHHC20 are tumorigenic and potently transforming when constitutively activated in breast cancer with or without an overexpression of HER2 [Citation48,Citation49]. It is also of interest to note that several potential targets of DHHC20 palmitoylation, such as Lck and Yes, have elevated expression and activity in colorectal carcinomas as well as their metastases [Citation50–53]. Overall, these findings show that human DHHC20 is expressed in a tissue-specific manner and expression is upregulated in several tumor tissues in a pattern seemingly consistent with the expression of its likely intracellular targets. These results implicate DHHC20 in the development of human cancer and give further evidence linking the gene with its potential enzymatic targets.
In conclusion, we have identified DHHC20 as the first human PAT with activity toward N-terminally myristoylated proteins. Also, expression of the gene in NIH/3t3 cells caused an increase in proliferation as well as cellular transformation, as evidenced by reduced contact inhibition of growth and growth in soft agar. In addition, we have determined that DHHC20 is expressed in a tissue-specific manner and that the gene is overexpressed in several human tumors including breast, ovary and colon, implicating it not only in cellular transformation, but also in the development of human cancer. Each of the phenotypic characteristics caused by the expression of DHHC20 is consistent with those produced by the activity of N-terminally myristoylated Src-related tyrosine kinases, suggesting that DHHC20 functions by activating one or more of these kinases. These results make N-terminal myristoyl-directed PATs, and DHHC20 in particular, interesting targets for the development of novel anticancer therapeutics.
Acknowledgements
We would also like to thank Dr Zuping Xia for his work synthesizing the peptides used in the IVP assays, and Dr Carola Neumann for her help in conducting the soft agar assays.
Declaration of interest: Financial support was provided by National Institutes of Health Grant 2 RO1 CA075248 (CDS). The authors report no conflicts of interest. The authors alone are responsible for the content and writing of the paper.
References
- Resh MD. 2006. Palmitoylation of ligands, receptors, and intracellular signaling molecules. Sci STKE 2006359:re14.
- Linder ME,Deschenes RJ. 2007. Palmitoylation: policing protein stability and traffic. Nat Rev Mol Cell Biol 81:74–84.
- Greaves J,Chamberlain LH. 2007. Palmitoylation-dependent protein sorting. J Cell Biol 1763:249–54.
- Milligan G, Parenti M, Magee AI. 1995. The dynamic role of palmitoylation in signal transduction. Trends Biochem Sci 205:181–187.
- Dudler T,Gelb MH. 1996. Palmitoylation of Ha-Ras facilitates membrane binding, activation of downstream effectors, and meiotic maturation in Xenopus oocytes. J Biol Chem 27119:11541–11547.
- Mumby SM. 1997. Reversible palmitoylation of signaling proteins. Curr Opin Cell Biol 92:148–154.
- Kosugi A, Hayashi F, Liddicoat DR, Yasuda K, Saitoh S, Hamaoka T. 2001. A pivotal role of cysteine 3 of Lck tyrosine kinase for localization to glycolipid-enriched microdomains and T cell activation. Immunol Lett 762:133–138.
- Gelb MH, Brunsveld L, Hrycyna CA, Michaelis S, Tamanoi F, Van Voorhis WC, Waldmann H. 2006. Therapeutic intervention based on protein prenylation and associated modifications. Nat Chem Biol 210:518–528.
- Resh MD. 1999. Fatty acylation of proteins: new insights into membrane targeting of myristoylated and palmitoylated proteins. Biochim Biophys Acta 14511:1–16.
- Resh MD. 1996. Regulation of cellular signalling by fatty acid acylation and prenylation of signal transduction proteins. Cell Signal 86:403–412.
- Hancock JF, Magee AI, Childs JE, Marshall CJ. 1989. All ras proteins are polyisoprenylated but only some are palmitoylated. Cell 577:1167–1177.
- Eungdamrong NJ,Iyengar R. 2007. Compartment-specific feedback loop and regulated trafficking can result in sustained activation of Ras at the Golgi. Biophys J 923:808–815.
- Pechlivanis M, Kuhlmann J. 2006. Hydrophobic modifications of Ras proteins by isoprenoid groups and fatty acids – more than just membrane anchoring. Biochim Biophys Acta 176412:1914–1931.
- Sandilands E, Brunton VG, Frame MC. 2007. The membrane targeting and spatial activation of Src, Yes and Fyn is influenced by palmitoylation and distinct RhoB/RhoD endosome requirements. J Cell Sci 120Pt 15:2555–2564.
- Downward J. 2003. Targeting RAS signalling pathways in cancer therapy. Nat Rev Cancer 31:11–22.
- Shi M, Cooper JC, Yu CL. 2006. A constitutively active Lck kinase promotes cell proliferation and resistance to apoptosis through signal transducer and activator of transcription 5b activation. Mol Cancer Res 41:39–45.
- Leonard DM. 1997. Ras farnesyltransferase: a new therapeutic target. J Med Chem 4019:2971–2990.
- Chen WJ, Andres DA, Goldstein JL, Russell DW, Brown MS. 1991. cDNA cloning and expression of the peptide-binding beta subunit of rat p21ras farnesyltransferase, the counterpart of yeast DPR1/RAM1. Cell 662:327–334.
- Kohl NE, Mosser SD, deSolms SJ, Giuliani EA, Pompliano DL, Graham SL, Smith RL, Scolnick EM, Oliff A, Gibbs JB. 1993. Selective inhibition of ras-dependent transformation by a farnesyltransferase inhibitor. Science 2605116:1934–1937.
- Lobo S, Greentree WK, Linder ME, Deschenes RJ. 2002. Identification of a Ras palmitoyltransferase in Saccharomyces cerevisiae. J Biol Chem 27743:41268–41273.
- Roth AF, Feng Y, Chen L, Davis NG. 2002. The yeast DHHC cysteine-rich domain protein Akr1p is a palmitoyl transferase. J Cell Biol 1591:23–28.
- Smotrys JE, Schoenfish MJ, Stutz MA, Linder ME. 2005. The vacuolar DHHC-CRD protein Pfa3p is a protein acyltransferase for Vac8p. J Cell Biol 1707:1091–1099.
- Valdez-Taubas J, Pelham H. 2005. Swf1-dependent palmitoylation of the SNARE Tlg1 prevents its ubiquitination and degradation. Embo J 2414:2524–2532.
- Emmer BT, Souther C, Toriello KM, Olson CL, Epting CL, Engman DM. 2009. Identification of a palmitoyl acyltransferase required for protein sorting to the flagellar membrane. J Cell Sci 122(Pt 6):867–874.
- Buglino JA, Resh MD. 2008. Hhat is a palmitoylacyltransferase with specificity for N-palmitoylation of Sonic Hedgehog. J Biol Chem 28332:22076–22088.
- Fernandez-Hernando C, Fukata M, Bernatchez PN, Fukata Y, Lin MI, Bredt DS, Sessa WC. 2006. Identification of Golgi-localized acyl transferases that palmitoylate and regulate endothelial nitric oxide synthase. J Cell Biol 1743:369–377.
- Fukata M, Fukata Y, Adesnik H, Nicoll RA, Bredt DS. 2004. Identification of PSD-95 palmitoylating enzymes. Neuron 446:987–996.
- Ducker CE, Stettler EM, French KJ, Upson JJ, Smith CD. 2004. Huntingtin interacting protein 14 is an oncogenic human protein: palmitoyl acyltransferase. Oncogene 2357:9230–9237.
- Swarthout JT, Lobo S, Farh L, Croke MR, Greentree WK, Deschenes RJ, Linder ME. 2005. DHHC9 and GCP16 constitute a human protein fatty acyltransferase with specificity for H- and N-Ras. J Biol Chem 28035:31141–31148.
- Sharma C, Yang XH, Hemler ME. 2008. DHHC2 affects palmitoylation, stability, and functions of tetraspanins CD9 and CD151. Mol Biol Cell 19:3415–3425.
- Zhang J, Planey SL, Ceballos C, Stevens SM, Jr., Keay SK, Zacharias DA. 2008. Identification of CKAP4/p63 as a major substrate of the palmitoyl acyltransferase DHHC2, a putative tumor suppressor, using a novel proteomics method. Mol Cell Proteomics 77:1378–1388.
- Dunphy JT, Greentree WK, Manahan CL, Linder ME. 1996. G-protein palmitoyltransferase activity is enriched in plasma membranes. J Biol Chem 27112:7154–7159.
- Liu L, Dudler T, Gelb MH. 1996. Purification of a protein palmitoyltransferase that acts on H-Ras protein and on a C-terminal N-Ras peptide. J Biol Chem 27138:23269–23276.
- Draper JM, Xia Z, Smith CD. 2007. Cellular palmitoylation and trafficking of lipidated peptides. J Lipid Res 488:1873–1884.
- Hou H, Subramanian K, LaGrassa TJ, Markgraf D, Dietrich LE, Urban J, Decker N, Ungermann C. 2005. The DHHC protein Pfa3 affects vacuole-associated palmitoylation of the fusion factor Vac8. Proc Natl Acad Sci USA 10248:17366–17371.
- Ohno Y, Kihara A, Sano T, Igarashi Y. 2006. Intracellular localization and tissue-specific distribution of human and yeast DHHC cysteine-rich domain-containing proteins. Biochim Biophys Acta 17614:474–483.
- Varner AS, Ducker CE, Xia Z, Zhuang Y, De Vos ML, Smith CD. 2003. Characterization of human palmitoyl-acyl transferase activity using peptides that mimic distinct palmitoylation motifs. Biochem J 373(Pt 1): 91–99.
- Varner AS, De Vos ML, Creaser SP, Peterson BR, Smith CD. 2002. A fluorescence-based high performance liquid chromatographic method for the characterization of palmitoyl acyl transferase activity. Anal Biochem 3081:160–167.
- Schroeder H, Leventis R, Shahinian S, Walton PA, Silvius JR. 1996. Lipid-modified, cysteinyl-containing peptides of diverse structures are efficiently S-acylated at the plasma membrane of mammalian cells. J Cell Biol 1343:647–660.
- Creaser SP, Peterson BR. 2002. Sensitive and rapid analysis of protein palmitoylation with a synthetic cell-permeable mimic of SRC oncoproteins. J Am Chem Soc 12411:2444–2445.
- Peters C, Wagner M, Volkert M, Waldmann H. 2002. Bridging the gap between cell biology and organic chemistry: chemical synthesis and biological application of lipidated peptides and proteins. Naturwissenschaften 899:381–390.
- Ducker CE, Griffel LK, Smith RA, Keller SN, Zhuang Y, Xia Z, Diller JD, Smith CD. 2006. Discovery and characterization of inhibitors of human palmitoyl acyltransferases. Mol Cancer Ther 57:1647–1659.
- Shalloway D, Coussens PM, Yaciuk P. 1984. Overexpression of the c-src protein does not induce transformation of NIH 3T3 cells. Proc Natl Acad Sci USA 8122:7071–7075.
- Tao WJ, Lin H, Sun T, Samanta AK, Arlinghaus R. 2008. BCR-ABL oncogenic transformation of NIH 3T3 fibroblasts requires the IL-3 receptor. Oncogene 2722:3194–3200.
- Meyn MA, 3rd, Wilson MB, Abdi FA, Fahey N, Schiavone AP, Wu J, Hochrein JM, Engen JR, Smithgall TE. 2006. Src family kinases phosphorylate the Bcr-Abl SH3-SH2 region and modulate Bcr-Abl transforming activity. J Biol Chem 28141:30907–30916.
- Pecquet C, Nyga R, Penard-Lacronique V, Smithgall TE, Murakami H, Regnier A, Lassoued K, Gouilleux F. 2007. The Src tyrosine kinase Hck is required for Tel-Abl- but not for Tel-Jak2-induced cell transformation. Oncogene 2611:1577–1585.
- Thomas SM, Brugge JS. 1997. Cellular functions regulated by Src family kinases. Annu Rev Cell Dev Biol 13:513–609.
- Belsches-Jablonski AP, Biscardi JS, Peavy DR, Tice DA, Romney DA, Parsons SJ. 2001. Src family kinases and HER2 interactions in human breast cancer cell growth and survival. Oncogene 2012:1465–1475.
- Reissig D, Clement J, Sanger J, Berndt A, Kosmehl H, Bohmer FD. 2001. Elevated activity and expression of Src-family kinases in human breast carcinoma tissue versus matched non-tumor tissue. J Cancer Res Clin Oncol 1274:226–230.
- Han NM, Curley SA, Gallick GE. 1996. Differential activation of pp60(c-src) and pp62(c-yes) in human colorectal carcinoma liver metastases. Clin Cancer Res 28:1397–1404.
- Nakamura K, Chijiiwa Y, Nawata H. 1996. Augmented expression of LCK message directed from the downstream promoter in human colorectal cancer specimens. Eur J Cancer 32A8:1401–1407.
- Park J, Meisler AI, Cartwright CA. 1993. c-Yes tyrosine kinase activity in human colon carcinoma. Oncogene 810:2627–2635.
- Veillette A, Foss FM, Sausville EA, Bolen JB, Rosen N. 1987. Expression of the lck tyrosine kinase gene in human colon carcinoma and other non-lymphoid human tumor cell lines. Oncogene Res 14:357–374.