Abstract
To operate as a rotary motor, the ATP-hydrolyzing domain of the vacuolar H+-ATPase must be connected to a fixed structure in its membrane-bound proton pump domain by a mechanical stator. Although low-resolution structural data and spectroscopic analysis indicate that a filament-like subunit E/subunit G heterodimer performs this role, more detailed information about the relative arrangement of these subunits is limited. We have used a site-directed cross-linking approach to show that, in both bacterial and yeast V-type ATPases, the N-terminal α-helical segments of the G and E subunits are closely aligned over a distance of up to 40 Å. Furthermore, cross-linking coupled to mass spectrometry shows that the C-terminal end of G is anchored at the C-terminal globular domain of subunit E. These data are consistent with a stator model comprising two ∼ 150 Å long parallel α-helices linked to each other at both ends, stabilized by a coiled-coil arrangement and capped by the globular C-terminal domain of E that connects the cytoplasmic end of the helical structure to the V-ATPase catalytic domain.
Introduction
Vacuolar H+-ATPases (V-ATPases) are multisubunit membrane complexes that couple ATP hydrolysis to transmembrane proton movement in virtually all eukaryotic cells (Forgac Citation2007). The complex plays a key role in the acidification of endosomal compartments, and can act as an acid efflux pump at the plasma membrane (Forgac Citation2007). A primitive V-ATPase is also responsible for ATP-driven cation transport across the plasma membrane of prokaryotes such as the Gram positive bacterium Enterococcus hirae (Murata et al. Citation2005). Although it shares bi-domain architecture and rotational mechanism with those of the F1F0-ATPase (F-ATPase), the ∼ 900 kDa eukaryotic V-ATPase is significantly larger and more complicated, containing at least 29 individual polypeptides encoded by 14 genes. The cytoplasmic domain V1 has the subunit stoichiometry A3B3CDE3FG3H (Kitagawa et al. Citation2008): ATP hydrolysis takes place in the A3B3 hexamer, and subunits C-H make up a network of stalks that link V1 to the membrane domain V0. Within the V0 domain subunits a, d and e are linked to a decameric ring of c subunits (Murata et al. Citation2005). According to mechanistic models, ATP hydrolysis by V1 generates torque that spins a rotor that comprises of subunits D, F and d coupled to the c-ring in the membrane (Yokoyama et al. Citation2003). Movement of the c-ring relative to subunit a drives proton translocation (Nishi and Forgac Citation2002, Yokoyama et al. Citation2003), but can only occur if subunit a is fixed to A3B3 via a stator. Although a single peripheral stalk fulfils the stator function in the F-ATPase (Rubinstein et al. Citation2003), three-dimensional reconstructions of eukaryotic V-ATPases from electron microscopy data show the presence of three peripheral stalks that could act as stators (Diepholz et al. Citation2008, Zhang et al. Citation2008, Muench et al. Citation2009). These stators do not contact V0 directly, but instead anchor subunit a to the ATPase motor via a horizontal collar formed by the regulatory subunits C and H, and the soluble cytoplasmic domain of subunit a (Diepholz et al. Citation2008, Zhang et al. Citation2008, Muench et al. Citation2009). Archaebacterial A1A0-ATPases and prokaryotic V-ATPases lack homologues of C and H, and appear to have a two-stator motor structure (Bernal and Stock Citation2004, Vonck et al. Citation2009).
According to current models, each stator stalk consists of one E and one G subunit; biophysical studies indicate that the isolated EG complex is a filament containing extended α-helices with dimensions that fit the stator electron densities visible in three-dimensional reconstructions (Féthière et al. Citation2004, Kish-Trier et al. Citation2008, Yamamoto et al. Citation2008). Cross-linking and protein interaction studies indicate that the N-terminal end of E contacts subunits C (Féthière et al. Citation2005, Inoue and Forgac Citation2005, Jones et al. Citation2005) and H (Lu et al. Citation2002, Féthière et al. Citation2005) in the horizontal collar and that, in addition to binding strongly to E, subunit G binds to the soluble domain of subunit a (Landolt-Marticorena et al. Citation2000, Qi and Forgac Citation2008). NMR spectroscopy studies using peptides corresponding to regions of yeast subunits E and G have underlined the importance of the residue 18-38 region of E in binding the N-terminal segment of G (Rishikesan et al. Citation2008). Similar approaches, but using the EG homologues from the A1A0-ATPase, also indicate interactions between these subunits via both their N- and C-termini (Gayen et al. Citation2008, Kish-Trier et al. Citation2008). In this study we have used chemical and disulphide cross-linking to map specific contacts between the E and G subunits, using both a recombinant system comprising only NtpE and NtpF, the E and G homologues respectively from Enterococcus hirae, and the fully-assembled yeast V-ATPase. Specific interactions identified using this approach provide constraints for a detailed and accurate model of the EG stator in both bacterial and eukaryotic V-ATPases.
Methods
Cloning, mutagenesis and expression
Co-expression of NtpEF
NtpE and NtpF were cloned by PCR from Enterococcus hirae (strain ATCC 9790) genomic DNA using the method described in (Pospiech and Neumann Citation1995). Initially, PCR products were subcloned into the topoisomerase-activated plasmid pCR-II-Blunt (Invitrogen). For co-expression of NtpE/NtpF, cDNAs were modified by PCR to include 5′ Bam HI and 3′ Not I restriction sites in the NtpE cDNA and 5′ Nde I and 3′ Kpn I restriction sites in the NtpF cDNA, allowing ligation of both cDNAs into the pRSF-Duet expression vector (Novagen). Further, an in-frame His6 tag was placed at the N-terminus of NtpE. Site-directed mutagenesis of the NtpE cDNAs was carried out by the QuikChange method (Stratagene). Because the efficiency of QuikChange mutagenesis of NtpF proved to be very low (presumably due to the relatively low G/C content in this part of the coding sequence), cysteine mutants in NtpF were generated using either QuikChange or by the method of Landt et al. (Citation1990) with the NtpF cDNA in pCR-II as template. Primers used for the modification and mutagenesis of NtpE and NtpF are listed in Supplementary Table S1 (online version only). The Escherichia coli strain BL21 (DE3) was transformed by pRSF-Duet constructs, and transformants were grown in media containing kanamycin (50 μg ml-1) for selection. Co-expression of NtpEF was induced with IPTG (1 mM) when the cell density reached an OD600 of 0.6. Cultures were incubated for a further 5 h at 37°C before the cells were harvested and disrupted by extrusion through a French pressure cell. The lysate was centrifuged at 100,000 g, and the supernatant was passed through Talon Co2+-NTA affinity resin (Clontech) equilibrated in Buffer A (50 mM Tris-HCl pH 8.0, 300 mM NaCl). The resin was washed with Buffer A supplemented with 20 mM imidazole before the His6-tagged NtpE was eluted with Buffer A containing 250 mM imidazole. Eluted protein was concentrated centrifugally (Centricon, 10 kDa molecular mass cut-off) and further purified by size exclusion chromatography using Sephacryl S100. Purity of co-expressed NtpEF was assessed by SDS-PAGE (shown in Supplementary Figure S1, online version only).
Individual expression of NtpE and NtpF
To enable individual expression of NtpE and NtpF, 5′ Bam HI and 3′ Not I restriction sites were incorporated into cDNAs for both NtpE and NtpF to enable in-frame fusion into the pGEX-6P-3 expression vector (GE Healthcare Life Sciences). PCR was performed using the corresponding clone in pCR-II-Blunt as template and the primers listed in Supplementary Table S1 (online version only). Following digestion with Bam HI and Not I, the PCR products were ligated into pGEX-6P-3. Correct in-frame transition from the GST coding region to NtpE or NtpF was confirmed by DNA sequencing. The E. coli strain BL21 DE3 was transformed by resulting pGEX constructs, and transformants were grown in Luria-Bertani medium containing 50 μg ml-1 ampicillin. Expression was induced with IPTG (0.2 mM) when the cell density reached an OD600 of 0.6. Cultures were incubated for a further 5 h at 37°C before the cells were harvested. Cell lysates were prepared as described above and the GST-fusion proteins were purified as described in (Jones et al. Citation2001). The GST fusion partner was removed by PreScission protease (GE Healthcare Life Sciences) and released NtpE or NtpF was repurified as described in (Jones et al. Citation2001) and subjected to SDS-PAGE (shown inset in Supplementary Figure S1, online version only).
V-ATPase subunit E (Vma4p)
Site-directed mutagenesis of the VMA4 (YOR332W) cDNA was performed by the QuikChange method (Stratagene). The template was a wild-type VMA4 cDNA subcloned into the pYES2 2 micron-based yeast expression vector (Invitrogen), as described in (Jones et al. Citation2005). Primer pairs for the mutagenesis reactions are listed in Supplementary Table S1 (online version only). Expression of Vma4p and complementation of the vma pH-sensitive conditional lethal phenotype in Saccharomyces cerevisiae was performed as described in (Jones et al. Citation2005). For testing for growth on selective plates, cells were grown overnight in liquid YEP medium buffered to pH 7.5 with MOPS/MES supplemented with 1% galactose/1% raffinose (YEPG/R7.5). Cells were then diluted in fresh medium to give an optical density at 600 nm (OD600) of 0.05AU and 5 μl was spotted onto a YEPG/R7.5 plate. This suspension culture was serially diluted by a factor of 4 and each dilution spotted onto the selective plate. As controls, growth was monitored on YEP plates at both pH 5.5 and pH 7.5 with 1% glucose (Jones et al. Citation2005). Growth on selective plates was monitored after 40 h. Doubling time for liquid cultures was determined by diluting liquid cultures into fresh YEPG/R7.5 medium to give an OD600 of 0.1 before culturing for a further 10 h. Aliquots were removed at 2-h intervals and the change in OD600 nm recorded.
Site-directed cross-linking
Interactions between co-expressed NtpEF were analyzed using the photoactivatable heterobifunctional cross-linker benzophenone-4-maleimide (BPM; Molecular Probes). Purified proteins (∼ 1 mg protein ml−1) were incubated with cross-linker (1 mM) in the dark for 2 h at 4°C. Excess maleimide was then quenched by the addition of a 5-fold molar excess of cystine. For photoactivation, a layer of protein solution (thickness ≤ 2 mm) in the well of a tissue culture plate was placed on wet ice, 10 cm below a mercury discharge tube (300 W). The protein solution was irradiated for up to 30 min.
BPM was also used to cross-link whole Saccharomyces cerevisae V-ATPase complexes: Washed vacuolar membrane vesicles were purified as described in (Uchida et al. Citation1985), and incubated with BPM and irradiated as described above. The yeast V-ATPase was then solubilized in dodecyl maltoside (Harrison et al. Citation2000) and immunoprecipitated by incubation with a monoclonal antibody to subunit B (Molecular Probes) bound to Protein A/G sepharose. Alternatively, cross-linking was performed on the BPM-modified V-ATPase after separation by glycerol gradient centrifugation, as described in (Harrison et al. Citation2000). Proteins were separated on Nu-PAGE gels (Invitrogen), transferred onto PVDF membranes, and immunoblotted using polyclonal antibodies to yeast Vma4p, Vma5p or Vma10p (generously donated by Prof. Tom Stevens, University of Oregon, USA).
Disulphide cross-linking between paired cysteines in NtpEF was induced by incubating the purified heterodimer under oxidizing conditions (1 mM CuCl2) or by chemical cross-linking with the homobifunctional reagent N,N′-1,4-phenylenedimaleimide (pPDM) for 60 min at 4°C (1 mM, from a 100 mM stock in DMSO). A rapid screening method was used to detect disulphide cross-linking between NtpF cysteine mutants and the Cys21 mutant of NtpE. A lysate was generated by pelleting the cells from 1 ml of IPTG-induced culture and resuspending in BugBuster solution (Novagen) (100 μl) supplemented with benzonase to degrade nucleic acids. After incubation on ice for 30 min, the cell lysate was diluted with 400 μl Buffer A before mixing with 50 μl pre-equilibrated Talon resin. This suspension was mixed for 15 min at room temperature and the resin recovered by low-speed centrifugation. After washing with Buffer A, the recovered resin was resuspended in SDS-PAGE sample buffer (without reductant) and the sample boiled. The recovered sample solution was divided into two and DTT (25 mM) was added to one aliquot, which was then reheated to reduce any disulphide bonds. The reduced and non-reduced samples were then separated on SDS-PAGE, transferred onto PVDF and species containing NtpE detected by immunoblotting with antibodies to the N-terminal His6 tag (Boehringer Mannheim). Signal was detected using a Fujifilm LAS-3000 fluorescence imager.
Peptide mass fingerprinting
Polypeptide bands were excised from Coomassie blue-stained gels and, using a MassPREP Workstation (Waters), were processed by destaining (with 50 mM ammonium bicarbonate/50% (v/v) acetonitrile), reduction (using 10 mM dithiothreitol in 100 mM ammonium bicarbonate, 30 min) and alkylation (using 55 mM iodoacetamide in 100 mM ammonium bicarbonate, 20 min) before digestion with trypsin (using 6 ng/μl trypsin in 50 mM ammonium bicarbonate, 5 h, 37ºC). Peptides were then extracted into 1% (v/v) formic acid/2% (v/v) acetonitrile, and 1 μl of the extract was combined with1 μl of matrix solution (2 mg/ml α-cyano-4-hydroxycinnamic acid in 50% (v/v) ethanol/50% (v/v) acetonitrile) and applied to a MALDI plate. Spectra were obtained by a MALDI L/R mass spectrometer (Waters) in reflectron mode using standard operating parameters. Spectra were processed (background subtraction, smoothing and peak centroiding) and calibrated to produce a set of monoisotopic peptide masses for each sample. These were used by the Mascot engine (Matrix Science) in searches of the SwissProt and NCBInr databases. As the identities of the parent proteins were known, parameters were optimized for each sample to provide best fits for the data. Masses were assigned to each of the two parent proteins and residual masses were analyzed manually in order to identify potential cross-linked peptides. Masses of peaks observed in the trypsinized NtpEF spectrum, and their assigned identities, are listed in Supplementary Table S4 (online version only).
Circular dichroism spectroscopy
CD spectroscopy was performed on co-expressed NtpEF and on the individually-expressed NtpE and NtpF polypeptides. Polypeptides were dialyzed into 30 mM sodium phosphate pH 7.5 and adjusted to a protein concentration of 0.15 mg ml−1. Spectra were measured across the wavelength range 190-260 nm by a Jasco J-715 spectropolarimeter at 20°C with a path length of 1 mm. Data were collected at 0.5 nm intervals, and processed for determination of secondary structure using the program CONTIN (Provencher and Glöckner Citation1981).
Analytical ultracentrifugation
Sedimentation velocity experiments on five samples that comprised NtpE (0.5 mg/ml), NtpF (0.5 mg/ml), and co-expressed NtpEF (0.25, 0.50, and 1.0 mg/ml) were performed in an Optima XL-I analytical ultracentrifuge (Beckman Coulter). Sample and buffer in a 2-sector centerpiece were centrifuged in an An-60 Ti 4-hole rotor at 50000 rpm for 8.15 h at 20°C. The sedimentation was monitored by 124 interference and A275 scans across a 1.2 cm radius using a 4 min inter-scan interval. Sednterp (Hayes et al. Citation1995) calculated buffer density (1.00674 g ml−1) and viscosity (1.0020 cP) at 20°C. Results were analyzed by the programs DCDT+ v.1.13 (Stafford Citation1992) and Sedfit v.8.9 (Schuck Citation2000). Resulting g(s) distributions are shown in Supplementary Figure S2 (online version only). The standard sedimentation coefficient s20,w and frictional ratio f/f0 for each species are given in Supplementary Table S2 (online version only).
Results
Structural properties of NtpEF
The co-purification of NtpE and NtpF indicates that, in our hands, the two polypeptides form a stable complex (), as reported (Yamamoto et al. Citation2008). To establish that our expressed protein represents a suitable model for protein interaction studies, both secondary and quaternary structure properties were examined.
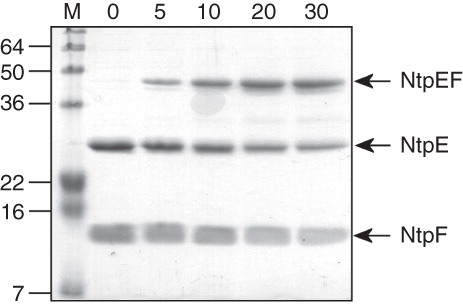
Figure 1. Cross-linking of the NtpEF heterodimer. The affinity-purified NtpEF containing wild type forms of both polypeptides contains only a single natural cysteine, Cys116 which is the penultimate residue of NtpF. Wild type NtpEF modified at this site by BPM was irradiated with UV light, and samples were removed for analysis by SDS-PAGE at the times in minutes indicated. The position of the covalently-linked NtpEF heterodimer is indicated. M, mass standards (kDa).
Analysis of secondary structure by circular dichroism
CD spectra were measured for the purified NtpE, NtpF and the NtpEF heterodimer (Supplementary Figure S1, online version only). The CD spectra show that all of the polypeptides are folded, and display characteristic minima at 208 nm and 222 for strongly α-helical secondary structure (Supplementary Figure S1, online version only). The relatively high θ222/θ208 values () for NtpF (0.95) and NtpEF (1.00) suggest that these proteins may have more coiled-coil character. Deconvolution of the CD spectra provided estimates of secondary structure content (). These indicated that co-expressed NtpEF is ∼70% α-helical with ∼16% β-structure. Expressed in isolation, NtpF is ∼80% α-helical and NtpE contains ∼62% α-helix/∼20% β-structure ( and Supplementary Figure S1 [online version only]). When expressed in bacteria in the absence of the co-expressed subunit E homologue, the eukaryotic NtpF homologue, subunit G (Vma10p in yeast), is relatively unfolded with limited secondary structure (Harrison et al. Citation2003). This is not the case with NtpF, which shows a high degree of α-helical content even in the absence of NtpE. SDS-PAGE analysis of NtpF consistently shows the presence of dimeric species (Supplementary Figure S1, online version only [inset]).
Table I. Estimates from circular dichroism of the secondary structure content of NtpE, NtpF, and NtpEF.
Sedimentation velocity analysis of quaternary structure
The hydrodynamic properties of the Ntp proteins were examined by analytical ultracentrifugation. Typical g(s) distributions for purified NtpE, NtpF and the NtpEF heterodimer are shown in Supplementary Figure S2 (online version only). Model-independent sedimentation coefficients together with predicted masses for possible stoichiometries of NtpE and NtpF were used to calculate potential frictional ratios (f/f0) (see Supplementary Table S2). For NtpE, the g(s) distribution had a single maximum at ∼ 3 S, and the assumption of a monomer mass resulted in a frictional ratio less than 1.0. This is clear evidence that the average mass is greater than that of a monomer. The assumption of dimeric mass resulted in an f/f0 of 1.54, which indicates a shape intermediate between spherical and linear. It is reasonable to conclude that the dimer is the predominant species in solution. The propensity of homologues of this polypeptide to form homodimers has been reported previously (Lokanath et al. Citation2007, Kish-Trier et al. Citation2008). Our g(s) distribution for NtpF gave two maxima at 2.2 S and 5.5 S (Supplementary Figure S2), and Supplementary Table S3 shows predicted frictional ratios for 2.2 S and 5.5 S assuming different oligomeric states of NtpF. For the maximum at 2.2S, the minimum reasonable stoichiometry of NtpF is a dimer; for the maximum at 5.5S, the minimum reasonable stoichiometry is a hexamer. This higher order oligomerization of isolated NtpF is intriguing, and suggests a relatively slow aggregation into extended fibre-like structures if the protein is maintained at high concentration. The g(s) distribution for the NtpEF heterodimer gave one maximum. Analysis of the weight average s20,w of 2.65 S produced a frictional ratio of 1.5, and this suggests that the NtpEF heterodimer is the predominant species in solution. This in turn implies that the affinity of NtpE for NtpF is greater than the affinity of either polypeptide for itself. Calculations by Sednterp provided dimensions for the 1:1 NtpEF heterodimer that were consistent with the ∼180 Å-long filamentous stators seen in three-dimensional reconstructions of V-ATPases from electron microscopy data (Diepholz et al. Citation2008, Zhang et al. Citation2008, Muench et al. Citation2009). These data are consistent with hydrodynamic data reported previously (Kish-Trier et al. Citation2008, Yamamoto et al. Citation2008).
Molecular contacts between NtpE and NtpF
The NtpEF heterodimer contains only a single cysteine residue, the naturally-occurring cysteine at the penultimate residue position in NtpF (Cys116). This site was initially used as the target for thiol-reactive photoactivatable cross-linker benzophenone-4-maleimide (BPM) in order to probe NtpEF contacts close to the C-terminus of NtpF. Photoactivation of BPM attached to Cys116 of NtpF resulted in the formation of a covalently linked ∼ 43 kDa NtpEF heterodimer (). To determine the region of NtpE able to cross-link to the C-terminal region of NtpF that contains Cys116, the tryptic fingerprint of the BPM-linked heterodimer was obtained by mass spectrometry. Three peptides that were found in the heterodimer fingerprint, but not in those of either NtpE or NtpF were detected (). These represent the NtpF C-terminal fragment conjugated to fragments of NtpE. The masses of potential NtpF adducts arising from the NtpF C-terminal tryptic fragment are 948.52 Da for QNNGC(BPM)H and 1207.88 Da for MKQNNGC(BPM)H. By subtracting these values from the observed masses of the three unassigned peptides it is possible to deduce the identities of their NtpE components. Using this approach, two peptides were found to contain residues 110–122 of NtpE conjugated respectively to hydrated and dehydrated forms of the NtpF C-terminal fragment. The third peptide contains NtpE residues 123–128 conjugated to the extended NtpF fragment MKQNNGC(BPM)H (). A complete assignment of peptide identities from the tryptic fingerprint is shown in Supplementary Table S4 (online version only).
Table II. Identification of cross-linked NtpE-NtpF tryptic fragments.
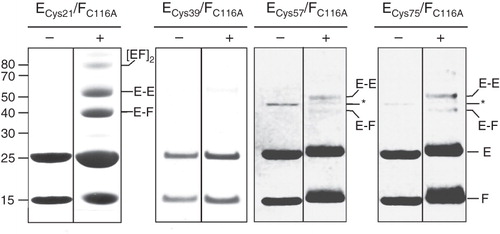
Secondary structure prediction algorithms predict with high confidence that the N-terminal ∼115 residues of NtpE are contained within a domain comprising almost entirely one single extended α-helix. This is consistent with AUC data that show an extended filament-like structure for both NtpEF and its eukaryotic subunit E/subunit G homologue (Féthière et al. Citation2005, Yamamoto et al. Citation2008) and the solution structure of the N-terminal 52 residues of the archaebacterial E homologue determined by NMR spectroscopy (Gayen et al. Citation2009). Therefore, if modeled as simple single α-helical structures, both NtpF and the N-terminal domain of NtpE will be approximately the same length. If the C-terminal end of NtpF is adjacent to the region of NtpE bounded by residues 110 and 128, as indicated by the chemical cross-linking/mass spectrometry analysis described above, it is reasonable to hypothesize that the two helical structures will run in parallel, perhaps with contacts across their full extent and with their N-termini in proximity to each other. To test this hypothesis, single cysteine residues were introduced into NtpE at regular intervals five helical turns (18 residues) apart. These cysteine mutant polypeptides were co-expressed with a form of NtpF in which the native cysteine residues (Cys116) had been mutated to alanine (C116A mutant), ensuring that each mutant NtpEF heterodimer contained only a single cysteine. These introduced cysteines were then also used as targets for BPM cross-linking, using the same approach as for the experiment described in . The yeast homologues of NtpE (Vma4p/E) and NtpF (Vma10p/G) also interact via the N-terminal region (residues 20–38) of E (Jones et al. Citation2005), and recent NMR analysis has pointed to interaction between the E18-38 and G22-26 regions, with Arg25 of Vma4p/E potentially H-bonded to Glu20 of Vma10p/G (Rishikesan et al. Citation2008). Although sequence conservation between eukaryotic E subunits and NtpE is generally not strong, their N-terminal regions do have a high degree of similarity. In particular, Arg25 of Vma4p is equivalent to Arg21 in NtpE. This residue was therefore selected as the first cysteine replacement, with subsequent changes at positions 39, 57 and 75. UV irradiation of affinity-purified heterodimer containing the BPM-modified NtpE Cys21 resulted in formation of three higher molecular mass species, migrating on SDS-PAGE with masses ∼42 kDa and ∼54 kDa (). These were identified by mass spectrometry as NtpEF heterodimer and NtpE homodimer respectively. The third, higher mass species (∼80 kDa) contains both NtpE and NtpF as a probable tetramer. The same cross-linking approach applied to the NtpE Cys57 and Cys75 mutants resulted in low yields of the NtpEF heterodimeric and NtpE homodimeric products (), implying a lower degree of contact between these sites and NtpF. Cross-linking using the Cys39 NtpE mutant resulted in negligible amounts of the NtpE homodimer. Attempts at identifying the regions of NtpF in proximity to the Cys21, Cys57 and Cys75 residues in NtpE using the tryptic fingerprinting approach were unsuccessful. However, one conclusion from these data is that there is some degree of contact with NtpF across the majority of the α-helical N-terminal domain of NtpE, but that this contact is strongest where it involves the N- and C-terminal ends of this NtpE domain. The presence of NtpE homodimers also indicates that either the NtpEF heterodimer is in equilibrium with homodimers of each polypeptide, or that the (NtpEF)2 tetramer is present in the purified sample. Formation of this tetramer with time at high protein concentration is also evident from the AUC data.
Figure 2. SDS-PAGE analysis of benzophenone 4-maleimide-mediated cross-linking in the NtpEF heterodimer. Cysteine replacement mutants of NtpE (Cys21, Cys39, Cys57 and Cys75) were co-expressed with the ‘cysteine-less’ C116A mutant of NtpF and the corresponding NtpEF heterodimers were affinity purified. The mutant cysteine residues were reacted with the maleimide function of BPM, with subsequent UV photoactivation inducing covalent linkage to NtpF. SDS-PAGE analysis was performed on photoactivated (+) and non-photoactivated controls (−). High molecular mass species corresponding to cross-linked products were identified by tryptic fingerprinting. The band marked with an asterisk in the ECys57/FC116A and ECys75/FC116A is a minor contaminant of the affinity-purified NtpEF, identified as E. coli aminoglycoside 3-phosphotransferase.
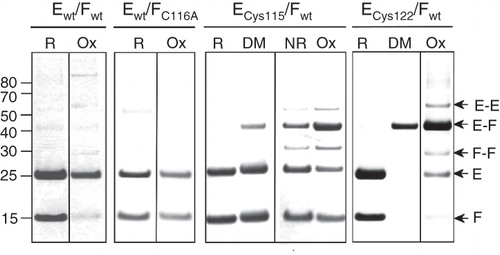
Chemical cross-linking of the C-terminal tryptic fragment of NtpF to two distinct fragments of NtpE () indicates that at least two sites on NtpE are within ∼10 Å of the native Cys116 of NtpF. To confirm the proximity of the NtpE110-128 region to the C-terminus of NtpF, cysteine residues were introduced into NtpE as the sole cysteines in the polypeptide. These were co-expressed with the wild-type NtpF containing the native Cys116 as its penultimate residue, and the mutant NtpEF heterodimers were purified via the N-terminal His6 tag of NtpE. Formation of disulphide cross-linked species induced by oxidizing conditions (CuCl2) was determined by comparing samples of protein run on SDS-PAGE under reducing (: R) or non-reducing conditions (: Ox). For both Cys115 and Cys122 NtpE mutants, exposure of the purified proteins to oxidizing conditions resulted in a high yield of disulphide-linked NtpEF heterodimers (: ECys115/Fwt and ECys122/Fwt: Ox), identified by mass spectrometry. This indicates that the native NtpF Cys116 can come into close proximity to either mutant cysteine in NtpE. A smaller yield of NtpE and NtpF homodimers were also observed with these mutants. Cross-linked multimeric aggregates of NtpF are also induced to form by oxidizing conditions in the wild-type NtpEF complex (containing Cys116 of NtpF as the sole cysteine), consistent with the aggregation detected by AUC. No cross-linked species were observed in a ‘cysteine-less’ control NtpEF heterodimer (: Ewt/FC116A). Formation of disulphide-linked species was not completely dependent on the presence of oxidant, occurring with somewhat lower yields even when the sample was maintained under ambient redox conditions and separated on non-reducing SDS-PAGE (: ECys115/Fwt NR). Formation of irreversibly cross-linked EF heterodimer (but not E or F homodimers) could also be induced by treatment of protein containing either the Cys115 and Cys122 NtpE mutants with the homobifunctional thiol-reactive cross-linker pPDM (: ECys115/Fwt and ECys122/Fwt: DM). This reagent did not induce formation of any cross-linked species in the wild-type or cysteine-less NtpEF complexes (data not shown). Although cross-linking appeared to be most efficient with the Cys122 mutant, this does not necessarily mean greater proximity of this site to Cys116 of NtpF. The optimum S-S distance for bridging by pPDM has been determined to be in the range 9–12.5 Å (Green et al. Citation2008), and distances both greater and smaller than this are likely to cause decreased efficiency of the cross-linking reaction. However, the data do indicate proximity between NtpE and NtpF sites even in the absence of relatively harsh oxidizing conditions.
Figure 3. SDS-PAGE analysis of disulphide cross-linking of co-expressed NtpEF cysteine replacement mutants. To confirm protein-protein contacts involving the C-terminal region of NtpF, cysteine replacement mutants of NtpE (Cys115 and Cys122) were co-expressed with wild type NtpF containing a natural cysteine residue at its penultimate position (Cys116). Co-expression of wild type NtpE and NtpF (Ewt/Fwt) contains only the naturally-occurring Cys116 of NtpF, whereas expression of wild type NtpE with the NtpF C116A mutant (Ewt/FC116A) gives a control heterodimer completely devoid of cysteines. The corresponding NtpEF heterodimers were affinity-purified and incubated with oxidant (Ox), the dimaleimide cross-linker pDPM (DM), the reducing agent DTT (R), or left untreated (NR) before separation on SDS-PAGE. Identities of cross-linked species were confirmed by tryptic fingerprinting/mass spectrometry. The figure is a composite assembled from lanes run separately on gels under reducing (R, DM) or non-reducing (NR, Ox) conditions to avoid cross-contamination by reducing agent.
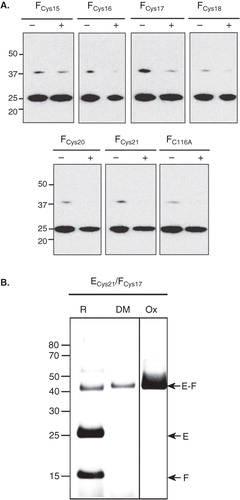
Assuming a model of NtpEF in which the N-terminal helix of NtpE and the helix of NtpF are of similar length and aligned parallel to each other (with Cys116 of NtpF close to residues 115 and 122 of NtpE) it can be postulated that residue 21 of NtpE will be adjacent to sites on NtpF found within the region bounded by residues 15-22. To test this, the C116A ‘cysteine-less’ form of NtpF was mutated to produce a series of cysteine replacements spanning these residues. These were then co-expressed with the Cys21 mutant of NtpE. Immunoblotting of whole cell lysates with antibodies recognizing the His6 tag on NtpE was used as an initial screen to determine which mutational combinations were able to generate disulphide-linked NtpEF heterodimers in vitro (). Low levels of a ∼40 kDa species corresponding to NtpEF were observed in the non-reduced samples generated from all mutational combinations, including the control containing the ‘cysteine-less’ NtpF C116A mutant. This is presumably due to presence of strong NtpE-NtpF aggregates. However, the mutational combination of NtpE Cys21 and NtpF Cys17 showed relatively high levels of the heterodimer (), suggesting that these sites are sufficiently close to form a disulphide bridge. To confirm this, the NtpECys21/NtpFCys17 complex was purified and tested for cross-linking under oxidizing conditions (: ECys21/FCys17 Ox) or by incubation with pDPM (: ECys21/FCys17 DM). Cross-linked heterodimer was formed with approaching 100% efficiency under both conditions, with some remaining present even under reducing conditions (: ECys21/FCys17 R). This mutational combination did not give rise to cross-linked NtpF or NtpE homodimers.
Figure 4. Immunoblot analysis of disulphide links between the Cys21 mutant of NtpE and NtpF N-terminal cysteine mutants. (A) A series of NtpF mutants containing single cysteine replacements in the N-terminal region were co-expressed with the Cys21 mutant of NtpE. To screen for disulphide cross-links that can form in vitro, samples enriched in the mutant NtpEF heterodimers were made from whole cell lysates of induced cells by pull-down with Talon His6 affinity resin. Proteins extracted from the resin into SDS-PAGE sample buffer were then treated with (+) or without (−) reducing agent before separation on SDS-PAGE and subsequent immunoblotting. The blot was developed with monoclonal antibody recognizing the His6 tag at the N-terminal end of NtpE. The strongly developed band at 25 kDa is NtpE and the weaker band at 37 kDa is the NtpE-NtpF heterodimer. (B) To confirm the disulphide formation between Cys21 in NtpE and Cys17 in NtpF suggested by the data in (A), the corresponding mutant heterodimer was affinity purified and incubated with oxidant (Ox), the dimaleimide cross-linker pDPM (DM) or with the reducing agent DTT (R), Cross-linked species were identified by tryptic fingerprinting/mass spectrometry.
Subunit E/subunit G contacts in the yeast V-ATPase
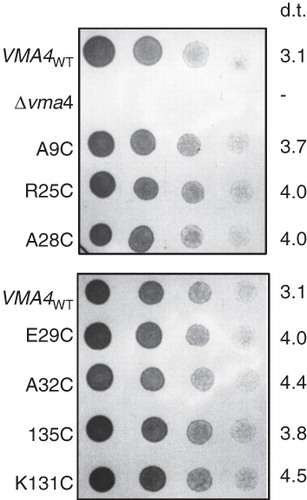
Having established the nature of the contacts within the relatively simple two-component NtpEF complex, we wanted to determine if similar subunit contacts occur within the fully-assembled V-ATPase from Saccharomyces cerevisiae. We have previously established the role of the N-terminal region of Vma4p (yeast subunit E and homologue of NtpE) in binding to both Vma10p (yeast subunit G, homologue of NtpF) and Vma5p (yeast subunit C) (Jones et al. Citation2005). We therefore introduced unique cysteine residues into this region as targets for BPM-mediated cross-linking at positions 9, 25, 28, 29, 32 and 35, a mixture of conserved and non-conserved sites. These mutant constructs were used to transform a haploid yeast strain carrying a disruption in the VMA4 gene for subunit E that confers a pH-sensitive conditional lethal phenotype (Nelson and Nelson Citation1990). All Vma4p cysteine mutants gave rise to transformants with recovered ability to grow at neutral pH when expression driven by the GAL1 promoter of the pYES2 vector was induced by culturing on galactose-containing medium (), indicating complementation of the pH sensitivity conferring VMA4 deletion. Cysteine replacement mutant strains showed a 20–45% increase in doubling time when cultured in galactose/raffinose medium at pH 7.5, suggesting that the mutations may compromise V-ATPase function to a small degree (). However, strong growth at pH7.5 was still supported, indicating that each Vma4p cysteine mutant polypeptide must be capable of incorporation into a functional V-ATPase.
Figure 5. VMA4 cysteine replacement mutants complement the conditional lethal phenotype of the Δvma4 strain. Four-fold serial dilutions (left to right) of Saccharomyces cerevisiae Δvma4 strain transformed with plasmids carrying wild-type VMA4 (VMA4WT) or cysteine replacement versions of the subunit. The VMA4-deleted strain (Δvma4) showed no growth. Plates buffered to pH7.5 and containing both galactose to induce expression and raffinose to support growth were culture for 40 hours. Doubling time (d.t.) (in hours) is listed for each strain, determined by monitoring change in optical density at 600 nm for cells growing in liquid culture at pH7.5 with galactose/raffinose.
Vacuolar membranes were purified from each cysteine mutant-expressing yeast strain and subsequently reacted with BPM. After photoactivation to induce cross-linking, a V-ATPase fraction was immunoprecipitated from the detergent-solubilized membrane and analyzed by SDS-PAGE and immunoblotting. When probed with antibodies to Vma4p/E, the R25C mutant showed photoactivation-dependent species at ∼ 62 kDa and ∼ 36 kDa (, top panel). The same 36 kDa product of photoactivation was also evident with A9C, A28C and I35C mutants, although at much lower levels (, top panel). Immunoblotting vacuolar membranes containing the mutant V-ATPases with antibody to Vma10p/subunit G also showed ∼ 36 kDa photoactivation products for the same A9C, R25C, A28C and I35C Vma4p/E mutants (, lower panel). Note that photoactivation resulted in interference with the resolution of the SDS-PAGE specifically in the low molecular mass region where Vma10p migrates, evident as significant blurring of the Vma10p bands. This necessitated under-running of the gels, compromising the extent to which polypeptide species could be separated. However, the correlation between blots for both Vma4p and Vma10p strongly suggests formation of a ∼ 36 kDa BPM cross-linked E-G heterodimer in the Vma4p mutants with cysteines specifically at positions 9, 25, 28 and 35. The ∼ 65 kDa species detected by the anti-Vma4p/E antibody with the R25C Vma4p mutant is an E-C heterodimer, since the same photoactivation-dependent product was detected by immunoblotting with an antibody to Vma5p/C ().
Figure 6. Immunoblot analysis of BPM-mediated cross-linking between subunits E, G and C in the yeast V-ATPase subunit E. (A) Vacuolar membranes from Saccharomyces cerevisiae cells expressing subunit E (Vma4p) cysteine replacement mutants were modified with BPM, then photoactivated or (+) or maintained in the dark (−). After detergent solubilization, V-ATPase was immunoprecipitated with monoclonal antibodies to subunit B and the precipitated proteins analyzed by immunoblotting. Top panel: Detection of Vma4p/subunit E. The background band seen in all samples results from recognition of the precipitating antibody IgG heavy chain by the immunblot secondary antibody. Lower panel: Detection of Vma10p/subunit G. Vacuolar membranes were analyzed directly since interference from immunoprecipitating antibody would obscure the signal from Vma10p cross-linked products. (B) Identification of the ∼ 65 kDa cross-linked product formed by the R25C Vma4p/E mutant. A photoactivation-dependent product with the same mass as the species detected with antibodies to Vma4p/E in (A) was also detected by immunoblotting with antibodies to subunit C, indicating formation of a Vma4p/E-Vma5p/C heterodimer. (C) Cross-linking of the C-terminal domain of Vma4p/E to Vma10p/G. BPM-mediated cross-linking between a cysteine introduced at position 131 in Vma4p/E and wild type Vma10p/G resulted in formation of a ∼ 36.5 kDa species detected by antibodies to both Vma4p/E (anti-E) and Vma10p/G (anti-G). Formation of this species was photoactivation-dependent (+) and absent from control samples maintained in the dark (−). An additional ∼ 60 kDa species was detected by the anti-Vma10/G antibody, but was not photoactivation-dependent, being found in both irradiated and non-irradiated samples containing wild-type proteins. (D) Determination of molecular masses of cross-linked species. Migration of the prestained markers, positions of which are shown in (A) and (C), are plotted against molecular mass on a log scale (closed symbols) and a straight line has been fitted to each data set to produce a standard curve of migration versus molecular mass for each immunblot (r > −0.99 in each case). Triangles, circles and squares are respectively the marker sets in (A) upper panel, (A) lower panel and (C). Migration of subunits Vma10p/G, Vma4p/E and the putative cross-linked E-G heterodimer for each of the blots in (A) and (C) are also plotted (shown by the horizontal dashed lines) and the intercept on the fitted line is indicated by the open symbols. The masses of the putative E–G heterodimers seen on each of the blots are very similar, as determined from the intercept on the abscissa.
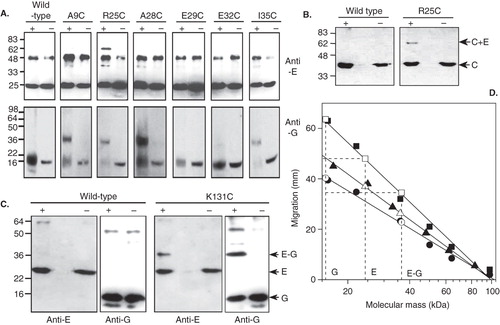
The same cross-linking strategy was applied to cysteine mutations in the Vma4p/E C-terminal region. Secondary structure prediction and alignment of subunit E sequences using the program JPred (Cuff et al. Citation1998) suggest that the residue of yeast Vma4p/E that is in an equivalent position to Leu115 of NtpE is Lys131, residing at the end of the extended N-terminal α-helical region of E that immediately precedes the first β-strand of the C-terminal domain. Introduction of a cysteine residue at this position did not compromise the functionality of Vma4p/E, with the mutant polypeptide retaining the ability to complement the pH-sensitive vma4 mutation in yeast (). Photoactivation of BPM-modified V-ATPase gave rise to a ∼36 kDa species that was detected by both anti-Vma4p/E and anti-Vma10p/G antibodies (), indicating the formation of an E–G heterodimer. A cysteine mutation introduced at position 124 (L124C) in Vma4p/E did not yield any cross-linked products (data not shown). Cross-comparison of species detected on different blots run under different SDS-PAGE conditions, with migration correlated to different marker protein sets, can be problematical. To confirm that the candidate cross-linked E-G heterodimers detected on the immunoblots shown in and are indeed equivalent, their masses were determined from plots of migration on SDS-PAGE of the prestained mass standards against (log) mass of those markers (). Standard curves for each blot were constructed by fitting a straight line to each marker protein data set, and the masses of the candidate E–G species from each blot were calculated from the line fitting parameters, using the corresponding migration value for the cross-linked species. This process gave values of 36.3–36.5 kDa for the masses of the putative cross-linked E–G heterodimers in blots developed with either anti-E or anti-G antibodies, confirming that they are in fact the same species.
Discussion
Predictive models of subunit E from both eukaryotic V-type and prokaryotic V- or A-type ATPases suggest that its N-terminal ∼ 100 residues fold essentially as a single α-helix (Kish-Trier et al. Citation2008). The reliability of these predictions is underlined by their close correlation with the secondary structure determined for the A-ATPase subunit E C-terminal domain by X-ray crystallography (Lokanath et al. Citation2007). The helical region merges into this globular C-terminal domain containing mixed α–β structure that attaches the three stators of the eukaryotic V-ATPase or two stators of the bacterial V- and A-ATPases to the top of the corresponding catalytic domain (Diepholz et al. Citation2008, Zhang et al. Citation2008, Kish-Trier and Wilkens Citation2009, Muench et al. Citation2009, Vonck et al. Citation2009). The NMR-derived solution structure of the N-terminal 52 residues of the A-ATPase E subunit also reveals a single α-helix (CitationGayen et al. 2009). Spectroscopic analyses also support a model in which the major part of subunit G is a single α-helix approximately 100 residues long (Féthière et al. Citation2004, Biukovic et al. Citation2007, Kish-Trier et al. Citation2008). Data from small-angle X-ray scattering (Yamamoto et al. Citation2008), analytical ultracentrifugation (Féthière et al. Citation2005, Yamamoto et al. Citation2008, and this study) and electron microscopy (Féthière et al. Citation2004) all indicate that E and G associate to give a filament-like quaternary structure, the size and shape of which matches the stator electron densities seen in EM three-dimensional reconstructions of both eukaryotic V- and related prokaryotic A-ATPases (Diepholz et al. Citation2008, Zhang et al. Citation2008, Kish-Trier and Wilkens Citation2009, Muench et al. Citation2009, Vonck et al. Citation2009). The data presented in this study now provide direct evidence for contacts between α-helices in the N-terminal regions of the E- and G-type polypeptides in the V-ATPase stator structures, and for anchorage of the C-terminus of G in the C-terminal domain of E. In the bacterial NtpEF complex, sites near the N- and C-termini of the G homologue NtpF (spaced 100 residues apart) are sufficiently close (∼ 2 Å) to equivalently spaced sites at either end of the NtpE N-terminal helical domain to allow disulphide formation. Crucially, similar interactions occur between Vma4p/E and Vma10p/G in the eukaryotic V-ATPase. The chemical cross-linking data in indicate that the region of Vma4p/E containing residues 9–35 also contacts Vma10p/G, suggesting close alignment of N-terminal α-helical segments across a span of at least 40 Å. The general helical periodicity of sites on E that cross-link to G suggests a simple helical alignment in this region, as suggested for the corresponding subunit interactions between A-ATPase homologues of these subunits (Gayen et al. Citation2008) and by NMR studies of interaction between E- and G-derived peptides (Rishikesan et al. Citation2008). Although this mitigates against the presence of a coiled-coil structure involving the first 35 residues of each subunit, our CD spectroscopy data for NtpEF and that of others for the same protein (Yamamoto et al. Citation2008), for the eukaryotic EG (Féthière et al. Citation2004) and for the homologous A-ATPase EH complex (Kish-Trier et al. Citation2008) do suggest a coiled-coil structure within the heterodimer as a whole. A site within this N-terminal region of Vma4p/E that can also contact Vma5p/C via the benzophenone cross-linker must be both accessible from the aqueous phase and close to the point of contact between E and C. Interactions between these subunits within the V-ATPase stator structure has previously been demonstrated (Féthière et al. Citation2005, Inoue and Forgac Citation2005, Jones et al. Citation2005).
In the yeast V-ATPase, a site predicted to be at the C-terminal end of the subunit E α-helical domain also comes into close proximity to G, mirroring the situation in NtpEF. The data presented here therefore point to a model (illustrated in ) in which structurally similar α-helical segments from both E and G, extending over at least 100 residues (150 Å), run in parallel with their N-terminal segments closely aligned and oriented towards the membrane domain. With the crystal structure of the C-terminal domain of E (Lokanath et al. Citation2007) positioned in its best fit to the electron density map of the Manduca sexta V-ATPase (Muench et al. Citation2009), the C-terminus of G must bend away from the long axis of the α-helix in order to be consistent with the cross-linking data and contact the helix-turn-β-strand in the C-terminal domain of E (). This arrangement correlates reasonably well with the model of the homologous EH complex from the archaebacterium Thermoplasma acidophilum. By convention, in the archaebacteria subunit H is the homologue of V-ATPase subunit G. This model, incorporating constraints determined by NMR as the distribution of G-induced chemical shifts, identified the C-terminal end of the helical domain and the final helical segment of E as ‘hotspots’ for interaction with the C-terminal region of G(H) (Kish-Trier and Wilkens Citation2009). Alignment of the C-terminal ∼10 residues of G(H) with this region would comfortably position the penultimate residue of G such that it could make the disulphide connections to E described in this study. A similar approach examining the interactions at the N-terminal end of the eukaryotic EG complex suggests a model in which the N-terminal ∼15 residue segment of G is angled around the N-terminal region of E, stabilizing their interaction (Rishikesan et al. Citation2008). However, we have not factored this into the model shown in .
Figure 7. Modeling the subunit E/subunit G stator in the structure for the V-ATPase. The stator structures visible in the model of the Manduca V-ATPase generated by cryo-electron microscopy of single particles (Muench et al. Citation2009) are ∼ 160 Å long and extend from the top of the V1 domain to the horizontal collar of density partially encircling the mid-region of the complex that contains subunit C (pdb 1U7L (Drory et al. Citation2004): green in the on-line version of this figure). Stators 1 (S1) and 2 (S2), labeled according to (Muench et al. Citation2009), are visible in the view shown. The cytoplasmic end of stator 2 has been fitted with the mixed α-helix and β-sheet (red and yellow, respectively, in the on-line version of the Figure) of the crystal structure of the C-terminal domain (residues 81-198) of the Pyrococcus homologue of subunit E (pdb code 2DM9 [Lokanath et al. Citation2007]). The filament-like region of stator 2 (S2), extending towards the membrane domain V0, can accommodate the N-terminal domain of E modeled as an extended α-helix (red cylinders in the on-line version of the Figure), with a break predicted to be possible ∼ 60 Å from the membrane proximal end of the stator. The 115 residue subunit G is modeled into the stator structure principally as a single α-helical structure (blue cylinders in the on-line version of the figure) such that its N-terminal region is positioned close to the N-terminal region of E at the membrane-proximal end of the stator. In the subunit E C-terminal domain structure, the residue (Glu116) that corresponds to NtpE residue Leu115 that cross-links directly to the C-terminus of NtpF is shown in space fill (cyan in the on-line figure) and is adjacent to the C-terminal region of G, consistent with the cross-linking data from this study and published biophysical data (see main text for discussion). E and G can be equally well fitted to the other two stators. This Figure is reproduced in colour in the online version of Molecular Membrane Biology.
![Figure 7. Modeling the subunit E/subunit G stator in the structure for the V-ATPase. The stator structures visible in the model of the Manduca V-ATPase generated by cryo-electron microscopy of single particles (Muench et al. Citation2009) are ∼ 160 Å long and extend from the top of the V1 domain to the horizontal collar of density partially encircling the mid-region of the complex that contains subunit C (pdb 1U7L (Drory et al. Citation2004): green in the on-line version of this figure). Stators 1 (S1) and 2 (S2), labeled according to (Muench et al. Citation2009), are visible in the view shown. The cytoplasmic end of stator 2 has been fitted with the mixed α-helix and β-sheet (red and yellow, respectively, in the on-line version of the Figure) of the crystal structure of the C-terminal domain (residues 81-198) of the Pyrococcus homologue of subunit E (pdb code 2DM9 [Lokanath et al. Citation2007]). The filament-like region of stator 2 (S2), extending towards the membrane domain V0, can accommodate the N-terminal domain of E modeled as an extended α-helix (red cylinders in the on-line version of the Figure), with a break predicted to be possible ∼ 60 Å from the membrane proximal end of the stator. The 115 residue subunit G is modeled into the stator structure principally as a single α-helical structure (blue cylinders in the on-line version of the figure) such that its N-terminal region is positioned close to the N-terminal region of E at the membrane-proximal end of the stator. In the subunit E C-terminal domain structure, the residue (Glu116) that corresponds to NtpE residue Leu115 that cross-links directly to the C-terminus of NtpF is shown in space fill (cyan in the on-line figure) and is adjacent to the C-terminal region of G, consistent with the cross-linking data from this study and published biophysical data (see main text for discussion). E and G can be equally well fitted to the other two stators. This Figure is reproduced in colour in the online version of Molecular Membrane Biology.](/cms/asset/02f288a5-8b42-42d8-9a6f-49d6f0307efa/imbc_a_480166_f0007_b.jpg)
Overall, the model of the EG stator complex in both eukaryotic and prokaryotic V-ATPases comprises two parallel α-helices of approximately equal length, likely stabilized by a coiled-coil configuration, and linked to each other at both ends before extending into a globular ‘cap’ domain that fastens the cytoplasmic end of the stator structure to the V-ATPase catalytic domain. A coiled-coil arrangement should be highly stable, and implies an inflexibility that would be inconsistent with an ‘energy storage’ role in the V-ATPase rotational mechanism. The mechanical basis for non-stoichiometric coupling between the ATPase and proton pump functions of the V-ATPase therefore remains uncertain.
Supplementary Material
Download TIFF Image (1.3 MB)Supplementary Material
Download MS Word (24.5 KB)Supplementary Material
Download TIFF Image (495.2 KB)Supplementary Material
Download MS Word (24 KB)Supplementary Material
Download MS Word (67.5 KB)Supplementary Material
Download MS Word (45.5 KB)Supplementary Material
Download MS Word (62 KB)Acknowledgements
We thank Ms Meital Cohen for assisting with cross-linking experiments.
Declaration of interest: This work was supported by the UK BBSRC (grant numbers 24/b14097 and BB/D016142/1). The MassPREP and MALDI instruments were funded through a BBSRC JREI (2000) award. The authors report no conflicts of interest. The authors alone are responsible for the content and writing of the paper.
References
- Bernal RA, Stock D. 2004. Three-dimensional structure of the intact Thermus thermophilus H+-ATPase/synthase by electron microscopy. Structure 12:1789–1798.
- Biukovic G, Rossle M, Gayen S, Mu Y, Grüber G. 2007. Small-angle X-ray scattering reveals the solution structure of the peripheral stalk subunit H of the A1A0 ATP synthase from Methanocaldococcus jannaschii and its binding to the catalytic A subunit. Biochemistry 46:2070–2078.
- Cuff JA, Clamp ME, Siddiqui AS, Finlay M, Barton GJ. 1998. JPred: A consensus secondary structure prediction server. Bioinformatics, 14, 892–3.
- Diepholz M, Venzke D, Prinz S, Batisse C, Flörchinger B, Rössle M, Svergun DI, Böttcher B, Féthière J. 2008. A different conformation for EGC stator subcomplex in solution and in the assembled yeast V-ATPase: Possible implications for regulatory disassembly. Structure 16:1789–1798.
- Drory O, Frolow F, Nelson N. 2004. Crystal structure of yeast V-ATPase subunit C reveals its stator function. EMBO Reports 5:1148–1152.
- Féthière J, Venzke D, Diepholz M, Seybert A, Geerlof A, Gentzel M, Wilm M, Böttcher B. 2004. Building the stator of the yeast vacuolar-ATPase: Specific interaction between subunits E and G. J Biol Chem 279:40670–40676.
- Féthière J, Venzke D, Madden DR, Böttcher B. 2005. Peripheral stator of the yeast V-ATPase: Stoichiometry and specificity of interaction between the EG complex and subunits C and H. Biochemistry 44:15906–15914.
- Forgac M. 2007. Vacuolar ATPases: Rotary proton pumps in physiology and pathophysiology. Nat Rev Mol Cell Biol 8:917–929.
- Gayen S, Balakrishna AM, Biukovic G, Yulei W, Hunke C, Grüber G. 2008. Identification of critical residues of subunit H in its interaction with subunit E of the A-ATP synthase from Methanocaldococcus jannaschii. FEBS J 275:1803–1812.
- Gayen S, Balakrishna AM, Grüber G. 2009. NMR solution structure of the N-terminal domain of subunit E (E1-52) of A1A0 ATP synthase from Methanocaldococcus jannaschii. J Bioenerg Biomemb 41:343–348.
- Green NS, Reisler E, Houk KN. 2008. Quantitative evalutation of the lengths of homobifunctional protein cross-linking reagents used as molecular rulers. Protein Sci 10:1293–1304.
- Harrison MA, Durose L, Song CF, Barratt E, Trinick J, Jones R, Findlay JBC. 2003. Structure and function of the vacuolar H+-ATPase: Moving from low resolution models to high resolution structures. J Bioenerg Biomemb 35:337–345.
- Harrison MA, Powell B, Finbow ME, Findlay JBC. 2000. Identification of lipid-accessible sites on the Nephrops 16-kDa proteolipid incorporated into a hybrid vacuolar H+-ATPase: Site-directed labeling with N-(1-pyrenyl)cyclohexylcarbodiimide and fluorescence quenching analysis. Biochemistry 39:7531–7537.
- Hayes D, Laue T, Philo J. 1995. Program Sednterp: Sedimentation interpretation program. PhD thesis, University of New Hampshire, USA.
- Inoue T, Forgac M. 2005. Cysteine-mediated cross-linking indicates that subunit C of the V-ATPase is in close proximity to subunits E and G of the V1 domain and subunit a of the V0 domain. J Biol Chem 280:27896–27903.
- Jones RPO, Durose LJ, Findlay JBC, Harrison MA. 2005. Defined sites of interaction between subunits E (Vma4p), C (Vma5p), and G (Vma10p) within the stator structure of the vacuolar H+-ATPase. Biochemistry 44:3933–3941.
- Jones RPO, Hunt IE, Jaeger J, Ward A, O'Reilly J, Barratt EA, Findlay JBC, Harrison MA. 2001. Expression, purification and secondary structure analysis of Saccharomyces cerevisiae vacuolar membrane H+-ATPase subunit F (Vma7p). Mol Memb Biol 18:283–290.
- Kish-Trier E, Briere LA, Dunn SD, Wilkens S. 2008. The stator complex of the A1A0-ATP synthase – structural characterization of the E and H subunits. J Mol Biol 375:673–685.
- Kish-Trier E, Wilkens S. 2009. Domain architecture of the stator complex of the A1A0-ATP synthase from Thermoplasma acidophilum. J Biol Chem 284:12031–12040.
- Kitagawa N, Mazon H, Heck AJR, Wilkens S. 2008. Stoichiometry of the peripheral stalk subunits E and G of yeast V1-ATPase determined by mass spectrometry. J Biol Chem 283:3329–3337.
- Landolt-Marticorena C, Williams KM, Correa J, Chen W, Manolson MF. 2000. Evidence that the NH2 terminus of Vph1p, an integral subunit of the V0 sector of the yeast V-ATPase, interacts directly with the Vma1p and Vma13p subunits of the V1 sector. J Biol Chem 275:15449–15457.
- Landt O, Grunert H-P, Hahn U. 1990. A general method for rapid site-directed mutagenesis using the polymerase chain reaction. Gene 96:125–128.
- Lokanath NK, Matsuura Y, Kuroishi C, Takahashi N, Kunishima N. 2007. Dimeric core structure of modular stator subunit E of archaeal H+-ATPase. J Mol Biol 366:933–944.
- Lu M, Vergara S, Zhang L, Holliday LS, Aris J, Gluck SL. 2002. The amino-terminal domain of the E subunit of vacuolar H+-ATPase (V-ATPase) interacts with the H subunit and is required for V-ATPase function. J Biol Chem 277:38409–38415.
- Muench SP, Huss M, Song CF, Phillips C, Wieczorek H, Trinick J, Harrison MA. 2009. Cryo-electron microscopy of the vacuolar ATPase motor reveals its mechanical and regulatory complexity. J Mol Biol 386:389–399.
- Murata T, Yamato I, Kakinuma Y, Leslie AGW, Walker JE. 2005. Structure of the rotor of the V-type Na+-ATPase from Enterococcus hirae. Science 308:654–659.
- Nelson H, Nelson N. 1990. Disruption of genes encoding subunits of yeast vacuolar H+-ATPase causes conditional lethality. Proc Natl Acad Sci USA 87:3503–3507.
- Nishi T, Forgac M. 2002. The vacuolar (H+)-ATPases – nature's most versatile proton pumps. Nature Rev Mol Cell Biol 3:94–103.
- Pospiech A, Neumann B. 1995. A versatile quick-prep of genomic DNA from Gram-positive bacteria. Trends Genet 11:217–218.
- Provencher SW, Glöckner J. 1981. Estimation of globular protein secondary structure from circular dichroism. Biochemistry 20:33–37.
- Qi J, Forgac M. 2008. Function and subunit interactions of the N-terminal domain of subunit a (Vph1p) of the yeast V-ATPase. J Biol Chem 283:19274–19282.
- Rishikesan S, Thaker YR, Priya R, Gayen S, Manimekalai MSS, Hunke C, Grüber G. 2008. Spectroscopical identification of residues of subunit G of the yeast V-ATPase in its connection with subunit E. Mol Memb Biol 25:400–410.
- Rubinstein JL, Walker JE, Henderson R. 2003. Structure of the mitochondrial ATP synthase by electron cryomicroscopy. EMBO J 22:6182–6192.
- Schuck P. 2000. Size-distribution analysis of macromolecules by sedimentation velocity ultracentrifugation and Lamm equation modelling. Biophys J 78:1606–1619.
- Stafford WF. 1992. Boundary analysis in sedimentation transport experiments: A procedure for obtaining sedimentation coefficient distributions using the time derivative of the concentration profile. Anal Biochem 203:1–7.
- Uchida E, Ohsumi Y, Anraku Y. 1985. Purification and properties of H+-translocating Mg2+-adenosine triphosphatase from vacuolar membranes of Saccharomyces cerevisiae. J Biol Chem 260:1090–1095.
- Vonck J, Pisa KY, Morgner N, Brutschy B, Müller V. 2009. Three-dimensional structure of A1A0ATP synthase from the hyperthermophilic archeon Pyrococcus furiosus by electron microscopy. J Biol Chem 284:10110–10119.
- Yamamoto M, Unzai S, Saijo S, Ito K, Mizutani K, Suno-Ikeda C, Yabuki-Miyata Y, Terada T, Toyama M, Shirouzu M, Kobayashi T, Kakinuma Y, Yamato I, Yokoyama S, Iwata S, Murata T. 2008. Interaction and stoichiometry of the peripheral stalk subunits NtpE and NtpF and the N-terminal hydrophilic domain of NtpI of Enterococcus hirae V-ATPase. J Biol Chem 283:19422–19431.
- Yokoyama K, Nakano M, Imamura H, Yoshida M, Tamakoshi M. 2003. Rotation of the proteolipid ring in the V-ATPase. J Biol Chem 278:24255.
- Zhang Z, Zheng Y, Mazon H, Milgrom E, Kitagawa N, Kish-Trier E, Heck AJR, Kane PM, Wilkens S. 2008. Structure of the yeast vacuolar ATPase. J Biol Chem 283:35983–35995.