Abstract
Cholesterol- and glycosphingolipid-enriched membrane lipid microdomains, frequently called lipid rafts, are thought to play an important role in the spatial and temporal organization of immunological synapses. Higher ordering of lipid acyl chains was suggested for these entities and imaging of membrane order in living cells during activation can therefore help to understand the mechanisms responsible for the supramolecular organization of molecules involved in the activation of T cells. Here, we employ the phase-sensitive membrane dye di-4-ANEPPDHQ together with a variety of spectrally-resolved microscopy techniques, including 2-channel ratiometric TIRF microscopy and fluorescence lifetime imaging, to characterize membrane order at the T cell immunological synapse at high spatial and temporal resolution in live cells at physiological temperature. We find that higher membrane order resides at the immunological synapse periphery where proximal signalling through the immunoreceptors and accessory proteins in microclusters has previously been shown to take place. The observed spatial patterning of membrane order in the immunological synapse depends on active receptor signalling.
Introduction
The immunological synapse (IS) is the junction formed between immune cells (e.g. T, B and NK cells) and their targets (e.g., antigen-presenting cells, APCs) (Monks et al. Citation1998, Grakoui et al. Citation1999, Bromley et al. Citation2001). It is formed during the process of immune cell activation and also during inhibition (Davis et al. Citation1999). Previously, it has been shown that, within this junction, signalling and adhesion proteins connected to cell activation are patterned into a system of concentric Supra-Molecular Activation Clusters (SMACs) and mobile protein microclusters (Monks et al. Citation1998, Grakoui et al. Citation1999, Yokosuka et al. Citation2005, Varma et al. Citation2006). It was further demonstrated that the peripheral and distal regions of the IS are important areas for adhesion and proximal signal transduction events such as protein tyrosine phosphorylation (Lee et al. Citation2003, Varma et al. Citation2006). For the central area of the IS, the cSMAC, regulatory and signal enhancing roles have been proposed (Lee et al. Citation2003).
The appearance of certain proteins and lipids in specific areas of the membrane led to the hypothesis that cholesterol- and sphingolipid-enriched, highly ordered membrane lipid microdomains (also known as lipid rafts, LRs) may play an important role in the organization of molecules at the cell plasma membrane (Simons and Ikonen Citation1997). Some proteins have been shown to accumulate in, and others to be excluded from, these entities using various ‘raft markers’ (Day and Kenworthy Citation2009). Labelling rafts often includes multivalent cholera toxin subunit B or antibodies, raising the possibility of aggregation of smaller structures. New non-intrusive sensing methods for membrane lipids' physico-chemical properties are required for direct observation of these domains in living cells at physiological temperatures (Cebecauer et al. Citation2009). Indirect measurements by Förster resonance energy transfer (Sharma et al. Citation2004), fluorescence correlation spectroscopy (FCS) (Lenne et al. Citation2006), and single particle tracking (Suzuki et al. Citation2007), demonstrated transient confinement of putative raft components in nanodomains in the plasma membrane of resting cells. In recent years the LR hypothesis has evolved into one with a more transient, dynamic picture; ‘LRs are now thought to be small (10–200 nm), heterogeneous, dynamic domains that compartmentalize cellular processes and can be stabilized to form larger platforms’ (Pike Citation2006). Data combining super-resolution imaging with FCS confirm this view (Eggeling et al. Citation2009). Experiments with artificial membranes have demonstrated that domains mimicking LRs in biological membranes have higher lipid ordering (liquid-ordered phase) than the surrounding ‘non-raft’ area (liquid-disordered phase) (Sengupta et al. Citation2007). Two strategies have been developed for imaging lipid ordering in cellular membranes using fluorescence: phase-partitioning dyes (Burack et al. Citation2002) and environmentally-sensitive fluorescent probes which can report on their local molecular surroundings (Parasassi et al. Citation1990, Gaus et al. Citation2003). The size and short average lifespan of membrane lipid microdomains poses a significant challenge to optical microscopy techniques which are limited in their spatial resolution and minimum image acquisition times. The use of a single environmentally-sensitive probe that can change its fluorescent properties depending on whether it is residing in ordered or disordered membranes is a potentially powerful approach for improving the spatio-temporal resolution of membrane studies. A prime example of this type of imaging is the use of the phase-sensitive, membrane-partitioning dye LAURDAN which shows a 50 nm shortening of its peak fluorescence emission wavelength between the liquid-disordered and liquid-ordered phases (Gaus et al. Citation2006).
Membrane lipid microdomains have been implicated as having an important role in the organization of signalling events at the IS of T cells (Janes et al. Citation1999, Tavano et al. Citation2004). Gaus and colleagues used LAURDAN generalized polarization (GP) values calculated from two spectral channels to image the distribution of membrane order in T cells. They found that higher order membrane regions accumulate in the contact site between T cells and APCs forming a relatively diffuse peripheral ring in the IS (Gaus et al. Citation2005). Subsequently, they used the cholesterol analogue, 7-ketocholesterol (7KC), to disrupt membrane order and showed an impact on T cell activation (Rentero et al. Citation2008). LAURDAN images in these studies were acquired using fixed cells at 25°C with potentially unphysiological effects on the highly dynamic membranes of living cells (Magee et al. Citation2005). In addition, two-photon excitation is required for LAURDAN imaging which results in a decrease in spatial resolution and, owing to the low two-photon excitation cross-section, longer acquisition times are required to achieve a given signal-to-noise level compared to single-photon-excited probes.
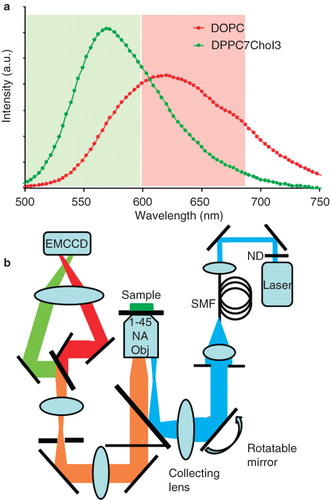
Recently, a new probe sensitive to membrane order, di-4-ANEPPDHQ, has been developed (Obaid et al. Citation2004, Jin et al. Citation2006) which can be excited in the blue spectral region with single-photon excitation providing increased spatial resolution and decreased acquisition times. More importantly, it allows the use of widefield illumination and detection thus opening the door to high-speed imaging and total internal reflection fluorescence (TIRF) microscopy. Di-4-ANEPPDHQ exhibits a 60 nm spectral blue-shift between the disordered and ordered lipid phases () (Jin et al., Citation2006), is readily soluble in lipids and aqueous solutions and shows minimal fluorescence when not lipid-associated, presumably due to a high non-radiative fluorescence decay rate in aqueous environment. The combination of various imaging techniques together with the advantages of di-4-ANEPPDHQ allowed us to study the distribution of membrane lipid order in living cellular systems at physiological temperature and high spatial and temporal resolution, including in live primary T cells. All presented results were achieved at physiological temperature, and therefore move the discussion of the role of membrane lipid organization in the activation processes of T cells closer to the natural state.
Figure 1. (a) The fluorescence emission spectra of di-4-ANEPPDHQ in ordered (green) and disordered (red) model membranes. The unilamellar vesicles were formed from dioleoyl phosphatidylcholine (DOPC) (disordered phase) or a mixture of dipalmitoyl phosphatidylcholine (DPPC) and cholesterol (Chol) in the ratio 7:3 (ordered phase). The 60 nm blue-shift in fluorescence emission between the disordered and ordered phases was detected using spectrofluorimetry. The shaded regions show the spectral windows that were subsequently acquired for construction of the GP value images. (b) Schematic of the 2-channel ratiometric TIRF microscope. This Figure is reproduced in colour in the online version of Molecular Membrane Biology.
Materials and methods
2-channel ratiometric TIRF microscopy
TIRF microscopy was performed on a custom-built microscope with excitation at 473 nm from a diode-pumped solid-state laser (Blues 50, Cobolt, Solna, Sweden) delivered via a single mode optical fiber (SMF) and a rotatable mirror to adjust the TIRF angle. Excitation is delivered into the back-port of an inverted epifluorescence microscope (IX71, Olympus, Tokyo, Japan) equipped with an X60, 1.45NA oil-immersion TIRF objective. Fluorescence was collected on an electron-multiplying CCD camera (EMCCD) (iXon, Andor, Belfast, UK) in the range 500–593 nm and 600–680 nm using a 2-channel imager (Dual-View, Optical Insights) in order to distinguish high and low order of the lipid environment (see ). Fluorescence above 680 nm was not collected due to high background fluorescence (data not shown). Data were processed using custom software (LabVIEW, National Instruments, Austin, TX, USA). Calculated GP values (Equation 1) for each pixel were then pseudo-coloured (from high membrane order – red, to low membrane order – blue; see colour bars for ). The images were merged with the fluorescence intensity image such that the result displays both order and structural information. The sample was maintained at 37°C using a stage and objective heater (PeCon, Erbach, Germany). Quantitation of image data was performed by measuring average GP values in the central region (defined from the centre to half way to the synapse edge) and the remaining peripheral region.
Figure 2. Membrane order at the synapse of live T cell-APC conjugates. (a) brightfield, (b) GP image and (c) 3D reconstruction showing en face view of the cell-cell interface (dashed line viewed from the direction of the arrow on b; APC position is indicated by dashed ring) of live di-4-ANEPPDHQ-stained Jurkat T cells forming synapses with unstained APCs (SEE-loaded Raji cells). (d, e and f) second example showing similar order distribution. APC (not shown) position in f is indicated with dashed circle and the other T cell is not shown for clarity (representative of n = 8). (g, h and i) and (j, k and l) show two examples of the synapses formed in the absence of antigenic stimulus (SEE; representative of n = 16). The total acquisition time for the 3D stack was approximately 30 sec with both images acquired approximately 10 min after synapse formation. In all images, red colour represents higher and green/blue lower order membranes. Scale bars 10 μm. T cell synapses imaged using optical tweezers: Brightfield (m) and GP image (n) of the activatory conjugate formed between Jurkat T cell and APC (as in a) with the IS oriented in the focal plane using optical tweezers. Representative line profile across the synapse (o) and quantitation of the GP values in the central and peripheral regions (n = 8, p < 0.05) (p). Scale bar 10 μm. This Figure is reproduced in colour in the online version of Molecular Membrane Biology.
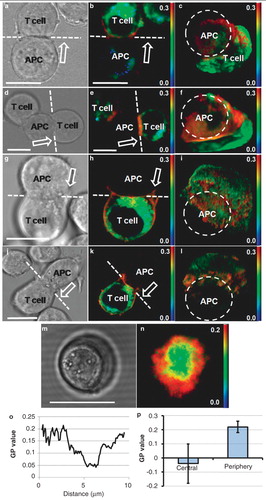
Figure 3. Order distribution at the T cell IS formed with activating antibody-coated glass coverslips. (a) Brightfield image showing the main cell body (outlined red) and the large synaptic interface (outlined yellow). (b) TIRF intensity image of the interface. (c) GP image at the synapse showing higher order (red) and lower order (green to blue) (representative of n = 20). (d) GP image of the interface formed by a primary human T cell (n = 6). Presented images are of a T cell approximately 10 min after formation of contact with activatory surface. (e) GP images showing dynamics of the observed order distribution (see also Supplementary Movie 1, available online). (f and g) GP images showing low- and high-order putative sub-synaptic vesicles (white arrows) diffusing in the plasma membrane background (see also Supplementary Movies 2 and 3, available online). Acquisition time was 1 sec per frame. (h) Quantitative analysis of GP values in the centre and periphery of Jurkat cell synapses (n = 20, p = 0.10) and a representative line profile across the contact site. Scale bars 5 μm. This Figure is reproduced in colour in the online version of Molecular Membrane Biology.
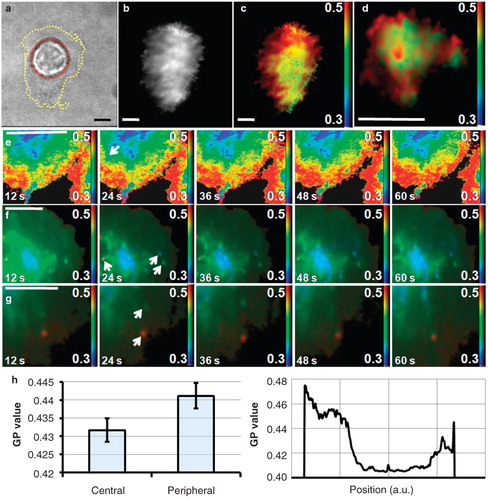
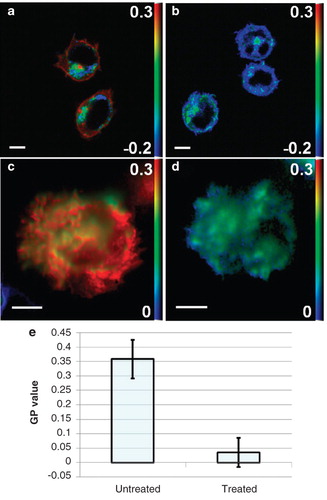
Figure 4. Effect of 7KC treatment on membrane order. (a and b) GP images of di-4-ANEPPDHQ-stained Jurkat T cells in suspension imaged using confocal microscopy without and after 7KC treatment, respectively. (c and d) TIRF GP images of the IS formed on an anti-CD3ϵ antibody-coated coverslip ∼ 10 min after contact formation without and after 7KC treatment, respectively. (e) Quantitation of membrane order in untreated and 7KC-treated T cell synapses (n = 20) showing reduced order after 7KC treatment (p < 0.001). Scale bars 5 μm. This Figure is reproduced in colour in the online version of Molecular Membrane Biology.
Confocal microscopy
Single-photon excitation confocal microscopy was undertaken using an inverted, epi-fluorescence laser-scanning confocal microscope (TCS SP5, Leica Microsystems Ltd, Wetzlar, Germany) with a 63×, 1.25NA oil-immersion objective lens. Excitation was at 488 nm from an argon-ion laser. Fluorescence detection was in the wavelength bands 500–580 nm and 620–750 nm () using internal photomultiplier tubes. z-slices were acquired every 700 nm. GP values were calculated as for TIRF images. 3D reconstructions and en face views were generated using Volocity software (Improvision, Waltham, MA, USA).
Fluorescence lifetime imaging
For FLIM, fluorescence was collected in the range 540–750 nm using a PMT and TCSPC electronics (SPC-830, Becker and Hickl GmbH, Berlin, Germany) with single-photon excitation at 460 nm from a frequency-doubled Ti:Sapphire laser (Tsunami, Spectra-Physics, Mountain View, CA, USA). Fluorescence decays were fitted to a single-exponential function and pseudo-coloured as for the GP images (experimental details available as Supplementary Material online).
Optical tweezing
Cell and IS orientation by optical tweezing was performed using an infrared (980 nm) optical trapping beam as previously described (Oddos et al. Citation2008). Confocal fluorescence imaging was then performed in the same way as for the 3D confocal microscopy.
Sample preparation
Jurkat T cells (clone E6.1) and Raji B cells were cultured in RPMI1640 medium (PAA, Pasching, Austria) supplemented with 10% foetal calf serum (FCS) at 37°C in a 5% CO2 atmosphere. Raji B cells were loaded (or not) with the superantigen Staphylococcal enterotoxin E (SEE) for 90 min at 37°C. Human CD4+ T cells were isolated using a MACS kit for negative selection (Miltenyi Ltd) after separation of peripheral blood mononuclear cells on a Ficoll gradient (GE Healthcare). One hour prior to imaging, the cells were resuspended in HEPES-buffered salt saline (HBSS) supplemented with 1 mM Ca2+, 2 mM Mg2+, 1% gelatin and 5 μM di-4-ANEPPDHQ (Invitrogen, Carlsbad, CA, USA). The use of serum-free medium containing gelatin dramatically reduces the fluorescence background from residual dye which would otherwise swamp the red wavelength channel (Figure S1, Supplementary Material online).
Coverslip chambers (Lab-Tek, Brendale, Australia) coated with poly-L-lysine followed by 10 μg/ml antibodies to CD3 (OKT3 mAb) in phosphate-buffered saline (PBS) and blocked by incubation at 37°C with PBS supplemented with 1% gelatin for 30 min were used for activatory surface stimulation of T cells.
Supported planar bilayers with GPI-anchored forms of I-Ek and ICAM-1 were prepared in FCS2 flow cells (Bioptechs, Butler, PA, USA) and used for stimulation of AND T cells as described before (Grakoui et al. Citation1999). The I-Ek molecules on the bilayers were loaded with 100 μM MCC88-103 peptide in citrate buffer for 48 h. The density of the GPI-anchored proteins in the bilayers was: I-Ek 20 sites/μm2 and ICAM-1 150 sites/μm2 (see Supplementary Material online for details).
For ordered phase disruption using 7KC, 15 mg/ml 7KC and cholesterol (both from Avanti Lipids, Alabaster, AL, USA) in ethanol were combined in the ratio 2:1. Over 30 min, these were then added to a solution of 50 mg/ml methyl-β-cyclodextrin (Sigma-Aldrich, St Louis, MO, USA) in PBS at 80°C to a final sterol concentration of 1.5 mg/ml. 15 μl of the lipid solution were then added to 1 ml of cell medium containing 5 × 10⁵ cells at 37°C for 30 min.
Results
Membrane lipid order: Live T cell – APC conjugates
IS junctions between T cells and APCs create a favourable molecular organization for processes involved in the integration and regulation of activatory signals and for effector functions. To test whether the phase-sensitive dye, di-4-ANEPPDHQ, will allow us to image membrane order within this structure in real time we first incubated living T cells with APCs under physiological temperature of 37°C and applied conventional 2-colour confocal microscopy. We observed the accumulation of higher lipid order in the IS periphery and relatively lower order in the central region ( and ). Very low order was observed in intracellular membrane structures, as has been reported previously (Owen et al. Citation2006) ( and ). These distributions agree well with previously published data acquired using LAURDAN and multi-photon microscopy on fixed cells at room temperature (Gaus et al. Citation2005). Large macromolecular rearrangements in the IS and formation of a peripheral adhesive ring and a central receptor-rich area in activated T cells were shown to be antigen signalling-dependent (Monks et al. Citation1998). We imaged the distribution of membrane order in T cells forming conjugates with APC in the absence of antigenic stimulus. Again, increased ordering of lipids was observed at the contact site between T cells and APC but to a much lower level than in the presence of the antigenic stimulus. Little or no segregation into highly ordered peripheral ring and central area with relatively lower lipid ordering was observed ().
Live cell imaging of T cell-APC conjugates is associated with a low probability that the IS will form in the imaging plane of the microscope thus requiring 3D z-stacks to be acquired. This limits spatial resolution as confocal microscopes typically have axial resolutions of around 700 nm and the 3D rendering required to generate en face images of the IS further degrades the image quality. In order to overcome this limitation, we applied optical tweezers to reorientate the IS into the confocal imaging plane () (Oddos et al. Citation2008). This permits the IS to be directly imaged at the higher lateral resolution of approximately 200 nm. Again, a broad ring of high membrane order at the IS periphery was observed with decreased order towards the centre (). The membrane order distribution, as shown in the GP value plot (), was statistically significant (p < 0.05) as indicated by the quantitation of the central and peripheral regions ().
Membrane lipid order: Live T cells activated on antibody-coated coverslips
Because conventional confocal fluorescence microscopy enables imaging of fluorescent objects in the focal plane with an axial resolution (sectioning strength) of around 700 nm, the signal detected may include contributions from other intracellular structures within the focal volume as well as the plasma membrane. In order to overcome this constraint, we used 2-channel ratiometric TIRF microscopy (see Materials and methods and ) to image the membrane order of T cells activated on coverslips with immobilized anti-CD3ϵ antibodies. shows a representative brightfield transmitted light image, TIRF intensity image and a membrane order (GP) map, respectively, of a live Jurkat T cell synapse imaged approximately 10 min after the contact with the activating surface. The cell shows a large, spread interface with the antibody-coated coverslip mimicking the IS formed by T cells spreading over the surface of an APC. A higher lipid order accumulation in the IS periphery with reduced order distributed towards the central region confirms the results observed during live imaging of T cells conjugated with APCs. As no 3D reconstruction is involved it is possible to perform accurate quantitative analysis of the data. shows GP values from central and peripheral regions acquired from 20 individual cells (p = 0.10) and a line profile of the GP values from one, representative case. The relatively small difference in GP values for central and peripheral regions of the IS is probably caused by contact shape variability and the poorly defined border between these two regions. Similarly, poorly defined formation of a central area enriched in receptors has previously been observed in T cells on an activatory surface (Bunnell et al. Citation2001, Citation2002a).
It is known that cultured cells (e.g., Jurkat T cells) do not retain all the properties of primary cells. We therefore imaged the distribution of membrane order obtained from primary human CD4+ T cells activated on an anti-CD3ϵ antibody-coated coverslip (). The image shows a similar distribution of higher membrane order in the periphery with an indication of the multi-focality observed in synapses formed between primary T cells and dendritic cells presenting the antigen on their surface (Brossard et al. Citation2005).
The higher signal-to-noise level, lower background, increased sectioning strength and shorter image acquisition times of TIRF microscopy enabled us to observe some finer substructures within a larger field of high order at the IS periphery. Most strikingly, the peripheral ring of higher membrane order reproducibly showed discontinuities or small areas of lower order suggesting possible sub-compartmentalization of cellular membranes ( and ). As TIRF images can be acquired at high frame-rates, it is possible to obtain a time-course of the order distribution as a movie. Selected frames of a representative movie (Supplementary Movie S1, available online) are displayed in . The general order distribution was observed to be stable over the imaged time-scale. However, we have been able to monitor points of lower order (blue) diffusing in the higher order background (; arrow). Small mobile areas of high, intermediate and low order, which may represent different vesicular sub-synaptic structures, were observed in cells where plasma membrane di-4-ANEPPDHQ dye was reduced by a quick wash (Supplementary Movies S2 and S3, available online, and selected frames in and ). We hypothesize that different vesicle populations may be important in trafficking of different membrane proteins, based on their affinity to membranes of various composition and lipid order. Of note, the resolution here is approximately 300 × 300 × 100 nm (x, y, z) which is higher than has previously been possible when imaging membrane order.
Membrane lipid order: The effect of 7-ketocholesterol
Having established the capability to image membrane order at the IS at high spatial and temporal resolution, we investigated whether changes in membrane order, for example due to pharmacological treatment, can be studied using our technique. The cholesterol analogue 7KC was previously described as an effective substance to reduce plasma membrane order of cultured T cells without significant effect on their viability and proximal signalling (Rentero et al. Citation2008). As seen in and (imaged by 2-channel ratiometric confocal microscopy), higher order of the plasma membrane was eliminated by 7KC pre-treatment of T cells. The effect on intracellular membranes was less dramatic but the order was still reduced, as expected. The cells maintained normal morphology even 90 min after treatment with 7KC. Using TIRF microscopy, the high membrane order ring observed in the IS periphery was absent in 7KC-treated cells activated on anti-CD3-coated coverslips ( and ) and quantitation supported the dramatic reduction of membrane order in the IS of 7KC-treated activated T cells (). Reduced membrane order did not, however, affect the ability of T cells to spread over the activating surface. Of note, treatment of Jurkat T cells with 7KC caused no significant changes (< 10%) in the surface expression of CD3ϵ (Rentero et al. (Citation2008) and data not shown).
Membrane lipid order: Live primary T cells on supported planar bilayers
Antibodies immobilized on the glass surface of coverslips are likely to reduce the diffusional behaviour of membrane proteins. Incorporating ligands for TCR (peptide-MHC) and adhesion molecules (ICAM-1) into supported planar lipid bilayers represents a more physiological activating surface for primary T cells (Groves and Dustin Citation2003). Supported bilayers allow ligands lateral freedom and therefore do not restrict mobility of membrane proteins on T cells. We found that di-4-ANEPPDHQ dye in medium shows high affinity for T cells but also for the planar bilayer. Standard 2-channel intensity imaging is not sensitive enough to image membrane order of T cells in the presence of a large disordered-phase background from DOPC in the planar bilayer. We have previously demonstrated that fluorescence lifetime imaging (FLIM) offers enhanced contrast when imaging di-4-ANEPPDHQ in live cells (Owen et al. Citation2006). We therefore applied FLIM using single-photon excitation and time-correlated single-photon counting (TCSPC) on a scanning confocal microscope to improve the contrast when imaging membrane order of activated T cells on supported planar bilayers. It should be noted that, due to the dynamic nature of primary T cell-bilayer synapses and the longer acquisition times required for FLIM, both the spatial and temporal resolution are reduced relative to the antibody-coated coverslip data ().
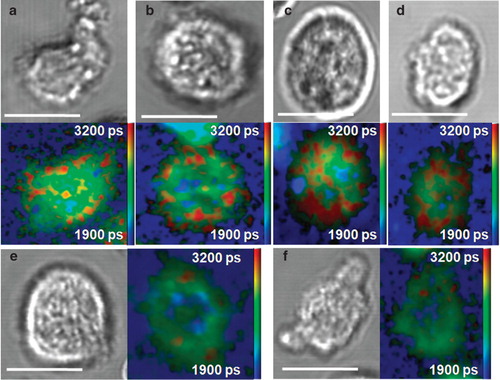
show brightfield and FLIM images of primary T cell synapses formed on supported planar bilayers. The low order background (blue) is due to DOPC present in the bilayer, for which we found a similar fluorescence lifetime to previously published results (Owen et al. Citation2006). Despite the lower spatial and temporal resolution of the measurements, the observed order distribution at the synapse remains generally consistent with the previous results. We hypothesize that the discontinuous nature of the high order membrane regions around the periphery may represent membrane sub-compartmentalization. Treatment of primary murine T cells with 7KC ( and ) disrupted higher order membrane regions that accumulated primarily in the periphery of the formed synapses. All these data support the high ordering of membrane lipids in the periphery of the IS, the area maintained by the dynamic actin cytoskeleton and associated with active signalling processes responsible for T cell stimulation (Dustin Citation2009).
Figure 5. Representative order distributions at the IS formed by primary murine T cells activated on supported planar bilayers (n = 10). (a–d) Brightfield and FLIM images of di-4-ANEPPDHQ-stained primary T cells forming synapses on planar bilayers. (e and f) Brightfield and FLIM images of T cell synapses after treatment with 7KC. Colour bar represents the mean fluorescence lifetime fitted in each pixel (see Supplementary Material, available online). Scale bars 5 μm. This Figure is reproduced in colour in the online version of Molecular Membrane Biology.
Discussion
The formation of large assemblies composed of signalling molecules is thought to improve the efficiency and robustness of signalling processes in the crowded and dynamic environment of cells (Cebecauer et al. Citation2010). In T cells, microclusters containing receptors and signalling proteins as well as higher order macromolecular assemblies (such as supramolecular activatory clusters) in the IS play an important role in the initiation and regulation of processes leading to their activation and stimulation of effector functions (Dustin et al. Citation1998, Monks et al. Citation1998, Grakoui et al. Citation1999, Bunnell et al. Citation2002b, Campi et al. Citation2005, Yokosuka et al. Citation2005). The involvement of lipids in the formation and stabilization of such assemblies has been suggested based on the presence of crucial cluster components in isolated detergent-resistant membranes (Montixi et al. Citation1998, Xavier et al. Citation1998, Drevot et al. Citation2002) and on co-localization studies of TCR complex constituents with LR markers in activated T cells (Janes et al. Citation1999). The concept of LRs' importance for T cell activation has also been disputed and protein-protein interactions were suggested to be the sole force responsible for driving higher organization of signalling molecules in the IS (Munro Citation2003, Douglass and Vale Citation2005). Live cell imaging of membrane organization in the IS and its dependence on lipid composition can therefore improve our understanding of molecular processes leading to the T cell activation.
Previous work suggested the polarized distribution of membrane order in T cells forming conjugates with APC in fixed cells at 25°C (Gaus et al. Citation2005). Here, we have imaged the distribution of membrane order at the IS at higher spatial and temporal resolution than has been achieved previously, and for the first time in living T cells at physiological temperature. This latter point is crucial because reducing the ambient temperature of cells even over a few degrees Celsius has been shown to induce membrane microdomain aggregation and T cell signalling (Magee et al. Citation2005). Hence, we have observed slightly increased total GP values in the plasma membrane of unstimulated fixed (GP = 0.20 ± 0.05; n = 10) compared to live Jurkat T cells (GP = 0.14 ± 0.02; n = 10). These values, even though not statistically significant (p ∼ 0.2), indicate that fixation and lower temperature can cause subtle changes in the organization of plasma membrane which may shift the fine balance of intermolecular forces involved in the processes leading to the activation of T cells.
We applied a variety of fluorescence microscopy techniques including 3D 2-channel confocal imaging and optical tweezer-oriented live cell conjugates as well as 2-channel ratiometric TIRF microscopy using activating antibody-coated glass coverslips. In all cases tested, higher plasma membrane order was demonstrated to accumulate preferentially in the peripheral regions of the synapse with lower lipid ordering in the central region. The observed distribution is in agreement with previously published data acquired at lower spatial and temporal resolution using the dye LAURDAN (Gaus et al. Citation2005). Since similar membrane order distribution is observed with LAURDAN, a chemically different molecule, it is also possible to exclude potential artefactual protein-dye interactions. Further, high membrane order was removed by treatment with the cholesterol oxide, 7KC, indicating a cholesterol dependence rather than exclusively the effect of membrane proteins and their binding partners in the stabilization of higher order membranes.
We have observed partial accumulation of highly ordered membranes in the junction formed between T cells and APCs in the absence of antigen. This increase in membrane order is probably caused by the interactions of T cell adhesive receptors, such as CD2 and LFA-1 (in low-affinity state), and their ligands on the surface of the APC (CD58 and ICAM-1) and the underlying actin cytoskeleton (Springer et al. Citation1987). No large-scale segregation into high order peripheral ring and lower membrane order central zone has been observed in the absence of the antigen. Such uniform distribution of membrane lipid order across the junction is similar to the previously reported random localization of surface receptors (e.g., LFA-1 and TCR) in T cells forming conjugates with APC in the absence of antigen (Monks et al. Citation1998).
Previously, only steady-state images of membrane order distribution have been achieved. Here, no changes in the overall general pattern of a high membrane order forming peripheral ring of the IS with reduced lipid ordering in the central zone have been detected over 1 min using live cell imaging in TIRF mode. With this technique, it was possible to observe what we hypothesize to be sub-synaptic vesicles of low, medium and high membrane lipid order which have not been previously reported for any cellular system. The co-existence of sub-synaptic vesicles with various levels of membrane order is indicated in movies of cells where the plasma membrane di-4-ANEPPDHQ dye concentration was reduced by washing. Formation of sub-membranous vesicular structures of different properties supports the observation of the presence of proximal T cell signalling molecules, LAT and SLP-76, in non-overlapping, dynamic clusters (Purbhoo et al. Citation2010).
We have succeeded in imaging membrane order in live primary CD4+ human T cells using 2-channel TIRF microscopy and have used di-4-ANEPPDHQ with FLIM to image membrane order at the primary murine T cell synapse formed with activating supported planar bilayers. These results represent a significant advance in terms of physiological relevance since many cultured cells of tumour origin (e.g., Jurkat T cells) have modified membrane lipid composition and planar bilayers represent a model for APCs with unrestricted mobility of ligand/receptor pairs, therefore reducing the probability of increased membrane order due to restrictions caused by immobilized antibodies.
All presented data demonstrate formation of an often discontinuous wide ring of high membrane order at the IS periphery with reduced lipid ordering in the central region. The function of the central synaptic region, the cSMAC, remains controversial since fully functional synapses were demonstrated without any detectable cSMAC (Lee et al. Citation2002). On the other hand, regulatory and signal enhancing roles were proposed for the cSMAC based on data acquired using weak antigens (Cemerski et al. Citation2008). Since only relatively strong activatory signals were applied in our study, we cannot exclude the possible accumulation of more ordered membranes in the central region under different stimulatory conditions. The function of highly ordered membranes in peripheral and distal regions of the IS and the mechanism(s) of their formation and stabilization remain to be explored. The accumulation of integrins and associated molecules in the pSMAC supports its generally accepted adhesive function (Monks et al. Citation1998, Grakoui et al. Citation1999). Formation of TCR and signalling microclusters required for T cell activation was demonstrated to occur primarily at the very edge of the IS, the distal region (dSMAC) (Varma et al. Citation2006). We speculate that lipids forming a higher order membrane environment here may help the formation of larger proteinaceous domains (e.g., TCR microclusters) or platforms (e.g., integrin-actin cytoskeleton assemblies during activation) by reducing molecular fluctuations within the plasma membrane. The latter is supported by the observation of higher membrane order in the junction between T cells and APCs in the absence of antigenic stimulus. Weak adhesive interactions of individual receptors or small oligomers, but not of microscopic supramolecular assemblies, are expected to influence plasma membrane organization of T cells in the absence of TCR signalling (Dustin et al. Citation1987).
The IS periphery is also a proximal signalling area (Varma et al. Citation2006). Many signalling proteins involved in immune cell activation were shown to contain post-translational modifications increasing their partitioning to highly ordered domains in membranes (Lommerse et al. Citation2006). Higher order membrane environments in the synapse periphery together with putative formation of vesicles with different lipid compositions and lipid order (Supplementary Movies S1–S3, available online) may present an elegant way of signalling regulation by compartmentalization of various signalling pathways into separate substructures.
The existence of small (Ø < 40 nm) membrane microdomains with increased order and therefore increased selective molecular confinement was observed in live cells indirectly by fluorescence correlation spectroscopy (Lenne et al. Citation2006) and recently directly by super-resolution STED microscopy (Eggeling et al. Citation2009). Whether the observed lipid structure (higher membrane order peripheral ring) is formed by the aggregation of these nanoscopic lipid rafts as has been postulated (Pike Citation2006) remains to be demonstrated. The small predicted size of LRs in resting cells prohibits observation of their fusion in real time using diffraction-limited imaging techniques.
Taken together, the methods used in this work have moved the limits of membrane order imaging towards higher spatial and temporal resolution and to live cell systems. The observation of high membrane order at the periphery of the IS where proximal signalling takes place, and the presence of high and low order dynamic sub-synaptic structures, underlines the importance of membrane lipid order in regulating T cell activation.
Supplementary Material
Download MS Word (269 KB)Supplementary Material
Download TIFF Image (4.1 MB)Supplementary Material
Download QuickTime Video (7.6 MB)Supplementary Material
Download QuickTime Video (6.4 MB)Supplementary Material
Download QuickTime Video (1.7 MB)Acknowledgements
We thank Rajat Varma and Etienne Joly for helpful suggestions and critical reading of the manuscript, and Chris Dunsby for helpful comments on the manuscript and assistance with optical tweezing. PMWF and DMD acknowledge a Wolfson Royal Society Research Merit Award. We also acknowledge the Facility for Imaging by Light Microscopy at Imperial College.
Declaration of interest: DMO, SK and SO acknowledge funding from the Engineering and Physical Sciences Research Council via the Chemical Biology Centre. We acknowledge Medical Research Council (MRC) grants G0700771 and G0100471 to AIM and National Institutes of Health grant AI43542 to MLD. DMD acknowledges funding from the MRC. The authors report no conflicts of interest. The authors alone are responsible for the content and writing of the paper.
Related Research Data
References
- Bromley SK, Burack WR, Johnson KG, Somersalo K, Sims TN, Sumen C, Davis MM, Shaw AS, Allen PM, Dustin ML. 2001. The immunological synapse. Annual Rev Immunol 19:375–396.
- Brossard C, Feuillet V, Schmitt A, Randriamampita C, Romao M, Raposo G, Trautmann A. 2005. Multifocal structure of the T cell-dendritic cell synapse. Eur J Immunol 35:1741–1753.
- Bunnell SC, Hong DI, Kardon JR, Yamazaki T, McGlade CJ, Barr VA, Samelson LE. 2002a. T cell receptor ligation induces the formation of dynamically regulated signaling assemblies. J Cell Biol 158:1263–1275.
- Bunnell SC, Hong DI, Kardon JR, Yamazaki T, McGlade CJ, Barr VA, Samelson LE. 2002b. T cell receptor ligation induces the formation of dynamically regulated signaling assemblies. J Cell Biol 158:1263–1275.
- Bunnell SC, Kapoor V, Trible RP, Zhang W, Samelson LE. 2001. Dynamic actin polymerization drives T cell receptor-induced spreading: A role for the signal transduction adaptor LAT. Immunity 14:315–329.
- Burack WR, Lee K-H, Holdorf AD, Dustin ML, Shaw AS. 2002. Cutting edge: Quantitative imaging of raft accumulation in the immunological synapse. J Immunol 169:2837–2841.
- Campi G, Varma R, Dustin ML. 2005. Actin and agonist MHC-peptide complex-dependent T cell receptor microclusters as scaffolds for signaling. J Experim Med 202:1031–1036.
- Cebecauer M, Owen DM, Markiewicz A, Magee AI. 2009. Lipid order and molecular assemblies in the plasma membrane of eukaryotic cells. Biochem Soc Transact 37:1056–1060.
- Cebecauer M, Spitaler M, Serge A, Magee AI. 2010. Signalling complexes and clusters: Functional advantages and methodological hurdles. J Cell Sci 123:309–320.
- Cemerski S, Das J, Giurisato E, Markiewicz MA, Allen PM, Chakraborty AK, Shaw AS. 2008. The balance between T cell receptor signaling and degradation at the center of the immunological synapse is determined by antigen quality. Immunity. 29:414-422.
- Davis DM, Chiu I, Fassett M, Cohen GB, Mandelboim O, Strominger JL. 1999. The human natural killer cell immune synapse. Proc Nat Acad Sci USA 96:15062–15067.
- Day CA, Kenworthy AK. 2009. Tracking microdomain dynamics in cell membranes. Biochimic Biophys Acta 1788:245–253.
- Douglass AD, Vale RD. 2005. Single-molecule microscopy reveals plasma membrane microdomains created by protein-protein networks that exclude or trap signaling molecules in T cells. Cell 121:937–950.
- Drevot P, Langlet C, Guo X-J, Bernard A-M, Colard O, Chauvin J-P, Lasserre R, He H-T. 2002. TCR signal initiation machinery is pre-assembled and activated in a subset of membrane rafts. EMBO J 21:1899–1908.
- Dustin ML. 2009. The cellular context of T cell signaling. Immunity 30:482–492.
- Dustin ML, Olszowy MW, Holdorf AD, Li J, Bromley S, Desai N, Widder P, Rosenberger F, Anton van der Merwe P, Allen PM, 1998. A novel adaptor protein orchestrates receptor patterning and cytoskeletal polarity in T-cell contacts. Cell 94:667–677.
- Dustin ML, Sanders ME, Shaw S, Springer TA. 1987. Purified lymphocyte function-associated antigen-3 binds to CD2 and mediates lymphocyte-T adhesion. J Experim Med 165:677–692.
- Eggeling C, Ringemann C, Medda R, Schwarzmann G, Sandhoff K, Polyakova S, Belov VN, Hein B, von Middendorff C, Schonle A, 2009. Direct observation of the nanoscale dynamics of membrane lipids in a living cell. Nature 457:1159–1163.
- Gaus K, Chklovskaia E, Fazekas de St Groth B, Jessup W, Harder T. 2005. Condensation of the plasma membrane at the site of T lymphocyte activation. J Cell Biol 171:121–131.
- Gaus K, Gratton E, Kable EPW, Jones AS, Gelissen I, Kritharides L, Jessup W. 2003. Visualizing lipid structure and raft domains in living cells with two-photon microscopy. Proc Nat Acad Sci USA 100:15554–15559.
- Gaus K, Zech T, Harder T. 2006. Visualizing membrane microdomains by Laurdan 2-photon microscopy. Molec Memb Biol 23:41–48.
- Grakoui A, Bromley SK, Sumen C, Davis MM, Shaw AS, Allen PM, Dustin ML. 1999. The immunological synapse: A molecular machine controlling T cell activation. Science 285:221–227.
- Groves JT, Dustin ML. 2003. Supported planar bilayers in studies on immune cell adhesion and communication. J Immunolog Meth 278:19–32.
- Janes PW, Ley SC, Magee AI. 1999. Aggregation of lipid rafts accompanies signaling via the T cell antigen receptor. J Cell Biol 147:447–461.
- Jin L, Millard AC, Wuskell JP, Dong X, Wu D, Clark HA, Loew LM. 2006. Characterization and application of a new optical probe for membrane lipid domains. Biophys J 90:2563–2575.
- Lee K-H, Dinner AR, Tu C, Campi G, Raychaudhuri S, Varma R, Sims TN, Burack WR, Wu H, Wang J, 2003. The immunological synapse balances T cell receptor signaling and degradation. Science 302:1218–1222.
- Lee K-H, Holdorf AD, Dustin ML, Chan AC, Allen PM, Shaw AS. 2002. T cell receptor signaling precedes immunological synapse formation. Science 295:1539–1542.
- Lenne P-F, Wawrezinieck L, Conchonaud F, Wurtz O, Boned A, Guo X-J, Rigneault H, He H-T, Marguet D. 2006. Dynamic molecular confinement in the plasma membrane by microdomains and the cytoskeleton meshwork. EMBO J 25:3245–3256.
- Lommerse PHM, Vastenhoud K, Pirinen NJ, Magee AI, Spaink HP, Schmidt T. 2006. Single-molecule diffusion reveals similar mobility for the Lck, H-Ras, and K-Ras membrane anchors. Biophys J 91:1090–1097.
- Magee AI, Adler J, Parmryd I. 2005. Cold-induced coalescence of T-cell plasma membrane microdomains activates signalling pathways. J Cell Sci 118:3141–3151.
- Monks CRF, Freiberg BA, Kupfer H, Sciaky N, Kupfer A. 1998. Three-dimensional segregation of supramolecular activation clusters in T cells. Nature 395:82–86.
- Montixi C, Langlet C, Bernard AM, Thimonier J, Dubois C, Wurbel MA, Chauvin JP, Pierres M, He HT. 1998. Engagement of T cell receptor triggers its recruitment to low-density detergent-insoluble membrane domains. EMBO J 17:5334–5348.
- Munro S. 2003. Lipid rafts: Elusive or illusive? Cell 115:377–388.
- Obaid AL, Loew LM, Wuskell JP, Salzberg BM. 2004. Novel naphthylstyryl-pyridinium potentiometric dyes offer advantages for neural network analysis. J Neurosc Meth 134:179–190.
- Oddos S, Dunsby C, Purbhoo MA, Chauveau A, Owen DM, Neil MAA, Davis DM, French PMW. 2008. High-speed high-resolution imaging of intercellular immune synapses using optical tweezers. Biophys J 95:L66–68.
- Owen DM, Lanigan PMP, Dunsby C, Munro I, Grant D, Neil MAA, French PMW, Magee AI. 2006. Fluorescence lifetime imaging provides enhanced contrast when imaging the phase-sensitive dye di-4-ANEPPDHQ in model membranes and live cells. Biophys J 90:L80–82.
- Parasassi T, De Stasio G, d'Ubaldo A, Gratton E. 1990. Phase fluctuation in phospholipid membranes revealed by Laurdan fluorescence. Biophys J 57:1179–1186.
- Pike LJ. 2006. Rafts defined: A report on the Keystone symposium on lipid rafts and cell function. J Lipid Res 47:1597–1598.
- Purbhoo MA, Liu H, Oddos S, Owen DM, Neil MA, Pageon SV, French PM, Rudd CE, Davis DM. 2010. Dynamics of subsynaptic vesicles and surface microclusters at the immunological synapse. Sci Signal. 3:ra36.
- Rentero C, Zech T, Quinn CM, Engelhardt K, Williamson D, Grewal T, Jessup W, Harder T, Gaus K. 2008. Functional implications of plasma membrane condensation for T cell activation. PLoS ONE 3:e2262.
- Sengupta P, Baird B, Holowka D. 2007. Lipid rafts, fluid/fluid phase separation, and their relevance to plasma membrane structure and function. Semin Cell Develop Biol 18:583–590.
- Sharma P, Varma R, Sarasij RC, Ira Gousset K, Krishnamoorthy G, Rao M, Mayor S. 2004. Nanoscale organization of multiple GPI-anchored proteins in living cell membranes. Cell 116:577–589.
- Simons K, Ikonen E. 1997. Functional rafts in cell membranes. Nature 387:569–572.
- Springer TA, Dustin ML, Kishimoto TK, Marlin SD. 1987. The lymphocyte function-associated LFA-1, CD2 and LFA-3 molecules: Cell adhesion receptors of the immune system. Annual Rev Immunol 5:223–252.
- Suzuki KGN, Fujiwara TK, Sanematsu F, Lino R, Edidin M, Kusumi A. 2007. GPI-anchored receptor clusters transiently recruit Lyn and G{alpha} for temporary cluster immobilization and Lyn activation: Single-molecule tracking study 1. J Cell Biol 177:717–730.
- Tavano R, Gri G, Molon B, Marinari B, Rudd CE, Tuosto L, Viola A. 2004. CD28 and lipid rafts coordinate recruitment of Lck to the immunological synapse of human T lymphocytes. J Immunol 173:5392–5397.
- Varma R, Campi G, Yokosuka T, Saito T, Dustin ML. 2006. T cell receptor-proximal signals are sustained in peripheral microclusters and terminated in the central supramolecular activation cluster. Immunity 25:117–127.
- Xavier R, Brennan T, Li Q, McCormack C, Seed B. 1998. Membrane compartmentation is required for efficient T cell activation. Immunity 8:723–732.
- Yokosuka T, Sakata-Sogawa K, Kobayashi W, Hiroshima M, Hashimoto-Tane A, Tokunaga M, Dustin ML, Saito T. 2005. Newly generated T cell receptor microclusters initiate and sustain T cell activation by recruitment of Zap70 and SLP-76. Nature Immunol 6:1253–1262.