Abstract
FTIR and cryomicroscopy have been used to study mouse embryonic fibroblast cells (3T3) during freezing in the absence and presence of DMSO and glycerol. The results show that cell volume changes as observed by cryomicroscopy typically end at temperatures above −15°C, whereas membrane phase changes may continue until temperatures as low as −30°C. This implies that cellular dehydration precedes dehydration of the bound water surrounding the phospholipid head groups. Both DMSO and glycerol increase the membrane hydraulic permeability at subzero temperature and reduce the activation energy for water transport. Cryoprotective agents facilitate dehydration to continue at low subzero temperatures thereby decreasing the incidence of intracellular ice formation. The increased subzero membrane hydraulic permeability likely plays an important role in the cryoprotective action of DMSO and glycerol. In the presence of DMSO water permeability was found to be greater compared to that in the presence of glycerol. Two temperature regimes were identified in an Arrhenius plot of the membrane hydraulic permeability. The activation energy for water transport at temperature ranging from 0 to −10°C was found to be greater than that below −10°C. The non-linear Arrhenius behavior of Lp has been implemented in the water transport model to simulate cell volume changes during freezing. At a cooling rate of 1°C min-1, ∼5% of the initial osmotically active water volume is trapped inside the cells at −30°C.
Introduction
Cryopreservation is used for storage of cells, tissues and organs. The aim is to preserve cellular structures and biological functions at subzero temperatures when stored for long periods. The freezing and thawing processes, however, can cause irreversible damage to cells. Damage is the result of ice formation, osmotic stress, accumulating reactive oxygen species and peroxidation reactions, as well as conformational changes of biomolecules. Damage primarily affects the microdomain organization and phase state of membranes, which may result in membrane malfunctioning and leakage of intracellular solutes (Steponkus and Lynch Citation1989, Chatterjee and Gagnon Citation2001, Gousset et al. Citation2002, Wolkers et al. Citation2002).
Survival after cryopreservation is dependent on the cooling rate (Mazur Citation1984). This is described as the two-factor hypothesis (Mazur et al. Citation1972). During slow cooling, extracellular ice formation results in an increase in the intracellular solute concentration in the unfrozen fraction. In order to achieve chemical equilibrium, the cell responds by transporting intracellular water to the extracellular ice phase. Consequently, cellular dehydration takes place inducing mechanical stress and deformation. Damage resulting from cellular dehydration is referred to as ‘solute effects injury'. During rapid cooling, the cell does not have sufficient time to respond osmotically upon extracellular ice formation and consequently intracellular ice is formed. Intracellular ice causes cellular rupture and is generally considered lethal for cells. Cells typically have an optimal cooling rate for cryopreservation resulting in minimal damage due to solute effects injury and intracellular ice formation (Mazur et al. Citation1972).
Cell permeability to water affects the rate of water loss during cooling; more permeable cells are able to tolerate rapid cooling better than less permeable cells. The membrane hydraulic permeability and corresponding activation energy for water transport (ELp) are cell-specific parameters that provide a measure for the rate of water transport under anisotonic conditions. The temperature dependence of the membrane hydraulic permeability changes above and below the water-to-ice phase change (Schwartz and Diller Citation1983, Aggarwal et al. Citation1988, Devireddy et al. Citation2006). In a previous study, we have shown that the Arrhenius relationship of the membrane permeability to water at suprazero temperature differs from that at subzero temperatures (Akhoondi et al. Citation2011). The activation energy for water transport sharply increases upon extracellular ice formation. Cryoprotective agents decrease the cooperativity of freezing induced membrane phase changes (Oldenhof et al. Citation2010), which coincides with a decrease in the activation energy for water transport (Gilmore et al. 1995, Devireddy et al. Citation2002, Citation2006, Oldenhof et al. Citation2010). The models that have been developed to predict cellular dehydration during freezing require experimentally determined values of Lpg (Lp at a reference temperature), ELp, the isotonic cell volume (Vo) and the osmotically inactive cell volume (Vb). Once these cell-specific parameters are known, cellular dehydration can be predicted as a function of the cooling rate (Mazur Citation1963, Citation1984, Toner et al. Citation1990). The cell geometrical parameters are relatively easy to obtain. There are, however, a limited number of experimental techniques available that can be used to determine subzero membrane permeability parameters of cells. Cryomicroscopy can be used to study cellular dehydration during freezing (Leibo et al. Citation1978, Diller Citation1982, Stott and Karlsson Citation2009). Membrane hydraulic permeability parameters (Lpg and ELp) can be derived by fitting the water transport equations to the experimentally obtained cellular dehydration curves. Alternatively, differential scanning calorimetry (DSC) can be used to derive membrane hydraulic permeability parameters of cells by studying the difference in heat release of ice formation during freezing between osmotically active and inactive (dead) cells (Devireddy et al Citation1998, Citation2002, Citation2006). We have reported on the use of Fourier transform infrared spectroscopy (FTIR) to determine subzero water transport parameters from experimentally obtained curves of membrane phase behavior and ice formation during cooling (Oldenhof et al. Citation2010, Citation2012, Akhoondi et al. Citation2011).
This study aims to compare und use cryomicroscopy and FTIR to obtain subzero membrane permeability parameters of cells. FTIR and cryomicroscopy were used to study subzero membrane phase behavior and cellular dehydration during freezing of mouse embryonic fibroblast cells (3T3). Membrane hydraulic permeability parameters were derived from both techniques and compared to those in the presence of DMSO and glycerol. The results show that cryomicroscopically observed cell volume changes typically end at temperatures above −15°C, whereas membrane dehydration as determined by FTIR may continue until temperatures as low as −30°C. Membrane dehydration displays two temperature regimes in an Arrhenius plot with distinct activation energies. The different activation energies were used to simulate the cell dehydration response for different cooling rates, and to predict the optimal cooling rate for cryopreservation.
Materials and methods
Cell culture conditions
Mouse embryonic feeder (3T3) cells were cultured in T75-flasks (Biochrom, Berlin, Germany). Cultures were grown in Dulbecco's modified Eagle medium (DMEM) supplemented with 10% fetal bovine serum and 100 units ml-1 penicillin/streptomycin (Biochrom, Berlin, Germany) at 37°C under 5% CO2. After 3 days they were transferred into fresh medium. When reaching 70–80% confluency, cells were trypsinized by addition of 2 ml 0.25% (v/v) trypsin and incubation for 3 min. They were harvested by centrifugation at 1000 g for 8 min at 4°C, and resuspended in culture medium.
For testing the effects of cryoprotective agents, culture medium supplemented with two times the final concentration cryoprotectant was added dropwise to an equal volume of cell suspension, while keeping the cells on ice. Glycerol and dimethyl sulfoxide (DMSO) were tested as cryoprotective agents at a final concentration of 5% (v/v). After addition of cryoprotectant, cell suspensions were incubated for 10 min on ice to allow for diffusion.
Fourier transform infrared spectroscopy studies
Cell pellets for FTIR analysis were obtained by centrifugation at 1400 g for 1 min. Approximately 10 μl hydrated pellet was sandwiched between two CaF2 windows and mounted in the sample holder.
Infrared absorption measurements were carried out with a Perkin-Elmer 100 FTIR spectrometer (Perkin Elmer, Norwalk, CT, USA), equipped with a liquid nitrogen cooled mercury/cadmium/telluride detector. The optical bench was continuously purged with dry air from an FTIR purge gas generator (Whatman, Clifton, NJ, USA). The acquisition parameters were: 4 cm-1 resolution, 8 co-added interferograms and 4000–900 cm-1 wavenumber range. Spectra analysis and display were carried out using Perkin-Elmer (Perkin-Elmer, Norwalk, CT, USA) and Omnic software (Thermo-Nicolet, Madison, WI, USA), as well as Matlab software (Mathworks, Ismaning, Germany). Data analysis on membrane phase behavior and ice formation during cooling was done as previously described (Oldenhof et al. Citation2010, Akhoondi et al. Citation2011). Changes in membrane conformational disorder were monitored by observing the position of the CH2 symmetric stretching band at approximately 2850 cm-1 (νCH2) as a function of the sample temperature. Ice formation was monitored by following the position and area of the H2O-libration and -bending band at approximately 2200 cm-1 (AνH2O). This was done for different ice nucleation temperatures (Tn).
Temperature-dependent FTIR measurements, were performed using a variable temperature sample holder with heater device (Harrick Scientific Products, Pleasantville, NY, USA) together with a pump system for using liquid nitrogen as a coolant (Linkam Scientific Instruments, Tadworth, Surrey, UK). The sample temperature was monitored using a thermocouple that was located close to the sample. Samples were equilibrated at 20°C after which they were cooled down to −40°C at 1°C min-1, while spectra were acquired every 20 s. Ice nucleation was induced at temperatures between −2 and −20°C by touching the sample edge using a copper wire that was cooled using liquid nitrogen.
Cryomicroscopy studies
Concentrated cell suspensions for cryomicroscopic analysis were obtained by centrifugation as described above. Approximately 5 μl was added onto a sapphire disk that was cooled to 4°C. The sample was covered with a cover slip, and mounted in the sample holder.
Cryomicroscopic measurements were performed with an Axio imager cryomicroscope using a 20 × long distance objective lens (Zeiss, Jena, Germany), and a camera that allows for collecting images with 5 frames per second (Retiga EXi Fast 1394, QImaging, Canada). The temperature of the sample holder is controlled via a THMS600 heating device and a liquid nitrogen pump system for cooling (Linkam Scientific Instruments, Tadworth, Surrey, UK). Linksys 32 software was used for controlling the sample temperature and image acquisition.
Samples were cooled from 4°C down to the desired nucleation temperature at 1°C min-1. Ice nucleation was induced by touching the sample with a liquid-nitrogen cooled copper wire after which the sample was further cooled down to −40°C at 1°C min-1.
Water transport model during freezing
The reduction in the cellular volume that occurs during freezing has been described by the water transport model (Mazur Citation1963, Citation1984, Levin et al. Citation1976, Toner et al. Citation1990). The water transport model was further modified to incorporate the effects of cryoprotectants (Toner et al. Citation1990, Devireddy et al. Citation2002):
The permeability of the plasma membrane to water (Lp in m s-1 Pa -1) is defined by an Arrhenius relationship:
Lpg is the membrane hydraulic permeability at 0°C, and ELp is the apparent activation energy for water transport through the membranes during freezing (in J mol-1). Parameters and variables for Equations (1) and (2) are summarized in . Dimensions of 3T3 cells were taken from Akhoondi et al. (Citation2011).
Table I. Parameters and variables for Equations (1) and (2). Dimensions of 3T3 cells were taken from Akhoondi et al. (Citation2011).
Assessment of membrane permeability parameters
Methods to derive membrane permeability parameters (Lp, Lpg, ELp,) from freezing induced membrane phase behavior data determined by FTIR are described in detail elsewhere (Oldenhof et al. Citation2010, Akhoondi et al. Citation2011). It is assumed that the freezing-induced shift in the CH2 wavenumber position (νCH2) is proportional to the reduction in cellular volume that occurs due to water transport out of the cell in response to freezing. For different ice nucleation temperatures, νCH2 versus temperature plots were constructed. Prior to normalization a baseline correction was performed to correct for the thermotropic decrease in νCH2 with decreasing temperature. The shift in νCH2 was scaled such that the normalized volume was 1 just before freezing-induced dehydration, and the maximum shift in νCH2, as obtained at the highest nucleation temperature, corresponds to maximum cellular dehydration (Vb). Partial dehydration, as obtained at lower nucleation temperatures, was scaled relative to this. This results in the V/Vo versus temperature plots for different nucleation conditions. The slope at nucleation was determined from these plots, and was multiplied with Vo to obtain dV/dT, which in turn was used to calculate the membrane hydraulic permeability (Lp) using Equation (1). The natural logarithm of Lp was plotted as a function of the inverse of the nucleation temperature in an Arrhenius plot, which was used to derive the activation energy (ELp) and the membrane hydraulic permeability at 0°C (Lpg).
A similar approach was used to derive Lp, Lpg, ELp from cell size measurements obtained with cryomicroscopic measurements. The volume response of cells during freezing was directly measured as changes in cell diameter. For each cooling scan, a minimum of 5 cells was followed for which the diameter was measured manually at 1°C intervals, using the Linksys 32 software (Linkam Scientific Instruments, Tadworth, Surrey, UK). Cell volumes were calculated from the obtained diameter values assuming a spherical shape.
Normalized cell volumes (V/Vo) were calculated by dividing the cell volume (V) by the cell volume prior to nucleation (Vo). Plots of the normalized volume as a function of the sample temperature were made for different nucleation temperatures. The initial volume change during cooling, (dV/dT) and Lp were calculated as described above, with the parameters listed in . Volume normalizations were performed using the cryomicroscopally determined begin and end volume of the cells. The end volume at −30°C was taken as Vb. It should be noted that the end volume reached lower values as Vb previously determined for this cell type by Coulter counter measurements (Akhoondi et al. Citation2011).
Estimation of optimal cooling rates using the water transport model
To simulate water transport and the volume response of cells at different cooling rates, the hydraulic membrane permeability parameters derived from experimental studies described above were used to solve Equations (1) and (2). Equation (1) was solved with the Runge-Kutta 4th order method using Matlab software (Mathworks, Ismaning, Germany). Normalized cell volume versus temperature plots were constructed for various cooling rates. Furthermore, an equilibrium curve was constructed using the following Equation (Mazur Citation1984):
where Mi is initial osmolality of the extracellular solution and other parameters as listed in .
The cooling rate was assumed to be optimal when the trapped water inside the cell at −30°C is 5% of the initial osmotic active water (or 95% of Vo-Vb) (Devireddy et al. Citation2002).
Results
In situ FTIR spectra of 3T3 cells acquired during freezing
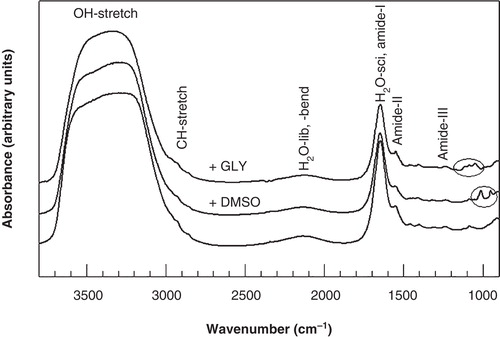
shows FTIR spectra of 3T3 cells in the absence of CPAs and in the presence of 5% DMSO and 5% glycerol. The CH2-stretching vibration band at around 2850 cm-1 arising from endogenous lipids, and the H2O-libration and -bending combination band at 2200 cm-1 are indicated in the Figure. Typical bands arising from glycerol and DMSO are visible in the 1200–900 cm-1 fingerprint region of the spectrum. Changes in membrane fluidity can be monitored by following the lipid band position (νCH2), whereas the kinetics of ice formation can be determined using the band position or area of the water band (νH2O or AνH2O). Glycerol contains CH groups, but these groups have a negligible contribution to the lipid CH2-stretching vibration band that was used for lipid analysis (data not shown). DMSO contains CH3 groups that do not interfere with the lipid CH2 symmetric stretching vibration.
Figure 1. Infrared absorption spectra of 3T3 cells, acquired at 20°C in the absence and presence of DMSO and glycerol. The OH-stretching, H2O-libration and bending combination band, and the H2O scissoring band arising from water, the CH2-stretching bands mainly arising from membrane lipids, and the protein amide bands are indicated. Typical bands arising from glycerol and DMSO are visible in the 1200–900 cm-1 fingerprint region of the spectrum.
shows νCH2 versus temperature plots of 3T3 cell pellets that were nucleated at either −4 or −10°C in the absence and presence of cryoprotective agents. It can be seen that ice nucleation coincides with an abrupt decrease in the CH2 wavenumber position. This is the result of removal of the water surrounding the phospholipid head groups causing a stronger packing of the acyl chains and increased van der Waals interactions between the CH groups. The initial slope at this freezing-induced membrane phase transition provides a measure for the membrane dehydration rate. The extent of membrane dehydration is related to the temperature at which ice is formed. Upon ice nucleation at −10°C, membranes remain relatively fluid at −30°C compared to membranes exposed to nucleation at −4°C, both in the absence and presence of cryoprotectants.
Figure 2. Membrane phase behavior of 3T3 cells during cooling in the absence of cryoprotective agents (open squares) as well as in presence of 5% DMSO (black squares) or glycerol (gray squares). Cell pellets were cooled from 20 to −40°C at cooling rate of 1°C min-1, and nucleated at either −4°C (A) or −10°C (B). The wavenumber position of the symmetric CH2 stretching vibration band is plotted as a function of the sample temperature.
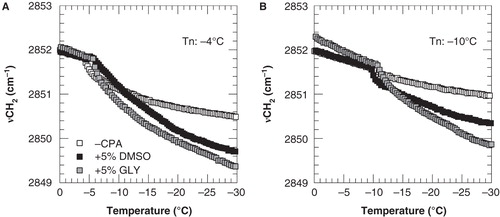
Cryoprotective agents decrease the cooperativity of the freezing-induced membrane phase transition. Freezing-induced membrane dehydration in the presence of DMSO or glycerol occurs more gradual over a larger temperature range. The increased ΔνCH2 at −30°C in the presence of CPAs indicates that the total extent of dehydration increases in the presence of cryoprotective agents.
Freezing-induced cell volume response derived from subzero cryomicroscopic and FTIR measurements
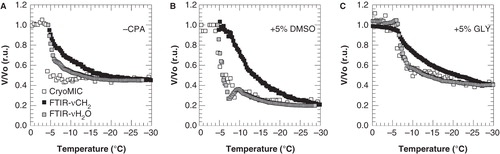
shows a comparison of cellular and membrane dehydration determined using cryomicroscopy and FTIR respectively, in the absence and presence of glycerol or DMSO. Extracellular ice formation was induced at −4°C. FTIR data have been transformed in volume data in order to compare the kinetics of dehydration with cryomicroscopy data. The cell volume at −30°C determined from cryomicroscopic measurements was taken as the osmotic inactive cell volume and used to scale the freezing-induced changes in the membrane lipid band position and water band area data. The freezing-induced cell volume response as derived from the water band area data, closely resembles the cryomicroscopic volume measurements, whereas the cell volume normalized lipid band data shows a delayed dehydration behavior both in the absence and presence of cryoprotectants.
Figure 3. Cell volume response of 3T3 cells during cooling from 4°C down to −30°C at 1°C min-1, with ice nucleation at −5°C, in the absence of cryoprotective agents (A) and in presence of 5% DMSO (B) or glycerol (C). The cell volume response was determined as changes in cell size using cryomicroscopy (open squares) as well as derived from changes in the membrane lipid band (FTIR-νCH2; black squares) and water band (FTIR AνH2O; gray squares) determined using FTIR. Cell volumes were normalized towards the initial value prior to ice nucleation, and FTIR data were scaled towards the end volume as assessed using cryomicroscopy.
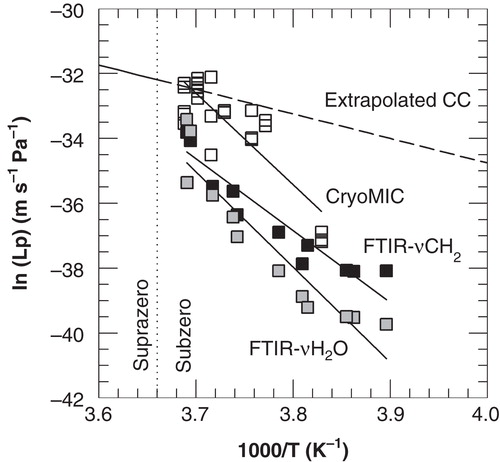
shows Arrhenius plots of the subzero membrane hydraulic permeability as a function of the ice nucleation temperature as derived from cryomicroscopic cell size measurements and FTIR measurements of membrane phase behavior and ice formation. also shows the extrapolated Arrhenius plot obtained from suprazero Coulter counter Lp measurements (adapted from Akhoondi et al. Citation2011). The cryomicroscopic cell size and spectroscopic water band area measurements yielded similar values for ELp of respectively 56.0 and 58.5 kcal mol-1, whereas lipid band analysis revealed a lower value for ELp of 44.1 kcal mol-1. Both FTIR and cryomicroscopy measurements show a strong increase in ELp at subzero temperatures. The absolute values of Lp, however, differ between both methods. summarizes membrane permeability parameters (ELp and Lpg) determined using suprazero Coulter counter as well as subzero cryomicroscopy and FTIR measurements. The subzero ELp values determined by FTIR resemble those determined by cryomicroscopy. Lp values determined by FTIR, however, are lower compared to those observed by cryomicroscopy. This is likely due to differences in experimental methodology between both techniques. With cryomicroscopy, cell volume changes are determined from cell diameter changes, whereas with FTIR water transport processes are inferred from ice kinetics and membrane phase changes during freezing. Furthermore, the sample preparation methods are different: with cryomicroscopy single cells are measured, whereas for FTIR measurements cell pellets are needed.
Table II. Subzero hydraulic membrane permeability parameters of 3T3 cells. Membrane permeability parameters were derived from cryomicroscopic as well as lipid band position (νCH2) and water band area (AνH2O) measurements.
Figure 4. Arrhenius plot of the membrane hydraulic permeability of 3T3 cells as a function of the nucleation temperature, as derived from cryomicroscopic studies (open squares) and membrane lipid band (FTIR-νCH2; black squares) and water band (FTIR- AνH2O; gray squares) analysis from FTIR studies. The dashed line represents extrapolated Coulter counter data from previous experiments performed at suprazero temperatures (Akhoondi et al. Citation2011).
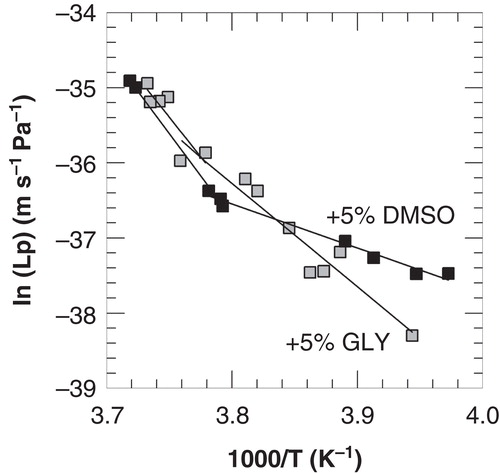
Arrhenius plot demonstrates two temperature ranges with different freezing-induced subzero water transport across cellular membranes in presence of cryoprotectants
shows Arrhenius plots of membrane hydraulic permeabilities derived from freezing-induced membrane dehydration measurements (FTIR) in the presence of 5% DMSO as well as glycerol. Two temperature ranges can be identified in the Arrhenius plot with different activation energies. In the temperature range from 0 to about −10°C, the activation energy for water transport is relatively high compared to that in the temperature range from −10 to −20°C (listed in ). This discontinuity in the Arrhenius plot of Lp, is also observed with cryomicroscopy and FTIR-νH2O data (data not shown).
Table III. Subzero hydraulic membrane permeability parameters of 3T3 cells incubated in the presence of 5% DMSO or glycerol (GLY). Arrhenius plots derived from FTIR-νCH2 data were constructed. ELp-1 and Lpg-1 values were determined using linear regression analysis at high subzero temperatures, whereas ELp-2 and Lpg-2 were determined at low subzero temperature.
Figure 5. Arrhenius plots of the membrane hydraulic permeability of 3T3 cells as a function of the nucleation temperature in the presence of 5% DMSO (open squares) or glycerol (black squares), derived from membrane lipid band analysis from FTIR studies. Linear regression lines are indicated in the temperature ranges above and below −9 and −7°C for DMSO and glycerol, respectively.
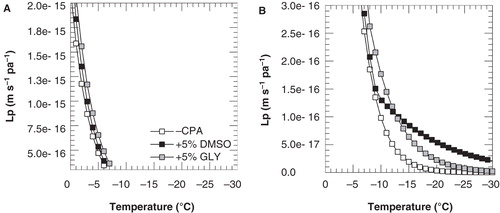
Using the parameters determined as described above and Equation (2), membrane hydraulic permeability during cooling of 3T3 cells was simulated as a function of the temperature (). shows that Lp values are similar from 0°C to −10°C in the presence and absence of cryoprotectants and diverge below −10°C. At temperatures below −10°C, Lp values are clearly higher in the presence of cryoprotective agents (panel B). Furthermore it can be seen that Lp values in the presence of DMSO are higher compared to those in the presence of glycerol.
Figure 6. Membrane hydraulic permeability as a function of the temperature, as calculated using Equation (1) and the parameter listed in and , for cooling of 3T3 cells with 1°C min-1 in the absence of cryoprotective agents (open squares) as well as in presence of 5% DMSO (black squares) or glycerol (gray squares). To illustrate differences more clearly, different scales were used for the y-axis in panels A and B. Lp was calculated for above and below −9 and −7°C for DMSO and glycerol, respectively, using the different ELp and Lpg values as determined for these temperature ranges.
Prediction of freezing-induced cellular dehydration and optimal cooling rates with different cryoprotective agents
Freezing-induced cellular dehydration was simulated () for various cooling rates, in the absence and presence of DMSO or glycerol, using Equation (1) and the parameters listed in and . The minimum cell volume or Vb was taken from cryomicroscopic measurements (see ). The equilibrium curve was calculated using Equation (3).
Figure 7. Cell volume response of 3T3 cells during cooling with different cooling rates in the absence of cryoprotective agents (A) as well as in presence of 5% DMSO (B) or glycerol (C), as calculated using Equation (1) and the parameter listed in and . Normalized cell volumes were calculated above and below −9 and −7°C for DMSO and glycerol, respectively, using the different ELp and Lpg values as determined for these temperature ranges. The dashed line illustrates the cell volume response under equilibrium conditions, as calculated using Equation (3).
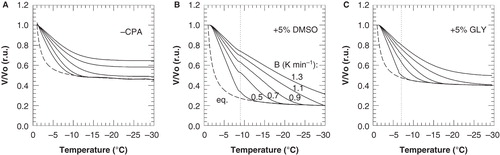
The optimal cooling rate is considered to be the cooling rate at which 95% of the maximum cellular dehydration has taken place at −30°C (Devireddy et al. Citation2002). Based on this assumption, the optimal cooling rate was estimated to be 0.9°C min-1 in the absence of cryoprotectants, and 1.1 and 1.2°C min-1 in the presence of DMSO and glycerol, respectively.
Discussion
FTIR and cryomicroscopy have been used to study mouse embryonic fibroblast cells (3T3) during freezing in real time. The results show that cell volume changes as observed by cryomicroscopy typically end at temperatures above −15°C, whereas membrane phase changes may continue until temperatures as low as −30°C. Two temperature regimes were identified in an Arrhenius plot of the membrane hydraulic permeability with distinct activation energies. Cryoprotective agents increase water permeability and decrease the activation energy for water transport.
Freezing-induced cellular dehydration and intracellular ice formation has been studied in a variety of mammalian cells using cryomicroscopy (Diller Citation1982, McCaa et al. Citation1991, Hubel et al. Citation1999, Stott and Karlsson Citation2009). The advantage of FTIR is that transport of free intracellular water and bound water can be measured separately by analyzing different spectral regions (Wolkers et al. Citation2007, Balasubramanian et al. Citation2009, Oldenhof et al. Citation2010, Wolkers and Oldenhof Citation2010). Cell volume changes precede membrane dehydration. Cellular dehydration mainly results from movement of free intracellular water to the extracellular milieu, whereas membrane dehydration involves removal of the bound water surrounding the phospholipid head groups (Oldenhof et al. Citation2010). The freezing-induced gel phase formation likely also results in a cell volume decrease, but this cannot be observed by cryomicroscopy possibly due to resolution limitations. Cryomicroscopic cell volume measurements showed that freezing in the presence of DMSO or glycerol resulted in a lower minimum cell volume as the osmotically inactive cell volume (Vb) previously determined via suprazero Boyle van 't Hoff analysis of Coulter counter volume measurements in (an)isotonic media (Akhoondi et al. Citation2011). This is likely due to the removal of bound water during freezing, which is not taking place under hypertonic conditions at suprazero temperatures. Alternatively non-linear Boyle van 't Hoff behavior may explain the differences in the experimentally determined osmotically inactive cell volume (Katkov Citation2011).
Water transport across cellular membranes may occur through different pathways each with a characteristic activation energy (reviewed in Elmoazzen et al. Citation2002). The activation energy for water transport through water channel proteins such as aquaporins, is about 6 kcal mol-1, whereas the activation energy for passive diffusion through the phospholipid bilayer is greater than 10 kcal mol-1 (Elmoazzen et al. Citation2002). The activation energy for water transport drastically increases at subzero temperatures in the presence of extracellular ice (Akhoondi et al. Citation2011). Both DMSO and glycerol reduce the activation energy for water transport and increase the total extent membrane dehydration at low subzero temperatures. This has also been observed in sperm (Oldenhof et al. Citation2010, Citation2012).
Complex lipid phase transitions in biological membranes and the presence of multiple pathways for water transport have been implicated to result in non-linear Arrhenius plots at suprazero temperatures (Verkman et al. Citation1996). The water permeability of V-79 Chinese hamster lung fibroblasts displays a discontinuity in an Arrhenius plots at suprazero temperatures which was correlated to the phase state of the membrane lipids (Rule et al. Citation1980). Our studies clearly show that freezing causes a change in membrane phase state, which may explain the non-linear Arrhenius behavior of water permeability. DMSO decreases the water permeability in V-79 Chinese hamster lung fibroblasts at suprazero temperatures (Rule et al. Citation1980), and DMSO and glycerol were shown to decrease water permeability in human sperm (Gilmore et al. Citation1995). Interestingly, we show here that these observations cannot be extrapolated to subzero temperatures. DMSO and glycerol increase water permeability at subzero temperatures allowing water transport to continue even at low temperatures. The latter, likely plays an important role in the cryoprotective action of DMSO and glycerol. In the presence of DMSO, which is typically used for cryopreservation of these cell types, water permeability was found to be greater compared to that in the presence of glycerol. The increased dehydration in the presence of CPAs may reduce the risk of intracellular ice formation. Cell survival depends on the response of cell to three major variables: cooling rate, type and concentration of protective agents (Mazur Citation1984). Changes in permeability with CPA addition affect cellular dehydration and thus the optimal cooling rate yielding maximum survival after freezing and thawing (Mazur Citation1984). Smith et al. (Citation1998) reported a drop in activation energy as well as in Lpg for rat hepatocytes in the presence of DMSO and showed that less dehydration occurs at temperatures between 0 and −10°C. Dehydration, however, was found to continue at lower temperatures (<−10°C) in the presence of DMSO. This means that cryoprotective agents increase water permeability, but only at lower temperatures where water transport would otherwise be shut off.
Simulation of the cell volume response during freezing at different cooling rates can be done using the water transport model (Toner et al. Citation1990). The water transport model assumes linear Arrhenius behavior of Lp. However, we show here that Lp display non-linear Arrhenius behavior at subzero temperatures. We have implemented the non-linearity of Lp in the water transport model to describe cell volume changes during freezing. At a cooling rate of approximately 1°C min-1 cell volume reduces by 95%. Under those conditions 5% of the initial osmotically active water is trapped. The ‘optimal cooling rate' has been defined as the cooling rate at which ∼5% of the initial osmotically active water volume is trapped inside the cells at −30°C (Mazur Citation1984, Devireddy et al. Citation2002). The ‘5% trapped water volume rule', however, may vary among different cell types, which will affect the predicted optimal cooling rate. Certain cell types are able to tolerate higher residual water levels and attached cells may differ from cells in suspension (Mazur Citation1984, Choi and Bischof Citation2011). We also note that the FTIR studies that have been done here have been conducted at slow cooling rates. The water permeability parameters may show cooling rate dependence as has been reported by Devireddy et al. (Citation2002). The estimated optimal cooling rate for 3T3 cells of about 1°C min-1 is in good agreement with experimental studies for human fibroblasts (Böhmer et al. Citation1973).
Taken together, we show that cryoprotective agents facilitate dehydration to continue even at low subzero temperatures thereby decreasing the incidence of intracellular ice formation. The membrane permeability to water at subzero temperatures displays non-linear Arrhenius behavior, which ought to be taken into account in subzero water transport modeling.
Acknowledgements
This work was financially supported by the German Research Foundation (Deutsche Forschungsgemeinschaft, DFG), Cluster of Excellence ‘From regenerative biology to reconstructive therapy' (REBIRTH).
Declaration of interest: The authors report no conflicts of interest. The authors alone are responsible for the content and writing of the paper.
References
- Aggarwal SJ, Diller KR, Baxter CR. 1988. Hydraulic permeability and activation energy of human keratinocytes at subzero temperatures. Cryobiology 25:203–211.
- Akhoondi M, Oldenhof H, Stoll C, Sieme H, Wolkers WF. 2011. Membrane hydraulic permeability changes during cooling of mammalian cells. Biochim Biophys Acta 1808:642–648.
- Balasubramanian SK, Wolkers WF, Bischof JC. 2009. Membrane hydration correlates to cellular biophysics during freezing in mammalian cells. Biochim Biophys Acta 1788:945–953.
- Böhmer HV, Wöhler W, Wendel U, Passarge E, Rüdiger HW. 1973. Studies on optimal cooling rate for freezing human diploid fibroblasts. Exp Cell Res 79:496–498.
- Chatterjee S, Gagnon C. 2001. Production of reactive oxygen species by spermatozoa undergoing cooling, freezing and thawing. Mol Reprod Dev 59:451–458.
- Choi J, Bischof JC. 2011. Cooling rate dependent biophysical and viability response shift with attachment state in human dermal fibroblast cells. Cryobiology 63:285–291.
- Devireddy RV, Raha D, Bischof JC. 1998. Measurement of water transport during freezing in cell suspensions using a differential scanning calorimeter. Cryobiology 36:124–155.
- Devireddy RV, Li G, Leibo SP. 2006. Suprazero cooling conditions significantly influence subzero permeability parameters of mammalian ovarian tissue. Mol Reprod Dev 73:330–341.
- Devireddy RV, Swanlund DJ, Olin T, Vincente W, Troedsson MHT, Bischof JC, 2002. Cryopreservation of equine sperm: Optimal cooling rates in the presence and absence of cryoprotective agents determined using differential scanning calorimetry. Biol Reprod 66:222–231.
- Diller KR. 1982. Quantitative low temperature optical microscopy of biological systems. J Microsc 126:9–28.
- Elmoazzen HY, Elliott JAW, McGann LE. 2002. The effect of temperature on 543 membrane hydraulic conductivity. Cryobiology 45:68–79.
- Gilmore JA, McGann LE, Liu J, Gao DY, Peter AT, Kleinhans FW, 1995. Effect of cryoprotectant solutes on water permeability of human spermatozoa. Biol Reprod 53:985–995.
- Gousset K, Wolkers WF, Tsvetkova NM, Oliver AE, Field CL, Walker NJ, 2002. Evidence for a physiological role for membrane rafts in human platelets. J Cell Physiol 119:117–128.
- Hubel A, Norman J, Darr TB. 1999. Cryobiophysical characteristics of genetically modified hematopoietic progenitor cells. Cryobiology 38:140–153.
- Katkov II.. 2011. On proper linearization, construction and analysis of the Boyle-van't Hoff plots and correct calculation of the osmotically inactive volume. Cryobiology 62:232–241.
- Leibo SP, Mcgrath JJ, Cravalho EG. 1978. Microscopic observation of intracellular ice formation in unfertilized mouse ova as a function of cooling rate. Cryobiology 15:257–271.
- Levin RL, Cravalho EG, Huggins CE. 1976. A membrane model describing the effect of temperature on the water conductivity of erythrocyte membranes at subzero temperatures. Cryobiology 13:415–429.
- McCaa C, Diller KR, Aggarawal SJ, Takahashi T. 1991. Cryomicroscopic determination of the membrane osmotic properties of human monocytes at subfreezing temperatures. Cryobiology 28:391–399.
- Mazur P. 1963. Kinetics of water loss from cells at subzero temperatures and the likelihood of intracellular freezing. J Gen Physiol 47:347–369.
- Mazur P. 1984. Freezing of living cells: mechanisms and implications. Am J Physiol 247:C125–C142.
- Mazur P, Leibo SP, Chu EHY. 1972. A two-factor hypothesis of freezing injury. Exp Cell Res 71:345–355.
- Oldenhof H, Friedel K, Sieme H, Glasmacher B, Wolkers WF. 2010. Membrane permeability parameters for freezing of stallion sperm as determined by Fourier transform infrared spectroscopy. Cryobiology 61:115–122.
- Oldenhof H, Friedel K, Akhoondi M, Gojowsky M, Wolkers WF, Sieme H. 2012. Membrane phase behavior during cooling of stallion sperm and its correlation with freezability. Mol Membr Biol 2012;29:95-106.
- Rule GS, Law P, Kruuv J, Lepock JR. 1980. Water permeability of mammalian cells as a function of temperature in the presence of dimethylsulfoxide: Correlation with the state of the membrane lipids. J Cell Physiol 103:407–416.
- Smith DJ, Schulte M, Bischof JC. 1998. The effect of dimethylsulfoxide on the water transport response of rat hepatocytes during freezing. J Biomech Eng 120:549–558.
- Schwartz GJ, Diller KR. 1983. Osmotic response of individual cells during freezing. II. Membrane permeability analysis. Cryobiology 20:542–552.
- Steponkus PL, Lynch DV. 1989. Freeze/thaw-induced destabilization of the plasma membrane and the effects of cold acclimation. J Bioenerg Biomembranes 21:21–41.
- Stott ST, Karlsson JOM. 2009. Visualization of intracellular ice formation using high-speed video cryomicroscopy. Cryobiology 58:84–95.
- Toner M, Cravalho EG, Armant DR. 1990. Water transport and estimated transmembrane potential during freezing of mouse oocytes. J Membr Biol 115:261–272.
- Verkman AS, VanHoek AN, Ma T, Frigeri A, Skach WR, Mitra A, 1996. Water transport across mammalian cell membranes. Am J Physiol 270:C12–C30.
- Wolkers WF, Balasubramanian SK, Ongstad EL, Zec HC, Bischof JC. 2007. Effects of freezing on membranes and proteins in LNCaP prostate tumor cells. Biochim Biophys Acta 1768:728–736.
- Wolkers WF, Crowe LM, Tsvetkova NM, Tablin F, Crowe JH. 2002. In situ assessment of erythrocyte membrane properties during cold storage. Mol Membr Biol 19:59–65.
- Wolkers WF, Oldenhof H. 2010. In situ FTIR studies on mammalian cells. Spectroscopy 24:525–534.