Abstract
Background: The involvement of aquaporin (AQP) water and small solute channels in the etiology of several diseases, including cancer, neuromyelitis optica and body fluid imbalance disorders, has been suggested previously. Furthermore, results obtained in a mouse model suggested that AQP9 function contributes to hyperglycemia in type-2 diabetes. In addition, the physiological role of several AQP family members remains poorly understood. Small molecule inhibitors of AQPs are therefore desirable to further study AQP physiological and pathophysiological functions. Methods: The binding of recently established AQP9 inhibitors to a homology model of AQP9 was investigated by molecular dynamics simulations and molecular docking. Putative inhibitor binding sites identified with this procedure were modified by site-directed mutagenesis. Active compounds were measured in a mammalian cell water permeability assay of mutated AQP9 isoforms and tested for changes in inhibitory effects. Controls: Three independent cell lines were established for each mutated AQP9 isoform and functionality of mutant isoforms was established. Principal findings: We have identified putative binding sites of recently established AQP9 inhibitors. This information facilitated successful identification of novel AQP9 inhibitors with low micromolar IC50 values in a cell based assay by in silico screening of a compound library targeting specifically this binding site. Significance: We have established a successful strategy for AQP small molecule inhibitor identification. AQP inhibitors may be relevant as experimental tools, to enhance our understanding of AQP function, and in the treatment of various diseases.
Introduction
In all living cells, the movement of water and solutes across the cell membrane is crucial for osmotic balance. Proteins of the aquaporin (AQP) family facilitate the permeation of water and small neutral solutes across biological lipid membranes. In 1991, CHIP28 (Preston and Agre Citation1991) later named AQP1, due to its function as a water channel (Preston et al. Citation1992), was cloned from liver cDNA and described as a member of the major intrinsic protein family (MIP). At that point, this highly conserved family included the bacterial glycerol facilitator GlpF (Muramatsu and Mizuno Citation1989), major intrinsic protein of lens (Gorin et al. Citation1984), the drosophila big brain gene product (Rao et al. Citation1990) and several plant proteins (Sandal and Marcker Citation1988, Guerrero et al. Citation1990, Johnson et al. Citation1990, Yamamoto et al. Citation1990). Today, the aquaporin family of MIPs consists of 13 known members in mammals and an ever growing number of phylogenetically-related proteins in plants, lower eukaryotes and prokaryotes (Danielson and Johanson Citation2010).
Several high-resolution X-ray structures of AQPs revealed a conserved homo-tetrameric structure where each subunit provides an independent pore for water and other solutes (Gonen et al. Citation2004, Horsefield et al. Citation2008). Each monomer contains six membrane-spanning α-helical domains and two short segments which face the intracellular and extracellular vestibules. The latter segments contain a short helical part and the Asn-Pro-Ala (NPA) signature motifs, which are highly conserved among the AQP family. A second highly conserved feature of AQPs is an aromatic region at the extracellular vestibule that contains an arginine (Arg219 in AQP9). This so-called aromatic/arginine (ar/R) region acts as the main selectivity filter for neutral solutes. For AQP1 it has been shown that mutation of the corresponding residue (Arg195) to valine conveys proton leakage (Beitz et al. Citation2006). The first and second part of the protein share considerable sequence homology resulting in quasi two-fold structural symmetry in the plane of the membrane (Walz et al. Citation2009).
Several mammalian AQPs are of medical relevance, especially due to their function in renal fluid reabsorption (Rojek et al. Citation2008). Further examples for medically relevant involvement of AQPs are the role of AQP1 in tumor angiogenesis (Saadoun et al. Citation2005) and of AQP4 in the etiology of brain edema (Manley et al. Citation2000, Vajda et al. Citation2002, Amiry-Moghaddam et al. Citation2003, Citation2004, Papadopoulos et al. Citation2004) and neuromyelitis optica (Marignier et al. Citation2010). The mammalian AQPs 3, 7, 9 and 10 are permeable to water, glycerol and some small solutes (Rojek et al. Citation2008). Accordingly, these MIPs are phylogenetically more related to bacterial glycerol facilitators than to mammalian AQP true water channels (Ishibashi et al. Citation2009). Whether any of these glycerol facilitators are of medical relevance is currently not clear. However, homozygous deletion of the AQP7 gene in mice (AQP7-/- knockout mice) recently revealed important functions of this protein in antigen processing by skin dendritic cells (Hara-Chikuma et al. Citation2012) and AQP9-/- knockout mice showed remarkably reduced fasting blood glucose levels in a model of type-2 diabetes (Rojek et al. Citation2007). Accordingly, the potential use of specific glycerol facilitator inhibitors for treating skin-related allergies and type-2 diabetes has been suggested (Rojek et al. Citation2007, Hara-Chikuma et al. Citation2012). Furthermore, the potential medical applications of AQP1 and AQP4 inhibitors have been discussed in countless articles and have been reviewed recently (Huber et al. Citation2012). Besides known mercurial and other metal ion inhibitors, very few, less toxic, organic AQP inhibitors have been described (Brooks et al. Citation2000, Ma et al. Citation2004, Huber et al. Citation2007, Citation2009a, Migliati et al. Citation2009, Mola et al. Citation2009). In addition, there is currently dispute over the actual activity of several of these substances (Yang et al. Citation2006, Citation2008, Sogaard and Zeuthen Citation2008, Huber Citation2009). The slow discovery of organic AQP inhibitors may have been due to the lack of suitable assay systems that can be used to screen small molecule libraries. We and others have recently developed an assay system that can overcome this limitation (Klokkers et al. Citation2009, Mola et al. Citation2009, Fenton et al. Citation2010). In this assay, fluorescence intensity of the calcein fluorophore is affected by cell volume changes. Consequently, with knowledge about the relation between extracellular osmolarity, fluorescence intensity and cell volume, cell volume changes can be monitored as changes in fluorescence intensity (Fenton et al. Citation2010). Utilizing this type of assay, we have recently described the identification of organic AQP9 inhibitors in a small molecule screen (Jelen et al. Citation2011). However, it is costly to scale up this assay for screens of hundreds of thousands of compounds. Therefore, it is desirable to combine this approach with virtual screening to expedite the identification of novel AQP9 inhibitors. In this study, we describe the identification of a putative molecular interaction site between AQP9 and its inhibitors. Furthermore, we utilized this binding site to discover novel AQP9 inhibitors by in silico screening of a small molecule library. Finally, the inhibitory activity was confirmed in our biological assay system.
Methods
Site directed mutagenesis, stable cell lines and cell shrinking assays
hAQP9 was amplified from cDNA isolated from a human glioma cell line (U-87 MG), digested with KpnI and NotI and ligated with likewise digested pcDNA5/FRT/TO plasmid (Invitrogen). Site-directed exchanges were introduced into the resulting plasmid by polymerase chain reaction with PfuTurbo DNA polymerase (Stratagene), subsequent digestion of the product with DpnI and transformation into Escherichia coli. Isolated plasmids were sequenced, to confirm that only the desired base pair changes were introduced into hAQP9 encoding regions. Oligonucleotides utilized for amplification of hAQP9 and site-directed mutageneses are listed in Supplementary spreadsheet 1 (available online). Three stable CHO-hAQP9 cell lines were established as described previously (Jelen et al. Citation2011). Cell shrinking assays to assess relative cell water permeability were performed as described previously (Jelen et al. Citation2011). Individual cell lines of the same genotype did not reproducibly influence water permeability on different experimental days. For data analysis, results obtained on different experimental days with one cell line were therefore considered as independent data points. Statistical analyses were conducted in Graphpad Prism 5.0 and included two-way Analysis Of Variance (ANOVA) and Bonferroni post-tests. Chemical compound similarity was calculated at http://chemmine.ucr.edu/ChemMineToolsV2/mcs/sim.
Homology modeling
The sequences of the human isoform of AQP9 and the glycerol facilitator GlpF from E. coli where aligned utilizing the UniProt model server and the ClustalW sequence alignment algorithm. Both sequences shared a sequence identity of 35.7%. Based on this alignment a homology model was generated using the SWISS-MODEL server. In the end, the hydrogen bond network was optimized with WHATIF (http://dx.doi.org/10.1016/0263-7855(90)80070-V).
Molecular dynamics simulations
Molecular dynamics (MD) simulations were carried out using the Gromacs simulation software (Van Der Spoel et al. Citation2005, Hess et al. Citation2008). The simulations box contained the protein tetramer embedded in a lipid bilayer of DMPC lipids and around 18,000 SCPE (Berendsen et al. Citation1987) water molecules. 78 potassium ions and 86 chloride ions were placed randomly in the simulation box. Ion parameters were taken from Dang (Citation1992). Lipid parameters were as described previously (Berger et al. Citation1997). The whole system was simulated using the force field Amber ff99SB-ILDN (Lindorff-Larsen et al. Citation2010). Ligand parameters were calculated using the generalized amber force field (GAFF) (Wang et al. Citation2004). ESP partial charges were calculated using a HF/6-31G* basis set. Restrained electrostatic potential (RESP) fitting was performed using Antechamber (Wang et al. Citation2006). Long-range electrostatic interactions were calculated with the particle-mesh Ewald method (Darden et al. Citation1993, Essmann et al. Citation1995). Short-range interactions were described by Lennard-Jones potential, which was cut off at 1 nm. The pressure was kept constant by coupling to a semi-isotropic Parrinello-Rahman barostat (Parrinello and Rahman Citation1980, Citation1981, Berendsen et al. Citation1984) at 1 bar with a coupling constant of 5 ps. The Lincs algorithm (Hess et al. Citation1997) was used to constrain protein and lipid bond lengths and the Settle algorithm (Miyamoto and Kollman Citation1992) was used to constrain all other bond lengths, allowing a time step of 2 fs. The temperature was kept constant by coupling the system to a velocity rescaling thermostat (Berendsen et al. Citation1984, Bussi et al. Citation2007) at 300 K with a coupling constant of 0.01 ps. The solvent and lipid molecules in the simulation system were equilibrated for 10 ns before production. During this equilibration the atoms of the receptor were harmonically restrained with harmonic force constants of 1000 kJ/mol/nm2. Then the restraints were removed from the side chain atoms and the system was relaxed with a restrained backbone for additional 10 ns. The simulation length of the production runs was 100 ns for the equilibration trajectory without ligands and 30 ns for the trajectories with ligands. For the first set of simulations a random snapshot of an equilibrated MD simulation was taken as starting configuration of the receptor. One small molecule was docked to each receptor monomer using LeadIT. This was done separately for the extracellular site and the intracellular site, resulting in two sets of simulations with ligands either at the intracellular side or the extracellular side of the membrane. In the second set of simulations, the energy minimized homology model was taken as starting point. Therefore, all four monomers of the receptor were in an almost identical configuration.
Calculation of the single channel water permeability coefficients
The calculation of the single channel osmotic water permeability coefficients (pf ) was done according to the collective diffusion model described by Zhu et al. (Citation2004). The first 10 ns of the unrestrained simulations were removed for equilibration. The pf values were computed individually for each subunit from the slope of the mean-square displacement (MSD) of the collective water coordinates. The slope of the MSD was approximated by the slope of a linear fitted line between 20 ps and 200 ps displacement time. According to 90 ns simulation time used in this analysis, the fit was carried out 450 times. For the analysis, water molecules were used within a cylinder of length 1 nm and radius of 0.5 nm around the NPA motif. To exclude influence of the bulk, the z-position of the cylinder was adjusted to minimize the resulting pf values. The reported values are mean values of the four computed pf values from the individual subunits. The error bars correspond to the respective standard deviations.
Molecular docking
Target structures for individual molecular docking algorithms utilized in this study were selected and prepared as follows:
For Autodock-Vina (Trott and Olson Citation2010), here referred to as Vina; version 1.0.2, input files of the target sites were generated using the Autodock-Vina plugin (Seeliger and De Groot Citation2010) for the PyMOL Molecular Graphics System (Version 1.3 from Schrödinger LCC). A standard grid spacing of 0.375 Å was used. For Vina only atoms in a box of 21 × 21 × 28 Å around the intracellular pore entry were used as target site. In addition to the initial homology model, 43 alternative receptor configurations were targeted; 39 of these conformations were representatives of structural clusters from a free MD simulation. The clusters and the representative structures were obtained with the g_cluster algorithm implemented in Gromacs (Van Der Spoel et al. Citation2005, Hess et al. Citation2008). Four more structures were included from equilibrated MD simulations that contained reference ligands in the pore.
Molecular docking with LeadIT (Rarey et al. Citation1996) version 2.0 was done in the LeadIT standard configuration. All atoms within a sphere of 10 Å around the intracellular pore entrance of hAQP9 served as target site. The high-throughput screen was performed with the initial homology model of the hAQP9 wild type and the mutants H82A and M91N. In order to probe for alternative conformations a snapshot from an equilibrated MD simulation was targeted as well. Every single structure used for molecular docking was energy minimized in the force field Amber ff99SB-ILDN (Lindorff-Larsen et al. Citation2010), applying 250 steps of the steepest decent algorithm implemented in Gromacs (Van Der Spoel et al. Citation2005, Hess et al. Citation2008).
Preparation of the ligand structures
A structural screening database, containing 972,307 commercially available compounds, was kindly provided by Enamine (http://www.enamine.net/). The library contained compounds with masses between 200 and 500 Da with a mean value at 380 Da. The majority of compounds had zero or one chiral centers, but also compounds up to four chiral centers were covered. The calculated logarithmic water-octanol partition coefficients (LogP) followed a normal distribution with a mean value of 3 and a standard deviation of one. The mean value of the number of h-bond acceptors was 3.6 with a maximum of eight h-bond acceptors. The mean value of the number of h-bond donors was 1 and the maximum was three. The numbers of rotatable bonds per compound were between one and 13 with a mean value of 5.6. 3D structures were prepared and hydrogenated with Conrina 3.48 (Sadowski et al. Citation1994). For LeadIT the compounds were canonically protonated and collected in a single sd file. For Vina the protonation state was preassigned using the calculator plugins distributed with Marvin 5.6.0.1, 2011, ChemAxon (http://www.chemaxon.com). A reference pH value of 7.4 was used. For Autodock-Vina single pdbqt files were generated using the python script prepare_ligand4.py included in the MGL-tools (version 1.5.4).
Results
Homology model of human AQP9
We have recently described a homology model of human (h)AQP9 (Jelen et al. Citation2011). The crystal structure of the E. coli glycerol facilitator GlpF at 2.2 Å resolutions (DOI:10.1126/SCIENCE.290.5491.481) served as template to build this homology model. Ramachandran plots of both the template and the homology model are shown in the supporting information (Supplementary Figure S1, available online). Global quality scores from Verify3D and Prosall were lower than average for both the template and the model, as indicated by negative z-scores. The score obtained with MolProbity was above average for both the template and the homology model. The Procheck scores indicate a better stereochemical quality of the template structure (). A summary of the MolProbity analysis is given in . According to this analysis there are two Ramachandran outliers in between Arg53 and Phe54 (Supplementary Figure S1). This region is located in the channels first extracellular loop. This loop is not directly part of the inner water pore nor of the putative binding pocket.
Table I. Global quality scores (z-scores) for energy minimized monomers of the template and homology model calculated with different programs. The values were obtained by the Protein Structure Validation Software Suite (http://www.nesg.org).
Table II. Properties obtained from the Protein Structure Validation Suite (http://www.nesg.org) for the template (GlpF) and the homology model (hAQP9). Both structures were relaxed in the Amber ff99SB-ILDN force field. Here the absolute values instead of the z-scores () are given. A lower MolProbity score indicates a better model.
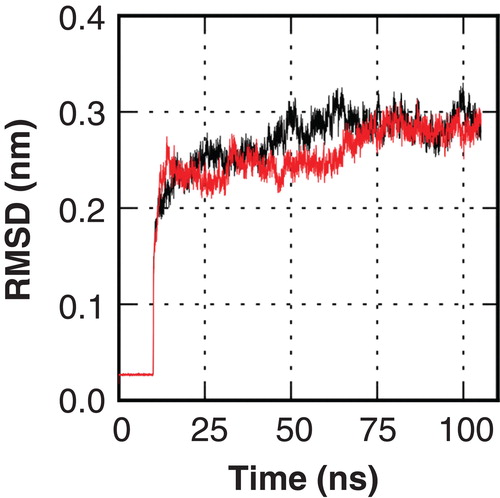
A visual inspection of the model reveals that the pore region of the homology model shows the typical composition of a hydrophobic surface with a ladder of polar residues acting as h-bond donors and acceptors for solvent molecules. A comparison of the pores is shown in . In order to assess the models structural stability and functionality it was subjected to two independent atomistic molecular dynamics (MD) simulations of 100 ns length under physiological temperature and pressure conditions as well as KCl concentrations. During the first 10 ns the protein atoms were position restrained, allowing both lipid and solvent molecules to equilibrate. Afterwards, the system was simulated without position restraints. During the unrestrained simulation, the root mean square deviation (RMSD) of the hAQP9 backbone with respect to the initial structure converged to a value of 0.3 nm in both simulations, indicating a structurally stable model in the simulated time window (). The most flexible parts were located in extracellular loops with average root mean square fluctuations (RMSF) of 4 and 2.5 Å, respectively. In contrast, the residues in the transmembrane regions have RMSFs of approximately 1 Å. In simulations, the solvent molecules in the pore region show a single file alignment with the dipole moments pointing towards the NPA restriction site () as observed in MD simulations with AQP1 (De Groot and Grubmuller Citation2001).
Figure 1. Homology model of human AQP9. The pore residues of the template (A) and the homology model (B). Configuration of the single water file permeating the pore taken from an equilibrated MD simulation after 50 ns of unrestrained relaxation (C). This Figure is reproduced in color in Molecular Membrane Biology online.
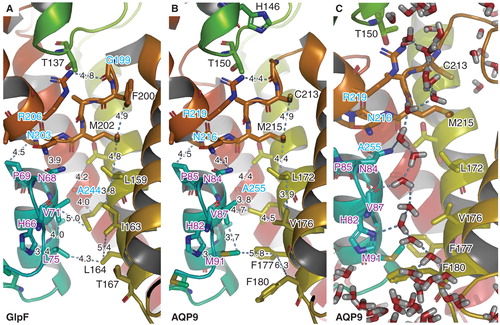
Figure 2. Root mean square deviation (RMSD) traces of two independent MD simulations of hAQP9 indicate structural stability of the model in the simulated time window. This Figure is reproduced in color in Molecular Membrane Biology online.
Molecular docking and single-molecule water permeability calculations
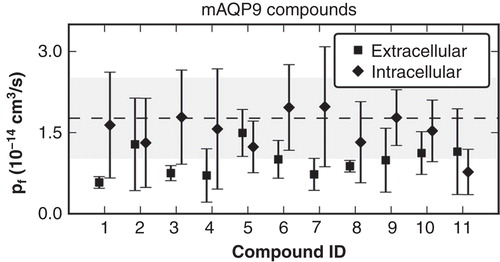
The mouse and human variants of AQP9 protein share a sequence identity of 75.6%. Furthermore, Aquaporins in general share a highly conserved fold. Therefore, we hypothesized in a recently described study (Jelen et al. Citation2011) that binding sites for some identified murine (m)AQP9 inhibitors might be shared by hAQP9. However, the scores obtained by docking to the hAQP9 model did not lead to a significant enrichment of mAQP9 inhibitors. In the current study we set out to use molecular dynamics simulations to locate a putative binding site for mAQP9 inhibitors. For this purpose, we calculated changes in water permeability due to the presence of inhibitors. Top ranked docking ligand configurations and orientations were used as starting points in MD simulations. We calculated single channel osmotic water permeability coefficients (pf ) to quantify inhibitory effects of the corresponding compounds. Each simulation was carried out with one ligand per AQP9 subunit, docked to either the extracellular or the intracellular pore vestibule. Simulations were computed under physiological temperature, pressure and ionic conditions. The protein was embedded in a dimyristoylphosphatidylcholine (DMPC) lipid bilayer. The pf values were calculated based on the mobility of the water molecules in the pore. We found that a minority of compounds led to a significant reduction of computed pf values ().
Figure 3. Computed pf values from molecular dynamics (MD) simulations with the hAQP9 homology model in complex with mAQP9 inhibitors. Compounds were ranked according to their inhibitory effect of mAQP9. The values represent the mean from four individual subunits of the tetramer and the error bars indicate the standard deviation. As a reference, the pf computed from two separate MD simulations without inhibitors is depicted with a dashed line (average) and a gray area (standard deviation). Compounds binding to the extracellular site suppressed water permeability more (average pf = 0.96 +/− 0.55 × 10⁻¹⁴ cm3/s) than binding to the intracellular site (average pf = 1.5 +/− 0.85 × 10⁻¹⁴ cm3/s). However, the computed pf values of the individual molecules did not correlate with measured activities on mAQP9 (data not shown).
To gain more information about putative binding sites, we decided to utilize the simulation trajectories to identify residues which are putatively involved in AQP9-inhibitor binding. For this purpose, we monitored contacts between individual amino acid residues and ligands every 50 ps of simulation time. Notably, this analysis revealed six extracellular and four intracellular residues which were significantly more frequented by the ligands than other residues (Supplementary Figure S2, available online). Based on these results we hypothesized that isoleucine 60, tyrosine 151 and leucine 209 might be involved in AQP9-inhibitor binding at the extracellular side of the channel. Alternatively, histidine 82, methionine 91 and phenylalanine 180 might contribute to an intracellular binding site. The residue numbers relate to the human AQP9 primary protein sequence.
Single point mutations and effects on water permeability
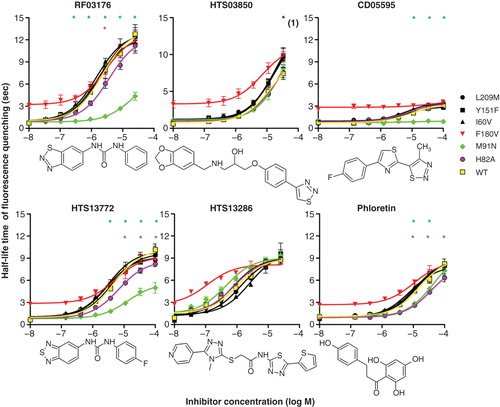
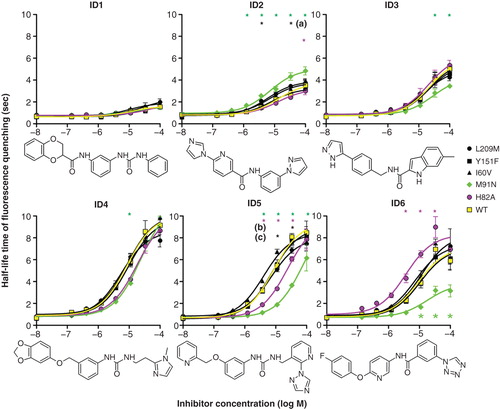
In order to distinguish between these two alternative sites we introduced conservative changes, based on homologous AQP sequences, into hAQP9 by site-directed mutagenesis. The changes made are summarized in . To provide better starting data for evaluating the model we expanded the list of hAQP9 inhibitors by testing a list of structural mAQP9 inhibitor analogues. The compounds that were selected for further analyses are provided in Supplementary spreadsheet 2 (available online). Three individual stable CHO cell lines were established for each construct subsequently. In a first set of experiments the functionality of these constructs in osmotic water permeability assays was determined. AQP9 expression was induced by various concentrations of tetracycline in all cell lines. These experiments indicated that five out of six hAQP9 mutant genes encoded fully functional proteins in this assay. Cell lines expressing hAQP9 F180V displayed reduced water permeability, compared to hAQP9 expressing cells, when expression was fully induced by tetracycline (Supplementary Figure S3, online). This suggested that hAQP9 F180V might be affected in single channel water permeability, protein stability or protein trafficking. We therefore excluded these cell lines from further statistical analyses. Subsequent to these control experiments, we established if any of the mutations alter inhibitor effects on AQP9 water permeability. Notably, we found that both intracellular-facing amino acid exchanges affected hAQP9 inhibition by some tested substances, while none of the extracellular-facing amino acid exchanges caused significantly altered inhibition of cell water permeability (). We therefore hypothesized that several identified AQP9 inhibitors, including phloretin, CD05595, RF03176 and HTS13772 likely interact with AQP9 in close proximity to histidine 82 and methionine 91. The latter two of these substances are similar in structure, based on Tanimoto chemical similarity index ().
Table III. Conservative amino acid changes introduced into hAQP9 by site-directed mutagenesis.
Figure 4. Effects of hAQP9 single amino acid exchanges on inhibitor potency in CHO-hAQP9 cell shrinking assays. Induction of hAQP9 was titrated with tetracycline to achieve similar baseline cell water permeabilities in all cell lines, except for CHO-hAQP9 F180V, where this was not possible. The lowest x-axis values in each dose-response curve are 0, and have been altered for presentation on a log-transformed graph. Phloretin, CD05595, RF03176 and HTS13772 effects were significantly altered by intracellular amino acid exchanges, while HTS13286 was not significantly affected by any mutation introduced into hAQP9. CHO-hAQP9 F180V was excluded from statistical analysis. Two-way ANOVA and Bonferroni post tests suggested significant differences at P < 0.001 (n = 5) as indicated by asterisks. Black asterisk (1) indicates significant effect of all three extracellular amino acid exchanges. Tanimoto compound similarity index compared to RF03176: HTS13772 (0.590308); CD05595 (0.231939); Phloretin (0.227891); HTS13286 (0.219626); HTS03850 (0.12743). This Figure is reproduced in color in Molecular Membrane Biology online.
Molecular docking at the intracellular pore entry
These results of hAQP9 mutant analyses indicated that the inhibitor binding site is located at the intracellular pore entrance of hAQP9. We therefore concentrated on the intracellular binding site for subsequent docking studies. To test if targeting this site leads to improved correlation between molecular docking scores and experimental data, we generated a test-library consisting of 11 true hAQP9 active compounds and 2397 decoys, randomly chosen from the Maybridge library. We generated multiple receptor configurations in order to account for receptor flexibility. This set of different receptor configurations included the homology model (see Methods). The test-library was docked with Vina to each of the receptor configurations. No enrichment of active ligands was observed as indicated by the receiver-operator-characteristic (ROC) curves ().
Figure 5. Benchmark results. ROC-curves for Vina using rankings according to multiple receptor configurations (A) and for LeadIT using two different conformations of the WT and single structures of the mutants H82A and M91N (B). The steps indicate the ranking of the 12 active compounds in the test library. The red dashed lines correspond to a perfectly ranked list of compounds where all active compounds have lower scores than inactive compounds and therefore are perfectly separated from inactives. Different receptor conformations lead to different scores and therefore to different rankings. The dark grey area around the black dashed line indicates where random distributions of compounds are expected. Ranking according to LeadIT led to a significant enrichment separation of active compounds. This Figure is reproduced in color in Molecular Membrane Biology online.
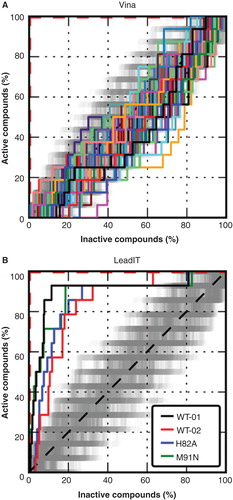
Next, we changed the molecular docking algorithm and used LeadIT. Only two different receptor configurations were used in this case. LeadIT immediately achieved significant enrichment for both of the receptor configurations. The molecular docking calculation was repeated with the mutants H82A and M91N and resulted in statistically similar enrichments of actives as with the wild-type (WT) receptor conformations. All 11 inhibitors and 2175 of the decoys successfully passed all four docking calculations and were taken into account for the evaluation of the enrichment. We evaluated the significance of enrichment compared to enrichment of randomly distributed active compounds. This analysis suggested significant enrichment of actives by LeadIT, as indicated by the obtained ROC-curves () and the Area under the curves (AUC), which was approximately 0.8 for all calculations (). The energy minimized homology model (WT1) showed the highest enrichment. Furthermore, we evaluated the significance at different percentages and found significant early enrichment at 3% for this structure (). We noticed that both wild-type receptor configurations were in an open configuration with respect to the side chains in vicinity of the pore entrance. This configuration allowed a placement of ligands deep into the pore region of the AQP9 monomer. We concluded that the LeadIT algorithm in combination with the hAQP9-WT model reproduced the experimental observations well and thus could be expected to correctly identify new hits in a high-throughput virtual screen for novel hAQP9 inhibitors.
Table IV. The area under the receiver-operator-characteristic (ROC)-curves (AUC) for the individual receptors using LeadIT.
Table V. Number of active compounds in the first percent of a ranked list (N) and the corresponding 95% quantiles of randomly distributed lists. For Vina only the maximal values are shown. For the wild-type values for both configurations the crystal structure (WT) and the MD-snapshot (WT-MD) are shown. Values larger than the 95-quantiles indicate significant enrichments.
Virtual screening and validation of active compounds
To evaluate whether the enrichment reflects the predictive power of the virtual screening approach, we used LeadIT and the model of the hAQP9 wild type to screen around 1 million compounds in silico. The 105 top ranked compounds of this screen were purchased and activities were measured in the cell based assay. In these experiments we found that 30 out of 105 tested substances conferred significantly reduced water permeability to CHO-hAQP9 cells, compared to solvent treatment (Supplementary spreadsheet 3, available online). Furthermore, we performed dose-response analyses for 18 apparent hAQP9 inhibitors and found that the most potent inhibitors affected CHO-hAQP9 cells at an apparent half-maximal (IC50) concentration of between 4 and 10 μM. In order to further validate the predictive AQP9-inhibitor interaction model we performed dose response analyses for the six best (by IC50) newly identified inhibitors on CHO cells expressing mutated hAQP9 isoforms. We found that five out of six substances were affected by at least one of the amino acid exchanges H82A or M91N (), suggesting inhibitor-hAQP9 binding near these amino acid residues.
Figure 6. Effects of hAQP9 single amino acid exchanges on CHO-hAQP9 cell water permeability. Induction of hAQP9 was titrated with tetracycline to achieve similar baseline cell water permeabilities in all cell lines. Intracellular amino acid exchanges resulted in enhanced or reduced inhibitor potency for five out of six tested substances, corresponding to the six substances with the lowest apparent IC50 (see Supplementary spreadsheet 2, available online). Of these, compound ID1 was a very moderate inhibitor of CHO-hAQP9 cell water permeability. Two-way ANOVA and Bonferroni post-tests suggested significant differences from hAQP9 at P < 0.001 (n = 3) as indicated by asterisks. Black asterisks refer to: (a) hAQP9 L209M and hAQP9 I60V, (b) hAQP9 L209M, (c) hAQP9 I60V. Tanimoto compound similarity index compared to ID2: ID1 (0.251773); ID3 (0.336303); ID4 (0.258467); ID5 (0.455446); ID6 (0.45182). This Figure is reproduced in color in Molecular Membrane Biology online.
We simulated the solvated homology model in the presence of each of these compounds for 50 ns including a two step equilibration phase of 20 ns as described in the Methods section. Each of these simulations contained four times the same ligand docked to the intracellular pore entries of the tetramer. During the two-step equilibration phase no position restraints were placed on the ligands, thus allowing the ligands to equilibrate within the pore. The stepwise reduction of position restraints increased conformational freedom of the ligands, leading to a spontaneous increase of the ligands' RMSDs with respect to the receptor structure in most cases. We used the last 20 ns to calculate the respective pf values. Notably, in all the cases where the compounds were present, the calculated pf values were significantly smaller than the reference value without compounds () as well as the pf values from the previously simulated set (), which were docked closer to the surface of the molecule. No crossing of water molecules was observed by visual inspection of the simulation trajectories. Compounds ID2 and ID5 demonstrated remarkable stability in the initial configuration with an RMSD of around 0.3 nm for all four individual molecules in the simulations. All other compounds showed spontaneous rearrangements of at least one of the four simulated molecules indicated by an increase of the RMSD of more than 0.4 nm. The largest rearrangements were observed for compound ID3 with RMSD values of 0.8 nm (Supplementary Figure S4, available online). In all cases at least two individual molecules spontaneously converged to similar end poses. We therefore consider these end poses as reasonable models of the intracellular bound state. Compound ID2 was docked very deep into the pore and trapped within the receptor structure. This compound contains a kink which makes a deep entering to the center of the channel unlikely. Therefore, we consider this pose as a docking artifact ().
Figure 7. Calculated pf values from MD simulations using ligand poses generated with molecular docking as initial configurations for the substances.
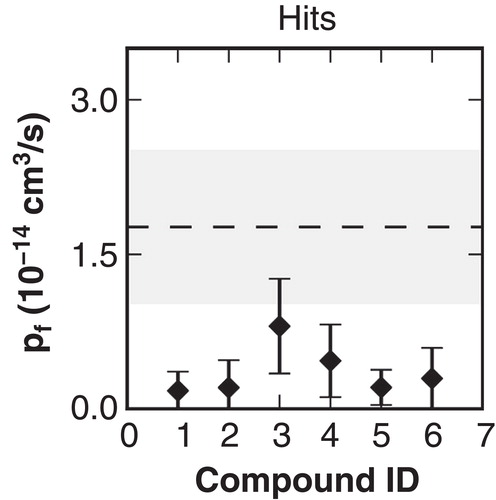
Figure 8. Final positions of the top six tested substances. (A) Substances bound to all four monomers at the intracellular side of the hAQP9 homology model. The carbon atoms of the four subunits are colored differently: (1: green, 2: cyan, 3: magenta, 4: light yellow). The coloring corresponds to the coloring of the RMSD traces in Supplementary Figure S4, available online). The remaining atoms are colored according to the conventional coloring scheme for chemical elements as used in Pymol. (B) Poses highlighted by frames in (A) in atomic detail. Polar and non-polar interaction sites between receptor (grey) and ligands (green) are represented by the dashed lines. This Figure is reproduced in color in Molecular Membrane Biology online.
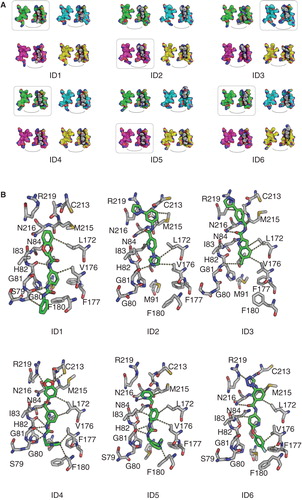
The predicted binding poses of the top six active compounds complement the chemical environment of the pore. Compounds ID1, 4 and 5 show attractive polar interactions with the backbone carboxyl groups of Gly80, Gly81 and His82. These compounds contain a urea motif, which in all cases virtually builds a network of polar interactions with the backbone carboxyl groups. All compounds show polar interactions with the NPA region. Except for compound ID1, all compounds span the NPA region and may interact with R219 of the ar/R region. In addition to these polar interactions, the compounds show numerous hydrophobic contacts mainly with Leu153, Val157, Pro193, Ile196, Ile200 and Phe180 ().
Discussion
In the current study, we have used a combination of experimental and computational methods to examine the intracellular inhibition of the human water- and glycerol channel hAQP9. The crystal structure of the glycerol facilitator GlpF from E. coli at 2.2 Å resolution (Fu et al. Citation2000) was considered the most suitable template for hAQP9 because it shows the highest sequence identity with hAQP9 of 35.7%. We validated the AQP9 homology model in terms of structure, stability, water permeation and quality scores. The conserved folding of major intrinsic proteins such as Aquaporins and the glycerol facilitator GlpF as well as the sufficiently high sequence identity of 35% allowed modeling of the human isoform of AQP9 using GlpF as a template. The combination of the ClustalW (Larkin et al. Citation2007) and the SWISS-MODEL homology model server (Arnold et al. Citation2006) has been shown to produce reliable models among various combinations of sequence alignment and modeling algorithms (Reddy et al. Citation2006). Evaluation of model-quality with various publicly available programs returned below average scores in all but one case. However, this was also the case for the template crystal structure. The low scores are probably caused by the transmembrane character of the structures. Compared to the template structure, the homology model yielded very similar scores indicating comparable quality. In unrestrained molecular dynamics simulations the model demonstrated structural stability in the simulated time window as well as functionality in terms of water permeation. Visual inspection of the water in the pore revealed a single file alignment of water molecules showing an alignment of the dipole momenta pointing towards the NPA region. This property is well known from MD simulations of the AQP1 water channel and therefore indicates that the model reflects a functional water channel. Therefore, the model meets important functional requirements for molecular docking calculations.
Nevertheless, initial efforts of using this model to identify novel AQP9 inhibitors by molecular docking were unsuccessful. Molecular docking is a suitable tool to identify receptor-ligand interactions. However, channel-inhibitors are characterized by two required but independent properties, channel-binding and channel-blocking. The latter cannot be scored by molecular docking. We therefore reasoned that molecular docking score calculations should be restricted to a site where ligands are likely to occlude the channel pore. Consequently, we used MD simulations to identify possible binding sites of true mAQP9 inhibitors to the receptor. An intracellular binding site identified by this approach was subsequently supported by intracellular point mutations introduced to hAQP9, which led to ligand efficacy changes in a cell-based assay.
Utilizing this confirmed binding site, we then evaluated two molecular docking algorithms in benchmark tests. Only one tested docking algorithm, LeadIT, was able to significantly enrich active compounds from a library of known active compounds and decoys. In contrast, Vina was not able to enrich active compounds in the same database. A comparison of the top scored poses suggested that hydrogen bond alignment may be one of the causes. Especially for compounds with a urea motif this was the most striking observed difference between the docking poses generated by the two programs. In the case of LeadIT almost every compound containing a urea motif was docked in the region close to His82, in contrast to Vina. MD simulations indicated that these compounds are highly attracted by this region.
The predictive power of the LeadIT approach was then examined by subjecting top-ranked compounds from a high-throughput virtual screen to cell-based assays. Based on the benchmark we expected an enrichment of active compounds by a factor between 4 and 8. In a recently described cell-based screen of a small molecule library we were able to identify 50–60 mAQP9 inhibitors within 1980 tested substances [39]. Accordingly, we expected 10–25 active compounds in a cell-based assay, within a set of 105 compounds that were top-ranked by the virtual screen, to support predictions of the enrichment-factor based on the benchmark experiment. Exceeding the expected predictive power, we identified 30 active compounds within the 105 compound test set, therefore validating this virtual screening approach. Further optimizations of the virtual screening protocol or adjustments of sampling and scoring procedure within the LeadIT software may further enhance the predictive power of this approach.
Nine of the 30 identified active compounds produced an apparent IC50 of less than 50 μM. The top six compounds (by IC50) were tested for their inhibition of the mutant isoforms of AQP9. We found that five out of these six compounds were affected by intracellular mutations. Furthermore, these six compounds have been used for a computational cross-validation: Unrestrained all atom MD simulations showed a significant suppression of the water flux (in terms of the pf values) carried by hAQP9 due to the presence of the ligands, demonstrating that the ligands replace the water molecules in the pore region. However, on the basis of the calculated pf values we could not assign the experimental efficacies. The experiments show that compounds 3–6 reduce the flux more than compounds 1–3. This was not reproduced by the simulations. The experimental value of the maximal effect on water permeability of compound ID1 is the smallest. This compound is also not significantly affected by the point mutations. This demonstrates that reduction of the pf-values in our MD simulations does not fully explain effective intracellular inhibition. Furthermore, it was not possible to significantly enrich active compounds just based on calculated pf values. We attribute this outcome to the short simulation times (multiple nanoseconds) in our analyses, which were chosen to relax the ligand-receptor system and thereby to reveal stable, more realistic interactions near the starting configurations, i.e., the docking poses. However, unbinding events usually take place at the micro- to milliseconds timescale. Therefore, the effect of inactive molecules on pf values is overestimated in the simulations we performed. We note however that MD simulations resulted in higher pf values when very small, mobile, inactive molecules, were placed at the intracellular inhibitor binding site. The changes in inhibitor efficacy caused by mutations H82A and M91N, respectively, for five out of six test substances corroborates the intracellular pore entrance as an interaction site. However, based on our findings additional interaction sites including extracellular interaction sites cannot be excluded.
The poses shown in illustrate end poses of free molecular dynamics simulations. For all compounds the poses in were independently generated by more than one molecule. Therefore, we consider these poses as realistic predictions of molecular interactions. The final binding modes of these ligands may require rearrangements of the receptor residues and therefore simulations with longer time scales may be required. However, we see that in most cases the binding modes are independently reproduced, thus suggesting a substantial driving force towards these states.
The maximum inhibition is highest for compounds ID4-6. These compounds are comparably large and linear and therefore match the shape of the hAQP9 pore. Furthermore, these compounds show numerous attractive interactions with the receptor distributed over their complete structure. The final binding modes of compounds ID4 and ID5 are almost identical. Further experimental observations are the changes in affinity and efficacy due to the point mutations. With the M91N mutant channel the efficacies of compounds ID3-6 decrease. All of these compounds contain a hydrophobic group which is aligned by Met91, Phe177 and Phe180 forming a small cavity. This cavity is less hydrophobic when M91 is replaced by an Asn residue. The presence of a polar interaction site (M91N) might therefore lead to a destabilization of the poses shown in . For the mutation H82A the efficacy of compound ID6 increases, for compounds ID4 and ID5 the efficacy decreases, whereas the efficacies of compounds ID1-ID3 are not affected. Interestingly, compound ID5 contains an aromatic ring group in the shape of a histidine side chain. When His82 is replaced by alanine a pocket is generated which could be filled by this group. However, the conclusions that we can draw from the complexes with the wild-type model are limited in this case because the H82A mutation generates a cavity which leads to a relatively large change of the receptor surface. The absence of the histidine side chain results in additional interaction sites and may lead to comparably large conformational rearrangements of the ligands in the pore.
Conclusions
Here, we describe a successful strategy for the identification of APQ9 small molecule inhibitors by in silico screening. This approach required prior experimental knowledge, including genuine AQP9 small molecule inhibitors and information regarding the molecular interaction site between AQP9 and these substances. The newly identified substances were structurally divergent from the originally identified substances (Jelen et al. Citation2011) and provide additional starting points for further inhibitor optimizations. Importantly, we identified point mutations at the intracellular pore entrance that affect significantly the inhibitor efficacies and affinities, indicating an intracellular binding site. This binding site may be relevant for the identification of inhibitors of other Aqua(glycero)porin channels. The identified inhibitors might be useful as tools for the study of the function of AQP9 in vitro. Analogues of the identified inhibitors with improved efficacy might be useful to control gluconeogenesis from glycerol in type-2 diabetes.
Supplementary spreadsheets 1–3.Supplementary Figures S1–4
Download MS Word (29 KB)Acknowledgements
This work was supported by Lundbeck Foundation Grant R17A1742, a Marie Curie Research Training Network grant (MRTN-CT-2006-035995), a Nordic Research Grant for Water Imbalance Related Disorders, and European Drug Initiative on Channels and Transporters Grant (EDICT) HEALTH-F4-2007-201924. The Water and Salt Research Center was established and funded by The Danish National Research Foundation.
Declaration of interest: The authors report no conflicts of interest. The authors alone are responsible for the content and writing of the paper.
Related Research Data
References
- Amiry-Moghaddam M, Otsuka T, Hurn PD, Traystman RJ, Haug FM, Froehner SC, 2003. An alpha-syntrophin-dependent pool of AQP4 in astroglial end-feet confers bidirectional water flow between blood and brain. Proc Natl Acad Sci USA 100:2106–2111.
- Amiry-Moghaddam M, Xue R, Haug FM, Neely JD, Bhardwaj A, Agre P, 2004. Alpha-syntrophin deletion removes the perivascular but not endothelial pool of aquaporin-4 at the blood-brain barrier and delays the development of brain edema in an experimental model of acute hyponatremia. FASEB J 18:542–544.
- Arnold K, Bordoli L, Kopp J, Schwede T. 2006. The SWISS-MODEL workspace: A web-based environment for protein structure homology modelling. Bioinformatics 22:195–201.
- Beitz E, Wu B, Holm LM, Schultz JE, Zeuthen T. 2006. Point mutations in the aromatic/arginine region in aquaporin 1 allow passage of urea, glycerol, ammonia, and protons. Proc Natl Acad Sci USA 103:269–274.
- Berendsen HJC, Grigera JR, Straatsma TP. 1987. The missing term in effective pair potentials. J Phys Chem 91:6269–6271.
- Berendsen HJC, Postma JPM, Van Gunsteren WF, Dinola A, Haak JR. 1984. Molecular dynamics with coupling to an external bath. J Chem Phys 81:3684.
- Berger O, Edholm O, Jähnig F. 1997. Molecular dynamics simulations of a fluid bilayer of dipalmitoylphosphatidylcholine at full hydration, constant pressure, and constant temperature. Biophys J 72:2002–2013.
- Brooks HL, Regan JW, Yool AJ. 2000. Inhibition of aquaporin-1 water permeability by tetraethylammonium: Involvement of the loop E pore region. Mol Pharmacol 57:1021–1026.
- Bussi G, Donadio D, Parrinello M. 2007. Canonical sampling through velocity rescaling. J Chem Phys 126:014101.
- Dang LX. 1992. Development of nonadditive intermolecular potentials using molecular dynamics: Solvation of Li+ and F- ions in polarizable water. J Chem Phys 96:6970–6977.
- Danielson JA, Johanson U. 2010. Phylogeny of major intrinsic proteins. Adv Exp Med Biol 679:19–31.
- Darden T, York D, Pedersen L. 1993. Particle mesh Ewald: An N*log (N) method for Ewald sums in large systems. J Chem Phys 98:10089.
- De Groot BL, Grubmuller H. 2001. Water permeation across biological membranes: Mechanism and dynamics of aquaporin-1 and GlpF. Science 294:2353–2357.
- Essmann U, Perera L, Berkowitz ML, Darden T, Lee H, Pedersen LG. 1995. A smooth particle mesh Ewald method. J Chem Phys 103:8577–8593.
- Fenton RA, Moeller HB, Nielsen S, De Groot BL, Rutzler M. 2010. A plate reader-based method for cell water permeability measurement. Am J Physiol Renal Physiol 298:F224–F230.
- Fu D, Libson A, Miercke LJ, Weitzman C, Nollert P, Krucinski J, 2000. Structure of a glycerol-conducting channel and the basis for its selectivity. Science 290:481–486.
- Gonen T, Sliz P, Kistler J, Cheng Y, Walz T. 2004. Aquaporin-0 membrane junctions reveal the structure of a closed water pore. Nature 429:193–197.
- Gorin MB, Yancey SB, Cline J, Revel JP, Horwitz J. 1984. The major intrinsic protein (MIP) of the bovine lens fiber membrane: Characterization and structure based on cDNA cloning. Cell 39:49–59.
- Guerrero FD, Jones JT, Mullet JE. 1990. Turgor-responsive gene transcription and RNA levels increase rapidly when pea shoots are wilted. Sequence and expression of three inducible genes. Plant Mol Biol 15:11–26.
- Hara-Chikuma M, Sugiyama Y, Kabashima K, Sohara E, Uchida S, Sasaki S, 2012. Involvement of aquaporin-7 in the cutaneous primary immune response through modulation of antigen uptake and migration in dendritic cells. FASEB J 26:211–218.
- Hess B, Bekker H, Berendsen HJC, Fraaije JGEM. 1997. LINCS: A linear constraint solver for molecular simulations. J Comput Chem 18:1463–1472.
- Hess B, Kutzner C, Van Der Spoel D, Lindahl E. 2008. GROMACS 4: Algorithms for highly efficient, load-balanced, and scalable molecular simulation. J Chem Theory Computat 4:435–447.
- Horsefield R, Norden K, Fellert M, Backmark A, Tornroth-Horsefield S, Terwisscha Van Scheltinga AC, 2008. High-resolution x-ray structure of human aquaporin 5. Proc Natl Acad Sci USA 105:13327–13332.
- Huber VJ. 2009. Support for small molecule inhibition of aquaporin 4. Bioorg Med Chem 17:425–426.
- Huber VJ, Tsujita M, Kwee IL, Nakada T. 2009a. Inhibition of aquaporin 4 by antiepileptic drugs. Bioorg Med Chem 17:418–424.
- Huber VJ, Tsujita M, Nakada T. 2012. Aquaporins in drug discovery and pharmacotherapy. Mol Aspects Med 33:691–703.
- Huber VJ, Tsujita M, Yamazaki M, Sakimura K, Nakada T. 2007. Identification of arylsulfonamides as Aquaporin 4 inhibitors. Bioorg Med Chem Lett 17:1270–1273.
- Ishibashi K, Hara S, Kondo S. 2009. Aquaporin water channels in mammals. Clin Exp Nephrol 13:107–117.
- Jelen S, Wacker S, Aponte-Santamaria C, Skott M, Rojek A, Johanson U, 2011. Aquaporin-9 protein is the primary route of hepatocyte glycerol uptake for glycerol gluconeogenesis in mice. J Biol Chem 286:44319–44325.
- Johnson KD, Hofte H, Chrispeels MJ. 1990. An intrinsic tonoplast protein of protein storage vacuoles in seeds is structurally related to a bacterial solute transporter (GIpF). Plant Cell 2:525–532.
- Klokkers J, Langehanenberg P, Kemper B, Kosmeier S, Von Bally G, Riethmuller C, 2009. Atrial natriuretic peptide and nitric oxide signaling antagonizes vasopressin-mediated water permeability in inner medullary collecting duct cells. Am J Physiol Renal Physiol 297:F693–F703.
- Larkin MA, Blackshields G, Brown NP, Chenna R, Mcgettigan PA, Mcwilliam H, 2007. Clustal W and Clustal X version 2.0. Bioinformatics 23:2947–2948.
- Lindorff-Larsen K, Piana S, Palmo K, Maragakis P, Klepeis JL, Dror RO, 2010. Improved side-chain torsion potentials for the Amber ff99SB protein force field. Proteins 78:1950–1958.
- Ma B, Xiang Y, Mu SM, Li T, Yu HM, Li XJ. 2004. Effects of acetazolamide and anordiol on osmotic water permeability in AQP1-cRNA injected Xenopus oocyte. Acta Pharmacol Sin 25:90–97.
- Manley GT, Fujimura M, Ma T, Noshita N, Filiz F, Bollen AW, 2000. Aquaporin-4 deletion in mice reduces brain edema after acute water intoxication and ischemic stroke. Nat Med 6:159–163.
- Marignier R, Giraudon P, Vukusic S, Confavreux C, Honnorat J. 2010. Anti-aquaporin-4 antibodies in Devic's neuromyelitis optica: Therapeutic implications. Ther Adv Neurol Disord 3:311–321.
- Migliati E, Meurice N, Dubois P, Fang JS, Somasekharan S, Beckett E, 2009. Inhibition of aquaporin-1 and aquaporin-4 water permeability by a derivative of the loop diuretic bumetanide acting at an internal pore-occluding binding site. Mol Pharmacol 76:105–112.
- Miyamoto S, Kollman PA. 1992. Settle: An analytical version of the SHAKE and RATTLE algorithm for rigid water models. J Comput Chem 13:952–962.
- Mola MG, Nicchia GP, Svelto M, Spray DC, Frigeri A. 2009. Automated cell-based assay for screening of aquaporin inhibitors. Anal Chem 81:8219–8229.
- Muramatsu S, Mizuno T. 1989. Nucleotide sequence of the region encompassing the glpKF operon and its upstream region containing a bent DNA sequence of Escherichia coli. Nucleic Acids Res 17:4378.
- Papadopoulos MC, Manley GT, Krishna S, Verkman AS. 2004. Aquaporin-4 facilitates reabsorption of excess fluid in vasogenic brain edema. FASEB J 18:1291–1293.
- Parrinello M, Rahman A. 1980. Crystal structure and pair potentials: A molecular-dynamics study. Phys Rev Lett 45:1196–1199.
- Parrinello M, Rahman A. 1981. Polymorphic transitions in single crystals: A new molecular dynamics method J Appl Phys. 52:7182–7191.
- Preston GM, Agre P. 1991. Isolation of the cDNA for erythrocyte integral membrane protein of 28 kilodaltons: Member of an ancient channel family. Proc Natl Acad Sci USA 88:11110–11114.
- Preston GM, Carroll TP, Guggino WB, Agre P. 1992. Appearance of water channels in Xenopus oocytes expressing red cell CHIP28 protein. Science 256:385–387.
- Rao Y, Jan LY, Jan YN. 1990. Similarity of the product of the Drosophila neurogenic gene big brain to transmembrane channel proteins. Nature 345:163–167.
- Rarey M, Kramer B, Lengauer T, Klebe G. 1996. A fast flexible docking method using an incremental construction algorithm. J Mol Biol 261:470–489.
- Reddy ChS, Vijayasarathy K, Srinivas E, Sastry GM, Sastry GN. 2006. Homology modeling of membrane proteins: A critical assessment. Comput Biol Chem 30:120–126.
- Rojek A, Praetorius J, Frokiaer J, Nielsen S, Fenton RA. 2008. A current view of the mammalian aquaglyceroporins. Annu Rev Physiol 70:301–327.
- Rojek AM, Skowronski MT, Fuchtbauer EM, Fuchtbauer AC, Fenton RA, Agre P, 2007. Defective glycerol metabolism in aquaporin 9 (AQP9) knockout mice. Proc Natl Acad Sci USA 104:3609–3614.
- Saadoun S, Papadopoulos MC, Hara-Chikuma M, Verkman AS. 2005. Impairment of angiogenesis and cell migration by targeted aquaporin-1 gene disruption. Nature 434:786–792.
- Sadowski J, Gasteiger J, Klebe G. 1994. Comparison of automatic three-dimensional model builders using 639 X-ray structures. J Chem Inf Comput Sci 34:1000–1008.
- Sandal NN, Marcker KA. 1988. Soybean nodulin 26 is homologous to the major intrinsic protein of the bovine lens fiber membrane. Nucleic Acids Res 16:9347.
- Seeliger D, De Groot BL. 2010. Ligand docking and binding site analysis with PyMOL and Autodock/Vina. J Comput Aided Mol Des 24:417–422.
- Sogaard R, Zeuthen T. 2008. Test of blockers of AQP1 water permeability by a high-resolution method: No effects of tetraethylammonium ions or acetazolamide. Pflugers Arch 456:285–292.
- Trott O, Olson AJ. 2010. AutoDock Vina: Improving the speed and accuracy of docking with a new scoring function, efficient optimization, and multithreading. J Comput Chem 31:455–461.
- Vajda Z, Pedersen M, Fuchtbauer EM, Wertz K, Stodkilde-Jorgensen H, Sulyok E, 2002. Delayed onset of brain edema and mislocalization of aquaporin-4 in dystrophin-null transgenic mice. Proc Natl Acad Sci USA 99:13131–13136.
- Walz T, Fujiyoshi Y, Engel A. 2009. The AQP structure and functional implications. Handb Exp Pharmacol 31–56.
- Van Der Spoel D, Lindahl E, Hess B, Groenhof G, Mark AE, Berendsen HJC. 2005. GROMACS: Fast, flexible, and free. J Comput Chem 26:1701.
- Wang J, Wang W, Kollman PA, Case DA. 2006. Automatic atom type and bond type perception in molecular mechanical calculations. J Mol Graph Model 25:247–260.
- Wang J, Wolf RM, Caldwell JW, Kollman PA, Case DA. 2004. Development and testing of a general amber force field. J Comput Chem 25:1157–1174.
- Yamamoto YT, Cheng CL, Conkling MA. 1990. Root-specific genes from tobacco and Arabidopsis homologous to an evolutionarily conserved gene family of membrane channel proteins. Nucleic Acids Res 18:7449.
- Yang B, Kim JK, Verkman AS. 2006. Comparative efficacy of HgCl2 with candidate aquaporin-1 inhibitors DMSO, gold, TEA+ and acetazolamide. FEBS Lett 580:6679–6684.
- Yang B, Zhang H, Verkman AS. 2008. Lack of aquaporin-4 water transport inhibition by antiepileptics and arylsulfonamides. Bioorg Med Chem 16:7489–7493.
- Zhu F, Tajkhorshid E, Schulten K. 2004. Collective diffusion model for water permeation through microscopic channels. Phys Rev Lett 93:224501.