
Abstract
Anion exchanger 1 (AE1) is a 95 kDa glycoprotein that facilitates exchange across the erythrocyte plasma membrane. This transport activity resides in the 52 kDa C-terminal membrane domain (Gly361-Val911) predicted to span the membrane 14 times. To explore the role of tryptophan (Trp) residues in AE1 function, the seven endogenous Trp residues in the membrane domain were mutated individually to alanine (Ala) and phenylalanine (Phe). Expression levels, cell surface abundance, inhibitor binding and transport activities of the mutants were measured upon expression in HEK-293 cells. The seven Trp residues divided into three classes according the impact of mutations on the functional expression of AE1: Class 1, dramatically decreased expression (Trp492 and Trp496); Class 2, decreased expression by Ala substitution but not Phe (Trp648, Trp662 and Trp723); and Class 3, normal expression (Trp831 and Trp848). The results indicate that Trp residues play differential roles in AE1 expression and function depending on their location in the protein and that Trp mutants with low expression are misfolded and retained in the endoplasmic reticulum.
Introduction
Human erythrocyte AE1 (AE1, Band 3, SLC4A1) is a 95 kDa glycoprotein, comprised of two structural and functional domains (Reithmeier et al., 1996). The 43 kDa N-terminal cytosolic domain (Met1-Lys360) has a globular dimeric structure (Shnitsar et al., Citation2013; Zhang et al., Citation2000), providing interaction sites for cytoskeletal and cytosolic proteins in the erythrocyte (Low, Citation1986). Kidney AE1 (kAE1) is a truncated version of AE1 missing the first 65 amino acid residues that results in a cytosolic domain (Brosius et al., Citation1989) with a different folded structure from the erythroid version due to loss of a central β-strand (Pang et al., Citation2008). The 52 kDa C-terminal membrane domain (Gly361-Val911) is the functional unit with transporter activity (Grinstein et al., Citation1978; Shnitsar et al., Citation2013). This domain spans the membrane ∼14 times and contains a single N-linked glycosylation site (-Asn-X-Ser/Thr-) at Asn642 in the fourth extracellular loop (Drickamer, Citation1978). The N-linked oligosaccharide is not required for the functional expression of AE1 (Groves & Tanner, Citation1994). Yet, this type of oligosaccharide is present in a majority of multi-spanning membrane proteins and participates in the folding, trafficking, and stabilization of membrane proteins (Landolt-Marticorena & Reithmeier, Citation1994). In the case of kAE1, the N-linked oligosaccharide is responsible for the retention of misfolded mutant forms of the protein in the endoplasmic reticulum (ER) via a lectin interaction with the ER chaperone calnexin (Patterson & Reithmeier, Citation2010; Popov & Reithmeier, Citation1999).
Surveys of membrane proteins indicate that the ends of TM segments located in the ∼12 Å thick polar headgroup region of the lipid bilayer are enriched in aromatic amino acid residues, most notably tryptophan (Landolt-Marticorena et al., Citation1993; Reithmeier, Citation1995). The amphipathic nature of the Trp side chain may allow this residue to donate hydrogen bonds to ester carbonyls of phospholipids to stabilize membrane proteins with the Trp residues positioned at the lipid-water interface (Braun & von Heijne, Citation1999).
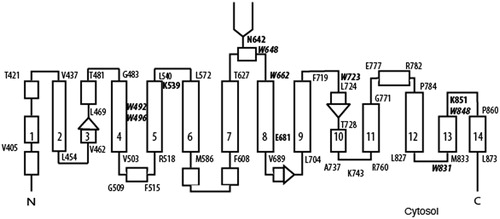
The membrane domain of AE1 (mdAE1) has seven endogenous Trp residues that are well-conserved across species and in the family of human anion exchanger proteins, which includes AE2 and AE3. Threading experiments have shown that AE1 has a similar fold to the bacterial UraA uracil transporter (Lu et al., Citation2011) that consists of 14 transmembrane (TM) segments arranged into two inverted repeats each with 7 TM segments (Barneaud-Rocca et al., Citation2013; Cordat & Reithmeier, 2014). The predicted 14 TM folding model () suggests that Trp492 and Trp496 are located within TM4, Trp648 is located in a hydrophilic loop just distal to the N-glycosylation site at Asn642, Trp662 is an interfacial residue located at the beginning of TM8, Trp723 is at the beginning of TM10, and Trp831 and Trp848 are positioned near the beginning and end of TM13, respectively. Energy transfer experiments (Lieberman & Reithmeier, Citation1983; Rao et al., Citation1979) found that Trp residues are close to the external stilbene disulfonate inhibitor-binding site in AE1.
Figure 1. Folding model of the membrane domain of human AE1 with 14 TM segments based on the crystal structure of the related Escherichia coli UraA H+-uracil transporter (Cordat & Reithmeier, Citation2014). Rectangles represent helical regions and residue numbers indicate limits of TM segments. TM3 and 10 each contain an extended region indicated by an arrow and a short helical region. The single N-glycosylation site is located at Asn642 between TM7 and 8, and the active site Glu681 within TM8. The H2DIDS reactive site is located at Lys539 at the end of TM5 and its crosslinking site at Lys851 in the extracellular loop connecting TM 13 and 14. The positions of the seven tryptophan residues (W) are indicated in bold italics. Trp492 and Trp496 are located on the same side of the helix forming TM4. Trp648 is located in an extracellular hydrophilic loop six residues distal from the N-glycosylation site. Trp662 is an interfacial residue located at the beginning of TM8, while Trp723 is located at the beginning of TM10. Trp831 is in a cytosolic loop near the beginning of TM13, while Trp848 is an interfacial residue at the extracellular end of TM13.
In this study, we mutated the seven endogenous Trp residues located in the membrane domain of AE1 individually to phenylalanine and alanine. We identified Trp residues involving in folding, trafficking, and the transport function of human AE1 by transient expression of the 14 Trp mutants in HEK-293 cells. Total expression levels in cell extracts were measured by immunoblottting. Cell surface abundance and localization were examined by immuno-fluorescence staining and biotinylation assays. Inhibitor binding and transport function were investigated, using SITS inhibitor affinity gel binding and anion transport assays, respectively. The N-glycosylation pattern of Trp mutants created in mdAE1, which is efficiently processed to complex oligosaccharide in HEK cells, was used to assess their proper folding and exit from the ER and trafficking to the Golgi and beyond to the plasma membrane. Based on the results, Trp mutants could be grouped into three classes, depending on the effect of the mutations on the functional expresssion of AE1: Class 1, dramatically decreased expression (Trp492 and Trp496); Class 2, decreased expression by Ala substitution but not Phe (Trp648, Trp662 and Trp723); and Class 3, normal expression (Trp831 and Trp848).
Methods
Materials
The following is a list of materials used and their suppliers: pcDNA3 vector, DH5α competent cells, Lipofectamine™ 2000 (Invitrogen, San Diego, CA); Quickchange™ Site-directed Mutagenesis Kit, XL1 blue competent cells (Agilent Technologies, La Jolla, CA); DNA primers (ACGT Corp., Toronto, Canada); QIAGEN Plasmid Mini Kit, QIAGEN Plasmid Midi Kit, Ni-NTA Agarose (Qiagen Inc, Mississauga, Ontario, Canada); Dulbecco’s modified Eagle medium (DMEM), fetal bovine serum, penicillin and streptomycin (Gibco BRL, Burlington, ON, Canada); chemiluminescence kit (Boehringer Mannheim, Laval, QC, Canada); EZ-Link™ sulfo-succinimidyl 2-(biotin-amido)ethyl-1,2-dithiopropionate (NHS-SS-biotin), ImmunoPure® immobilized streptavidin (Pierce Biotechnology, Inc., Rockford, IL); SITS-Affi-Gel was prepared as described previously (Pimplikar & Reithmeier, Citation1986); C-terminal AE1 mouse monoclonal antibody was generous gift from Dr Michael Jennings. Mouse anti-GAPDH antibody (Chemicon International Inc., Temecula, CA); Cy3-conjugated anti-rabbit IgG antibody (Jackson Immunoresearch Laboratories, West Grove, PA); Alexa 488-conjugated anti-mouse IgG antibody (Molecular Probes, Eugene, OR). Extracellular AE1 mouse monoclonal antibody, BRIC 6, was purchased from the International Blood Group Reference Laboratory, University of Bristol, UK. Octa(ethylene glycol) dodecyl ether (C12E8; Nikkol Chemical Co, Tokyo, Japan); goat peroxidase-conjugated anti-rabbit IgG, endoglycosidase-H, N-glycanase F (New England BioLab).
Site-directed mutagenesis
The coding sequence of human erythrocyte AE1 cDNA (a gift from Drs A.M. Garcia and H. Lodish, Whitehead Institute) was inserted into the XhoI (mutated from initial HindIII sites) and BamHI sites of the pcDNA3 vector (Popov et al., Citation1999). The membrane domain (md)AE1 contains the sequence of erythrocyte AE1 encoding amino acids Asp369-Val911 with methionine start site was constructed using PCR, followed by subcloning into pcDNA3 (Bustos & Reithmeier, Citation2011). The C-termini of AE1 and mdAE1 in pcDNA3 were tagged with hexahistidine (His6) by PCR to facilitate purification of poorly expressed proteins. AE1 with extracellular hemagglutinin (HA)-tag was constructed by PCR inserting the HA epitope into position 557 in the 3rd extracellular loop. The oligonucleotide primers designed to mutate seven tryptophan residues in AE1 to Ala and Phe residues were purchased from ACGT Corp (Toronto, Canada). Tryptophan mutants in full length AE1 and in the membrane domain with a C-terminal His-tag in expression vector pcDNA3 were constructed using Quikchange Site-directed Mutagenesis Kit (Strategene). Plasmids were transformed into DH5α or XL 1 Blue competent cells, and purified with QIAGEN (Valencia) plasmid purification kit. The constructs were sequenced by ACGT Corp (Toronto, Canada) to confirm the mutations.
Transient transfection and expression in HEK-293 cells
WT and mutant AE1 were transiently expressed in human embryonic kidney HEK-293 cells as described previously (Popov et al., Citation1999), using 1 μg plasmid DNA and 2.5 μl of Lipofectamine™ 2000 (Invitrogen) (Sells et al., Citation1995). The cells (0.7 × 10⁶ cells/well) were cultured in six-well plates (Falcon, USA) with 10% (v/v) fetal bovine serum (FBS) supplemented Dulbecco’s Modified Eagle Medium (DMEM; Gibco Life Technologies, USA) at 37 °C in 5% CO2 for 24–48 h and then harvested by scraping. Whole cell detergent extracts were prepared, using 1% C12E8 in PBS solution (150 mM NaCl, 5 mM sodium phosphate, pH 8.0) containing protease inhibitors (1 mM PMSF, 0.1% Leupeptin, 0.1% Pepstatin A, and 0.2% Aprotinin). Samples were centrifuged to remove insoluble material at 14 000 g for 30 min, and 2 × SDS sample buffer was added at room temperature. Samples (50 μg of total protein per lane) were loaded on SDS-PAGE, and the proteins were detected by immunoblotting.
Electrophoresis and immunoblotting
Samples were resolved in 8% acrylamide gels (Laemmli, Citation1970) and transferred to nitrocellulose (Towbin et al., Citation1979). AE1 and GAPDH were detected using anti-mouse monoclonal antibodies (anti-AE1, 1:2000 and anti-GAPDH, 1:20 000 dilution, respectively). The membranes were blotted with 5% (w/v) skim milk powder and antibodies in TBS-T (137 mM NaCl, 20 mM Tris, pH 7.5 with 0.1% Tween-20) buffer. Blots were further incubated with HRP-conjugated goat anti-mouse IgG (1:5000 dilution) in TBS-T. Blots were developed with chemiluminescence reagent (Perkin Elmer) by exposing to BioMax MR imaging film (Kodak) for various times. Relative protein expression levels were determined by densitometric analysis of blots using ImageJ 1.42 software (National Institutes of Health). Total AE1 expression was quantified by calculating the densities of bands using ImageJ, normalized to GAPDH for protein loading. The mean values and ±standard deviation (SD) was calculated from three independent transfection experiments.
Immunofluorescence and confocal microscopy
The cell surface expression and intracellular localization of AE1 were detected, using imunofluorescence and confocal microscopy. HEK-293 cells were cultured on poly-l-lysine-coated coverslips in six-well plates. Transiently transfected cells were fixed with 3.7% paraformaldehyde for 10 min. The cells were blocked with 3% bovine serum albumin (BSA) and incubated with 1:500 diluted mouse monoclonal antibody, BRIC 6, which detects an extracellular epitope on AE1, in PBS for 30 min at room temperature, followed by goat anti-mouse Alexa488 (1:1000 dilution) (Molecular Probes, Eugene, OR). The fixed cells were washed with PBS buffer, containing 1 mM CaCl2 and 1 mM MgCl2, and then permeabilized in 0.1% Triton X-100, blocking with 3% BSA, and incubated with BRIC 6 and rabbit anti-calnexin (CNX) (1:1000 dilution). The cells were further incubated with 1:1000 dilutions of Cy3-conjugated anti-mouse IgG and donkey anti-rabbit Cy5 (Jackson ImmunoResearch). The cloverslips were mounted with Dako Cytomation fluorescent mounting media before being observed using a laser scanning confocal Zeiss LSM 510 microscope.
Cell surface biotinylation
Cells grown on six-well plates were washed with borate buffer (10 mM boric acid, 154 mM NaCl, 7.2 mM KCl, 1.8 mM CaCl2, pH9.0). The extracellular surface of cells was biotinylated twice with 1 ml of 0.5 mg/ml NHS-SS-biotin (Pierce) freshy prepared in borate buffer in six-well cell culture plates for 15 min at the room temperature. The reagent was quenching by rinsing the cells with 0.192 M glycine. The total cell lysates were extracted using RIPA buffer (1% deoxycholic acid, 1% Triton X-100, 0.1% SDS, 0.15 M NaCl, 1 mM EDTA, 10 mM Tris-HCl, pH7.5) with protease inhibitors (1 mM PMSF, 0.1% Leupeptin, 0.1% Pepstatin A, and 0.2% Aprotinin). Mock-treatment was performed on control cells transfected with WT AE1with C-terminal His-tag using the same conditions in borate buffer but without the biotinylation reagent. A fraction of the lysate was used for immunoblots for total expression (T). Biotinylated proteins were captured with ImmunoPure (Pierce) streptavidin-agarose beads (100 μl) incubated for 2 h at 4 °C. An aliquot of unbound supernatant (U) was saved for immunoblots. The bound fraction (B) was eluted with 2 × SDS sample buffer containing 5% β-mercaptoethanol, incubated for 1 h at room temperature to reduce disulfide bonds. The yield of protein in the bound fraction released from the beads was low and 5× the amount of protein relative to the T and U fractions were applied to the SDS gels. Fractions were analyzed with 8% SDS-PAGE and followed by immunoblotting with the mouse anti-AE1 monoclonal antibody. A mouse monoclonal anti-GAPDH was used for detecting intracellular GAPDH to confirm that biotinylation occured only at the cell surface. The level of biotinylation was estimated as total (T) minus unbound (U)/T × 100%. The mean values and ±SD was calculated from three independent experiments.
Inhibitor (SITS) binding
The ability of AE1 mutants to bind to a SITS inhibitor affinity resin (SITS-Affi-Gel) was measured as described previously (Pimplikar & Reithmeier, Citation1986). Cells grown on six-well plates were transfected with AE1 and the Trp mutants. Cell extracts were lysed in 1% C12E8 PBS solution, containing protease inhibitors (1 mM PMSF, 0.1% Leupeptin, 0.1% Pepstatin A, and 0.2% Aprotinin) and centrifugated at 14 000 g for 30 min to remove insoluble material. Cell extracts were divided into three fractions for total AE1 expression (T), SITS binding (B), and non-specific binding blocked by 1 mM DIDS (D). A 50% slurry of SITS-beads was prepared in 228 mM sodium citrate buffer (pH 7.1). Lysates (100 μl) were incubated with 100 μl SITS-Affi-Gel with or without 1 mM 4,4′-diisothiocyanostilbene-2,2′-disulfonic acid (H2DIDS) in 228 mM sodium citrate buffer (pH 7.1) and incubated for 30 min at 4 °C. The unbound fraction was removed, and beads were washed with 228 mM sodium citrate buffer. The bound proteins on the SITS-Affi-Gel beads were eluted with 75 μl 2 × sample buffer. Samples were analyzed by 8% SDS-PAGE and immunoblotting. Intensities of bands were quantified by densitometric analysis using ImageJ 1.42q software. As final elutants were twice concentrated relative to total AE1 expression in blots, percent binding was calculated by the following equation:
The mean values and ±SD of percent SITS-binding was calculated from three independent experiments.
Transport assay
Chloride and bicarbonate exchanged activity was tested as previously described (Fujinaga et al., Citation1999). Cells were grown on 7 × 11 mm glass coverslips in 60 mm tissue culture dishes at 37 °C in 5% CO2 and transfected with 1.6 μg of calcium-precipitated DNA with 4.2 μg of empty vector carrier. Forty-eight hours post-transfection, coverslips were rinsed with serum-free DMEM and incubated with 4 ml DMEM and pH-sensitive dye, BCECF-AM (2 μM), for 20–30 min at 37 °C. Coverslips were mounted in a fluorescence cuvette with perfusion capabilities. Intracellular pH was measured by monitoring fluorescence at excitation wavelengths (440 and 502 nm) and emission wavelength (529 nm) in a Photon Technologies International RPC spectrofluorometer. Cuvettes were alternatively perfused at 3.5 ml/min with Ringer’s buffer (5 mM glucose, 5 mM potassium gluconate, 1 mM MgSO4, 2.5 mM NaH2SO4, 25 mM NaHCO3, 10 mM Hepes, pH7.4), containing 140 mM sodium chloride buffer, followed by chloride-free Ringer’s buffer (Ringer’s buffer with 140 mM NaCl replaced by 140 mM sodium gluconate). Both buffers were bubbled with air containing 5% carbon dioxide. Intracellular pH was calibrated using the nigericin-potassium method (Thomas et al., Citation1979), by pH values from pH 6.5–7.5. Transport rates were determined by linear regression of initial linear rate of change of pH.
Protein purification
C-terminally His-tagged AE1, kAE1, and mdAE1were purified from transiently transfected HEK-293 cells, using nickel (Ni)-affinity chromatography. To clearly visualize N-glycosylation pattern of mdAE1 and Trp mutants, Ni-NTA purification was performed to enrich the protein concentration. Cells grown on six-well plates were transfected with WT mdAE1 and its Trp mutants with C-terminal His-tags. Transfected cells were grown for 48 h and then harvested using 0.5 ml of PBS buffer, containing 1% C12E8, 300 mM NaCl, and 10 mM imidazole with protease inhibitors (1 mM PMSF, 0.1% Leupeptin, 0.1% Pepstatin A, and 0.2% Aprotinin). Cell lysates were centrifugated at 14 000 g for 30 min at 4 °C to remove insoluble material. Cell extracts (500 μl) were incubated with 50 μl of 50% slurry of Ni-NTA-agarose in binding buffer (1% C12E8, 300 mM NaCl, and 10 mM imidazole and the protease inhibitors in PBS) for 2 h at 4 °C. The unbound fraction was removed and the beads were washed with 1 ml of washing buffer (0.1% C12E8, 300 mM NaCl, and 30 mM imidazole and the protease inhibitors in PBS). Bound fraction was eluted with elution buffer (0.1% C12E8, 300 mM NaCl, and 500 mM imidazole in PBS). Samples were solubilized with an equal volume of 2 × SDS sample buffer, and each fraction was analyzed by 8% SDS-PAGE and immunoblotted as described above. Bands intensities were measured using ImageJ 1.42q software. The percent complex bands were determined as described above. The mean values ±SD were calculated from three independent experiments.
N-glycosylation analysis
Cells grown on six-well plates were transfected with AE1, kAE1, and mdAE1 and incubated for 48 h. Cells were solubilized in 1% C12E8 PBS solution, containing protease inhibitors (1 mM PMSF, 0.1% Leupeptin, 0.1% Pepstatin A, and 0.2% Aprotinin) followed by centrifugation at 14 000 g for 30 min at 4 °C. Total cell-extracts (100 μl) were treated with 1000 units of endoglycosidase-H (endo-H) or 500 units of N-glycanase F (PNGase F) at 37 °C for 1 h. Samples were analyzed by 8% SDS-PAGE and immunoblotting as described above. Bands intensities were measured using ImageJ 1.42q software. Percent complex oligosaccharide form was quantified from endoglycosidase H treated samples by dividing intensities of upper multiple bands by the intensity of all bands in the lane. The endoglycosidase H treated samples were used to identify the high mannose component and to better resolve the complex bands from the high mannose band. The mean values and ±SD was calculated from three independent experiments.
Results
WT-AE1 and Trp mutants were expressed in HEK-293 cells to determine the effect of mutations of Trp residues on the expression and trafficking of AE1. The seven endogenous Trp residues (492, 496, 648, 662, 723, 831, and 848) located in the membrane domain of AE1 were individually mutated to Ala and Phe in a full-length AE1 construct. Unless stated otherwise, a C-terminal His-tag was included to facilitate protein purification in some experiments. Cells grown on six-well plates were transfected in parallel with identical amounts of DNA in multiple transfection experiments (Quilty & Reithmeier, Citation2000).
On immunoblots of total-cell extracts from cells transfected with AE1 and the 14 Trp (Ala and Phe) mutants, WT and mutant AE1 were detected as single bands of approximately 95 kDa (). Previous results (Li et al., Citation2000) showed this band contains high-mannose oligosaccharide, although AE1 can traffic to the cell surface in HEK-293 cells. No AE1 reactive band was observed in cells transfected with empty vector, pcDNA3 (, lane 1), showing the specificity of the mouse monoclonal anti-AE1 antibody. The same blots were reprobed with anti-GAPDH antibody to account for difference in protein loading. As can be seen from these blots, the expression levels of the W648F, W723F, W831A/F, and W848A/F were similar to AE1, while the expression levels of the other mutants were much diminished.
Figure 2. Immunoblot analysis of C-terminal His6-tagged AE1 and Trp mutants expressed in transfected HEK-293 cells. Cells were grown in six-well plates transfected with 1 μg cDNA per well and were solubilized in 1% C12E8 after 48 hours growth. Total cell proteins were resolved by SDS-PAGE and transferred to a nitrocellulose membrane. A mouse monoclonal anti-AE1 antibody was used to detect AE1 (upper panel) and a mouse monoclonal anti-GAPDH antibody was used to detect endogenous GAPDH (lower panel) as a protein loading control. Panel A shows the expression levels of the Ala substitutions and Panel B shows the Phe substitutions. Panel C show protein expression of the Trp mutants normalized to GAPDH expression (dark bar: Ala substitutions, light gray bar: Phe substitutions) from three independent transfection experiments. The percent expression level of WT AE1 was set to 100%. The error bars show the standard deviation (SD) with n = 3. Mutants W648F, W723F, W831A/F and W848A/F had Wt expression levels (p > 0.01), while all other mutants had lower expression levels (p < 0.005).
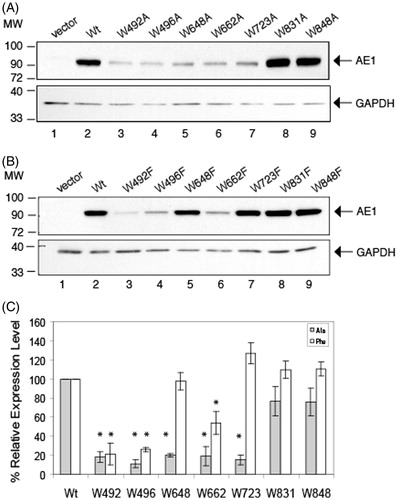
Expression levels of the Trp mutants relative to the WT-AE1 were normalized to GAPDH in three separate transfection experiments (). Ala substitutions at positions 492, 496, 648, 662, and 723 and Phe substitutions at 492, 496 led to reduced steady-state protein accumulation, with some reduction for the mutant at position 662. No significant reduction of expression was observed with Ala or Phe substitutions at positions 831 and 848, and Phe substitutions at positions 648 and 723. Thus, mutations of Trp residues 831 or 848 had little effect on AE1 expression, while mutation of residues 492 or 496 reduced expression. Interestingly, mutations of residues 648 or 723 to Phe had little effect on expression, while mutations to the smaller amino acid, Ala, decreased expression.
Cell surface expression of Trp mutants
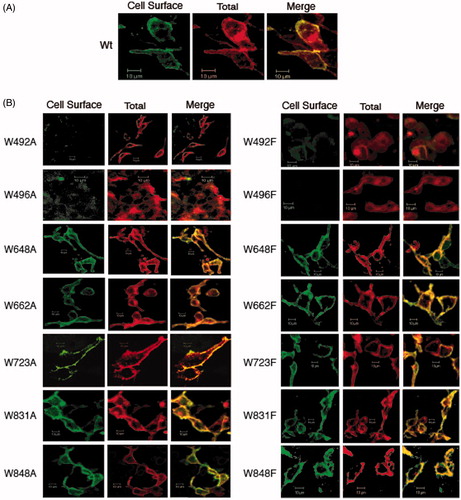
The localization of AE1 and Trp mutants in HEK-293 cells was assessed by immunofluorescence and confocal microscopy. Previous studies have shown that AE1 expressed in HEK-293 cells trafficked to the cell surface with about ⅓ of the protein at the plasma membrane and the remainder in the ER (Gomez & Morgans, Citation1993; Li et al., Citation2000). Cells cultured on cover slips were transfected in parallel with identical amounts of DNA. Intact cells were stained with a mouse monoclonal antibody, BRIC 6, which detects an extracellular epitope on AE1 followed by Alexa488-conjugated anti-mouse secondary antibody (, green), indicating cell surface expression of AE1. These cells were then washed, detergent-permeabilized and incubated with the antibody, BRIC 6, to show total AE1 expression followed by Cy3-conjugated anti-mouse secondary antibody (, red). These images were merged to show AE1 cell surface distribution in yellow, intracellular AE1 in red. Fields of cells showing in the strongest intensity were selected to compensate for low expression of some mutants and were viewed by confocal microscopy at the same settings. Confocal images were taken through the centre of the cells to reveal intracellular localization of AE1 in the ER after permeabilization, which also revealed the presence of the nucleus.
Figure 3. Immunolocalization of C-terminal His6-tagged AE1 and tryptophan mutants expressed in HEK cells. Intact cells expressing Wt (A) and tryptophan mutants (B, left: Ala substitution, right: Phe substitution) of AE1 were stained by a mouse monoclonal antibody (BRIC6), which detects an extracellular epitope on AE1. The cell surface expression was visualized as green by secondary Alexa 488 conjugated goat anti-mouse IgG in non-permeabilized cells (column 1). Total AE1 expression was visualized as red by secondary Cy3-conjugated goat anti-mouse IgG after cells were fixed and permeabilized (column 2). AE1 at the cell surface is displayed in yellow by merging the cell surface and total expression of AE1 (column 3). The mutants W648F, W662F, W723F, W831A/F and W848A/F showed detectable cell surface expression as indicated by yellow in the merged images, while the other mutants did not show cell surface expression. Wt AE1 and all the mutants showed intracellular localization (red). (In the black and white version of this figure, the yellow colour is seen as bright.)
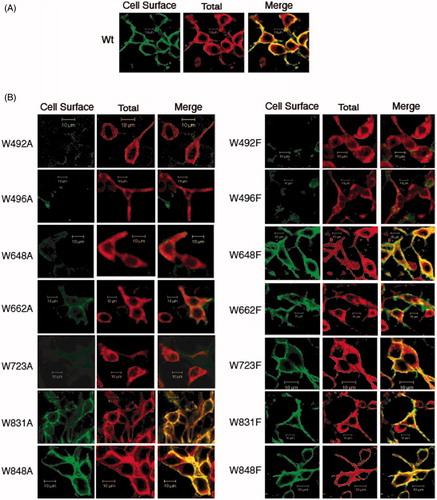
WT AE1 is expressed at the plasma membrane (yellow) but is also localized intracellularly (red) () in transfected HEK-293 cells as in previous studies (Gomez & Morgans, Citation1993; Li et al., Citation2000). Not all Trp mutants are expressed to a high level on the cell surface (). All cells, however, showed an intracellular pool of AE1, indicating the all mutants were expressed. Trp mutants W648F, W662F, W723F, W831A/F and W848A/F were localized at the plasma membrane as shown by the yellow staining, while Trp mutants, W492A/F and W496A/F were not detected at the cell surface. W648A, W662A, and W723A were poorly expressed at the cell surface. The wild-type AE1 had a Pearson’s coefficient of 0.72. The W831A, W831F, W831A and W831F had similar coefficients of 0.82, 0.70, 0.75 and 0.71 consistent with strong cell surface expression. In contrast the W492A, W492F, W496A, W496F mutants had coefficients less than 0.1. W648A had a coefficient of 0.15, while W648F had a coefficient of 0.70 and W662A had a coefficient of 0.12, while W662F had a coefficient of 0.36. The results indicate that mutations of Trp residues 831 or 848 to Phe or Ala had little effect on AE1 expression at the cell surface, while mutation of residues 492 or 496 diminished cell surface expression. Mutations of residues 648, 662, and 723 to Phe had little effect, while mutations to the smaller amino acid, Ala, decreased AE1 expression at the cell surface. Thus, the Trp mutants that were poorly expressed also failed to traffic to the cell surface suggesting that they are misfolded and retained in the ER.
Cell surface biotinylation experiments were conducted to quantify the amount of cell surface expression of the Trp mutants. C-terminal His-tagged AE1 and Trp mutants were expressed in HEK-293 cells in parallel with identical amounts of DNA in multiple separate transfection experiments. Cells were biotinylated with NHS-SS-biotin in 6-well cell culture plates, and total-cell lysates were prepared using RIPA buffer. Cells expressing AE1 were mock-treated in the same conditions in borate buffer without the biotinylation reagent. Biotinylated proteins were captured with streptavidin-agarose beads and AE1 eluted from the beads with SDS sample buffer was detected by immunoblotting.
Total-cell extract (lane T), the unbiotinylated fraction (lane U), and the biotinylated streptavidin bead bound fraction (lane B) of WT-AE1 and Trp mutants expressed in HEK-293 cells were resolved on immunoblots (). The level of biotinylation of a cytosolic protein, GAPDH was used to assess if there was any entry of the reagent into the cells. The mock-treated control cells showed that only biotinylated AE1 was able to bind to streptavidin beads (), and that the biotinylated protein binding to streptavidin bead was specific (). The biotinylation conditions caused AE1 to aggregate and run as a monomer with a molecular mass of ∼100 kDa (open circle), dimer with a molecular mass of ∼200 kDa and higher oligomer forms near the top of the gel (closed circle), even in the absence of biotinylation reagent. This aggregation effect of AE1 expressed in HEK-293 cells was seen in previous biotinylation experiments (Li et al., Citation2000; Quilty & Reithmeier, Citation2000) and is likely due to the incubation of the cells in the absence of media at room temperature in the alkaline (pH 9.0) biotinylation buffer.
Figure 4. Cell surface biotinylation of C-terminal His6-tagged AE1 and tryptophan mutants expressed in HEK cells. Cells cultured in six-well plates were transfected with 1 μg cDNA per well and the cells were biotinylated with 0.5 mg/ml NHS-SS-biotin reagent in borate buffer for 30 min. Whole-cell lysates solubilized in RIPA buffer were incubated with streptavidin-agarose beads to capture biotinylated proteins. Total AE1 (lane T), unbound to streptavidin beads (lane U), and bound AE1 at five times concentrated the amount loaded relative to total AE1 (lane B) were detected by immunoblotting using a mouse monoclonal anti-AE1 antibody. Endogenous GAPDH was detected using a mouse monoclonal anti-GAPDH to confirm that biotinylation only occurred at the cell surface. Control (A) represents AE1-expressing cells mock-treated without biotinylation reagent, while Wt represents cells treated with biotinylation reagent. Monomeric (open circle) and oligomeric forms (closed circle) of AE1 are indicated (A, B). Panel (C) shows percent cell surface biotinylation of Wt AE1 and Trp mutants (dark bar: Ala substitutions) light gray bar: Phe substitutions) in three independent transfection experiments. Monomeric and higher oligomeric bands were indicated in the quantification. The error bars show the standard deviation (SD) with n = 3. The W648F, W662F, W723F, W831A/F and W848A/F mutants showed biotinylation levels similar to Wt AE1 (p > 0.05), while the other mutants have lower biotinylation levels (p < 0.05).
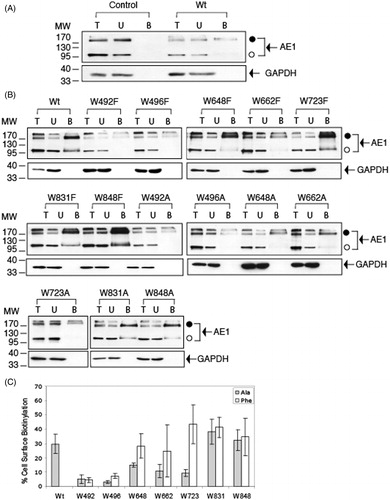
Cell surface biotinylation of AE1 and Trp mutants () results in a monomer (open circle), dimer and higher oligomer (closed circle) forms in immunoblots. None of samples showed GAPDH in bound fraction (lane B), showing biotinylation was restricted to the cell surface. W648F, W662F, W831A/F and W848A/F, were biotinylated in high levels, clearly showing a monomer form and dimeric and higher oligomeric forms. Poorly biotinylated AE1 mutants contained little or no biotinylated monomer and decreased amounts of biotinylated higher molecular weight oligomers.
As summarized in ), AE1 was biotinylated to a level of approximate 30%, which was similar to previous experiments (Li et al., Citation2000; Quilty & Reithmeier, Citation2000). Biotinylation was estimated from the difference in biotinylated protein bands (monomer and higher oligomers) in the total (T) minus unbound (U) fraction/T × 100%. The recovery of biotinylated protein eluted from the resin in the bound (B) fraction was poor and 5× the amount of sample relative to the total and unbound fraction was loaded on the gels. Trp mutants W648F, W662F, W723F, W831A/F and W848A/F, were comparable to AE1, with higher than 25% biotinylation. Both Ala and Phe substitutions at positions 492 and 496 showed little cell surface biotinylation. Ala substitutions at 648, 662, and 723 showed approximate half reduction of biotinylation relative to WT, showing reduced cell surface expression. The biotinylation results were consistent with cell surface expression detected using immunofluorescence and confocal microscopy.
Inhibitor binding of Trp mutants
The effect of Trp mutations on the ability of AE1 to bind an immobilized inhibitor (SITS) was determined as some of the mutations may cause AE1 to misfold and be incapable of binding inhibitors. SITS and DIDS are stilbene disulfonate inhibitors of anion transport and bind to an external site on AE1 (Cabantchik & Rothstein, Citation1972; Lieberman & Reithmeier, Citation1983). AE1 solubilized in detergent binds immobilized SITS and this binding can be competed by other stilbene disulfonates, such as DIDS (Pimplikar & Reithmeier, Citation1986). The ability to bind to SITS resin was revealed on immunoblots (). WT-AE1 bound SITS-Affi-Gel, which was effectively blocked by 1 mM H2DIDS, a competitive inhibitor of SITS binding (). Mis-folded AE1 is not expected to retain a native inhibitor-binding site and would not bind to the SITS-Affi-Gel nor be competed by DIDS.
Figure 5. SITS-AffiGel binding of C-terminal His6-tagged AE1 and tryptophan mutants expressed in HEK cells. Cells grown in six-well plates were transfected with 1 μg cDNA per well and were solubilized in 1% C12E8 after 48 hours growth. The total cell lysates (T) were incubated with SITS-AffiGel resin in the absence (B) or presence (D) of 1 mM H2DIDS, a competitive inhibitor of SITS binding. After removing the extract and washing the beads, the bound proteins on the SITS-Affi-Gel beads were eluted with SDS sample buffer. Immuno-blot analysis on the eluants was performed using a mouse monoclonal anti-AE1 antibody. Vector (A) is a control transfection with empty vector pcDNA3. The position of molecular weight markers are shown on the left. Panel (C) shows the percent SITS-Affi-Gel binding 100% × (B-D)/T of Wt AE1 and the Trp mutants (dark bar: Ala substitutions, light gray bar: Phe substitutions) in three independent transfection experiments. The error bars show the standard deviation (SD) with n = 3. The mutants W648F, W662F and W723F, W831A/F and W848A/F showed SITS binding levels similar to Wt AE1 (p > 0.05), while the other mutants showed diminished binding (p < 0.05).
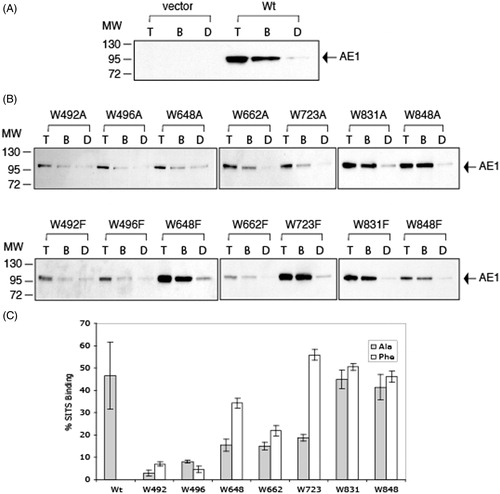
WT-AE1 () and the well-expressed Trp mutants, W648F, W723F, W831A/F and W848A/F (), bound well to SITS-Affi-Gel (lane B) with small amount of non-specific binding detected (lane D). W492A/F, W496A/F and W648A showed reduced binding, with the approximately same amount bound in the absence (B) and presence (D) of DIDS, indicative of a non-specific interaction. Mutants W662A/F and W723F showed an intermediate level of SITS binding.
Quantification of these data revealed that approximately 50% of WT-AE1 bound SITS-Affi-Gel under the conditions employed. Trp mutations, W723F, W831A/F and W848A/F bound to the SITS resin equally well to WT-AE1, while W492A/F and W496A/F resulted in less than 10% binding (). Trp mutations at positions 648 and 662 resulted in about 15% binding for Ala substitutions and 35% and 25% reduction respectively for Phe substitutions. The results indicated that Trp mutants W648F, W723F, W831F/A and W848F/A had similar binding behaviour to AE1 (p > 0.05), suggesting they may have a native conformation. The W492A/F, W496A/F mutants had severely impaired SITS-binding (p < 0.05) and may possess a misfolded conformation. Mutants W648F and W662F had intermediate levels of binding, with the alanine substitutions having a lower binding. Mutation of Trp723 to Phe had no impact on SITS binding, while mutation to Ala diminished binding. This differential effect of Phe and Ala substitution at Trp723 was also noted in expression levels and cell surface levels.
Transport activity of Trp mutants
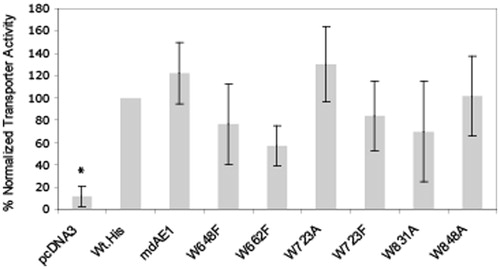
The rates of intracellular pH change in cells expressing WT-AE1 and Trp mutants upon removal and replacement of extracellular chloride, were used as a measure of AE1 functional activity (). Cuvettes were alternatively perfused with Ringer’s buffer containing sodium chloride, followed by chloride-free Ringer’s buffer. Removal of extracellular chloride creates an outward-facing gradient that allows extracellular bicarbonate exchange for intracellular chloride, in cells expressing a functional exchanger. This results in alkalinization of the cytosol, which is measured, using the pH-sensitive dye (BCECF). Cells transfected with pcDNA3 vector were used as a negative control. This assay assesses the function only of protein at the cell surface, so we assayed Phe substitutions of Trp648 and Trp662 since their Ala substitutions were poorly expressed and poorly processed to the cell surface. Ala and Phe substitution at Trp723 were both tested to compare the effects of the two different mutations where the Ala substitution had a moderate effect on expression while the Phe mutant showed normal expression levels. We chose Ala substitutions of Trp831 and Trp848 as these mutations had normal expression levels like the Phe mutations, yet with a more profound change in the size of the amino acid. Mutants W492A/F and W496A/F were not tested due to their low expression levels and poor cell surface abundance, precluding meaningful transport assays. The transport assays show that all selected mutants had functional activity above control cells transfected with empty vector comparable to WTAE1. Transport rates are normalized relative to total expression levels but are also dependent upon the level of cell surface expression. Thus, a decrease in cell surface expression would result in a concomitant decrease in transport activity.
Figure 6. Anion transport assays of C-terminal His6-tagged AE1 and tryptophan mutants expressed in HEK cells. Cells grown on cover slips in 60 mm tissue culture dishes were transfected with 1.6 μg cDNA per dish and incubated for 48 hours. The pH-sensitive dye BCECF-AM was loaded into cells and intracellular pH was measured by fluorescence at excitation wavelengths 440 and 502 nm and emission wavelength at 529 nm. The Figure shows the rate of intracellular pH change per sec for an average of three separate transfections. pcDNA vectors and Wt AE1 were used as negative and positive controls, respectively. The transport activities of the tested Trp mutants were all above vector controls and were not significantly different from the Wt-His tagged construct. The transport activity of mdAE1 was also tested and was found to retain functional activity.
Expression and trafficking of AE1, kAE1, and mdAE1
AE1, kAE1, and mdAE1 were expressed independently in HEK-293 cells with identical amounts of DNA in multiple separate transfection experiments. Immunoblots of the total-cell extracts compared the expression and N-glycosylation patterns of AE1, kAE1, and mdAE1 (). WT-AE1 migrates as a single band at approximately 95 kDa (lane 1) as noted above, while kAE1 in (90 kDa) and mdAE1 (55 kDa) showed a lower molecular weight band and multiple higher bands. The oligosaccharide content of these bands was distinguished by treating detergent lysates with glycosidase enzymes (H: endo-H, and F: PNGaseF). The faster migration after Endo-H treatments, indicates the presence of N-linked high mannose oligosaccharide (Popov et al., Citation1999). Disappearance of endo-H insensitive multiple bands after PNGaseF treatment, which cleavage all N-linked glycans, demonstrated the presence of complex oligosaccharides (Popov et al., Citation1999).
Figure 7. Immunoblot showing N-glycosylation analysis of AE1, kAE1 and mdAE1 expressed in transfected HEK cells. AE1 (lanes 1–3), kAE1 (lanes 3–6), mdAE1 (lanes 7–7 and 7′–9′). The panel on the right is a longer exposure of mdAE1. Detergent solubilized cell extracts were subjected to glycosidase digestion (C; control, H: endoglycosidase H, F: PNGase F). Immunoblot analysis was performed as described in . The positions of molecular weight markers are shown on the left. AE1 ran as a single predominant band, kAE1 ran as a major lower band with higher molecular weight bands and mdAE1 ran as a lower band and a series of higher molecular weight bands. In all cases the lower band (o) contained high mannose oligosaccharide that was sensitive to endoglycosidase H to produce a non-glycosylated band (x), while the upper bands contained complex oligosaccharides that were resistant to endoglycosidase H but could be removed by PNGaseF (indicated by the brackets).
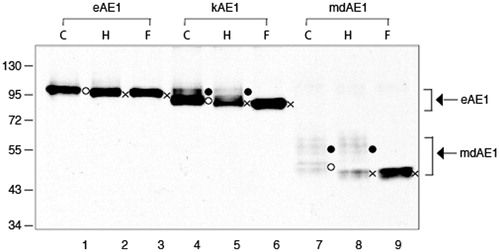
The composition of oligosaccharide on AE1 variants was quantified by the ratios of upper bands (complex carbohydrate) to that of total bands after endo-H treatment (). The fraction of protein with complex oligosaccharide increased significantly in the order of AE1, kAE1, and mAE1 (), with WT-AE1 containing little complex oligosaccharide, kAE1 containing about 30%, and mdAE1 greater than 50%. The tags (extracellular HA, C-teminal His, and combination of the extracellular HA and the C-teminal His) had little effect on the processing of AE1, kAE1, and mdAE1. The higher level of processing of kAE1 and mdAE1 suggests that EC loop 4 is more accessible to the processing enzymes than in AE1. Changes in the cytosolic domain must be transmitted across the membrane, although the mechanism is not clear.
Table 1. Percent complex oligosaccharide in erythrocyte anion exchanger 1 (AE1), kidney anion exchanger 1 (kAE1) and membrane domain of anion exchanger 1 (mdAE1) containing different tags expressed in HEK-293 cell.
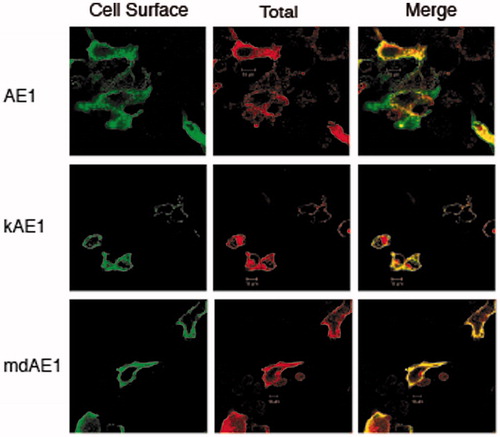
Immunofluorescence staining revealed that all three AE1 glycoforms can traffic to the cell surface (). AE1 had a Pearson’s coefficient of 0.76, kAE1 0.82 and mdAE1 0.90. Although WT-AE1 was found predominantly with high-mannose oligosaccharide, the protein is capable of trafficking to the plasma membrane, but escapes oligosaccharide processing (Li et al., Citation2000). The complex forms of kAE1 and mdAE1 represent proteins that had trafficked to the Golgi and most likely are present at the plasma membrane. Thus, the oligosaccharide processing of the mdAE1 mutants provides a convenient assay for level of exit of the protein from the ER.
Figure 8. Immunolocalization of AE1, kAE1 and mdAE1 in transfected HEK cells was performed described in . Cell surface expression of AE1, kAE1 and mdAE1 in intact cells was visualized as green, total expression in permeabilized cells was visualized as red and the overlap in yellow. All proteins could be detected at the cell surface (yellow) as well as intracellularly (red). (In the black and white version of this figure, the yellow colour is seen as bright.)
Oligosaccharide processing of Trp mutants of mdAE1
To analyze N-glycosylation process of the AE1 Trp mutants, Ala and Phe substitutions of Trp residues (492, 496, 648, 662, 723, 831, and 848) in mdAE1 with a C-terminal His-tag were constructed. MdAE1 and Trp mutants were expressed in HEK-293 cells grown on six-well plates transfected in parallel with identical amounts of DNA in multiple separate transfection experiments. Immunoblots of total-cell lysates of mdAE1 and Trp mutants reveal mdAE1migrates as a sharp lower band at approximate molecular mass at 55 kDa and a series of upper bands (). Enzymatic deglycosyaltion experiments (not shown) indicated that the lower band corresponds to high-mannose form while the upper bands corresponds to complex oligosaccharide forms. Non-specific bands were observed (arrow) between molecular mass of 72 and 55 kDa and seen in vector-transfected cells (, lane 1). Blots were reprobed with anti-GAPDH antibody in order to account for difference in protein loading. Expression levels of the W723F, W831A/F and W848A/F in mdAE1 were similar to WT mdAE1, while the expression levels of the other mutants were diminished. Expression levels were consistent with expression of Trp mutants in full-length AE1, except W648F whose expression level was comparable to WT in AE1 but is reduced in mdAE1. The difference in expression level of mdAE1 and Trp mutants was statistically significant in multiple independent (n = 3) transfection experiments.
Figure 9. Immunoblot analysis of N-glycosylation processing of C-terminal His6-tagged mdAE1 and tryptophan mutants expressed in transfected HEK cells. Immunoblot analysis was performed as described in . The positions of molecular markers are shown on the left. Arrows at the left between molecular weight of 72 000 and 55 000 in (A, B) denote a non-specific band that also appears in the vector control. Wild-type mdAE1 ran as a lower molecular weight band and a series of higher molecular weight bands as did W723F, W831A/F and W848A/F. The other mutants were expressed at diminished levels and ran as a lower band. (C) Immunoblot analysis of N-glycosylation processing of C-terminal His6-tagged membrane domain (mdAE1) after purification by Ni-affinity chromatography. Note the absence of the non-specific band. Wild-type mdAE1 ran as a lower molecular weight high-mannose band and a series of higher molecular weight complex bands as did W723F, W831A/F and W848A/F. Mutants W648A/F and W662F showed a major lower band with small amounts of upper bands while the other mutants only showed the lower band. Panel (D) shows the percent complex oligosaccharide of the Trp mutants (dark bar: Ala substitutions, light gray bar; Phe substitutions) determined by scan of the immunoblots of His6-tagged proteins purified by Ni-affinity chromatography in three independent transfection experiments. The error bars show the standard deviation (SD) with n = 3. W723F, W648F, W662F, W831A/F and W848A/F were comparable to Wt mdAE1 (p > 0.01).
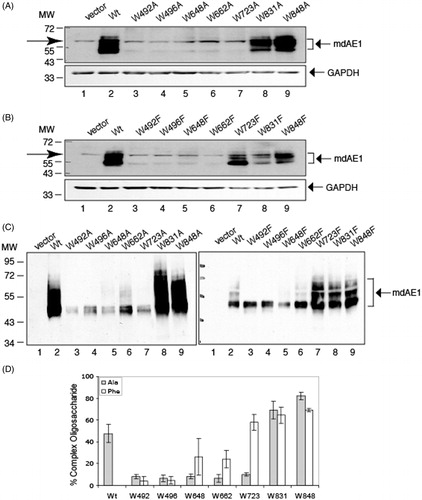
Low expression levels of Trp mutants in mdAE1, W492A/F, W496A/F, W648A/F, W662A/F, and W723A meant that their N-glycosylation status could not be assessed (). Ni-affinity purification was performed to concentrate the proteins and remove the background, providing a clearer picture of the glycosylation pattern (). Not all Trp mutants in mdAE1 contain complex oligosaccharide. Complex oligosaccharide forms are present in Trp mutants in mdAE1: W723F, W831A/F and W848A/F, similar to WT-AE1; the other mutants bear only the high mannose form (W492A/F, W496A/W), or very low amounts of complex oligosaccharide (W648A/F, W662A/F, W723A). We noted that after Ni-affinity purification, the lower band could often be resolved into two closely-spaced bands. The lowest band may represent mdAE1 that was not glycosylated.
Complex oligosaccharide was quantified from immunoblots after purification on Ni resin to eliminate non-specific bands (). Trp mutants in mdAE1, W723F, W831F/A and W848F/A contain high levels of complex oligosaccharide, comparable to WT-AE1. MdAE1 mutants W492A/F and W496A/F contained little complex oligosaccharide. Percent complex oligosaccharides were approximate half of WT mdAE1 in the Phe mutations of residues 648 and 662, showing differential effect of Phe and Ala substitutions, although not as profound as Trp723. The results indicate that Trp mutants in mdAE1, W723F, W831F/A and W848F/A were effectively processed to complex oligosaccharide forms, while the other mutations had a negative effect on the processing of mdAE1 into complex oligosaccharide forms, consistent with misfolding and impaired exit from the ER.
Cell surface expression of mdAE1
Localization of mdAE1 and Trp mutants in transfected HEK-293 cells was assessed by immunofluorescence and confocal microscopy (). The mdAE1 was expressed at the cell surface (, green) with intracellular localization (red). Yellow in the merged image provides cell surface distribution of AE1. All Trp mutants in mdAE1 could be detected at the cell surface, except substitutions at residues 492 and 496 (), which had Pearson’s coefficients of co-localization with WGA below 0.1 compared to 0.76 for mdAE1. All other mutants in mdAE1 had Pearson’s coefficients (0.73–0.90) similar to mdAE1. All cells also showed intracellular localization of md AE1 mutants, consistent with some ER localization. The results indicated that amongst all mdAE1 mutants, only mutation of Trp 492 and 496 profoundly influenced trafficking to the cell surface. Results were consistent with cell surface expression of full length AE1 shown by immunofluorescence and confocal microscopy except Ala substitutions at 648 and 662. W648A and W662A were less affected in cell surface expression in mdAE1 compared to AE1. MdAE1 can traffic more efficiently to the cell surface than full-length AE1 and this is reflected in some of the Trp mutants. Thus, removal of the cytosolic domain from AE1 to form mdAE1 allows oligosaccharide processing and facilitates cell surface expression.
Figure 10. Immunolocalization of C-terminal His6-tagged mdAE1 (A) and tryptophan mutants (B) expressed in HEK cells was performed as described in . Cell surface expression of mdAE1 in intact cells was visualized as green, total mdAE1 expression in permeabilized cells was visualized as red, and the overlap representing cell surface mdAE1 was visualized in yellow. The mdAE1 mutants W648A/F, W662A/F, W723A/F, W831A/F and W848A/F all showed cell surface expression, while W492A/F and W496A/F did. Wt mdAE1 and all mutants also showed intracellular localization. (In the black and white version of this figure, the yellow colour is seen as bright.)
Discussion
In this study, we mutated all seven Trp residues individually into Ala and Phe to investigate the roles of Trp residues in AE1 functional expression in transfected HEK-293 cells. Total protein expression levels, cell surface abundance, inhibitor binding, and anion transport activities were measured. His-tagged constructs were used to allow the purification and analysis of the mutants, including poorly expressed constructs. Our investigation showed that the Trp residues can be sorted into three classes on the basis of total expression, immuno-localization, cell surface biotinylation, inhibitor (SITS) binding, and oligosaccharide processing (summarized in ). These classes are: Class 1 had expression reduced by mutation of Trp to either Ala and Phe; Class 2 mutants had expression decreased by Ala substitution and slightly or not influenced by Phe substitution; Class 3 mutants had normal expression that was not affected by mutation of Trp to either Ala and Phe. Class 1 Trp residues are essential in protein folding during biosynthesis as mutation of these residues leads to ER retention of AE1 and poor expression. These mutants are likely misfolded and subject to rapid protein degradation by ER-associated degradation (ERAD). Class 2 Trp may have a structural role facilitated by aromatic amino acid residues since substitution with Phe had little effect on protein expression, while substitution with the small residue, Ala leads to reduced expression, again likely due to protein misfolding and degradation. Class 3 Trp may be exposed to an aqueous environment and not be involved in critical protein interactions.
Table 2. Summary of AE1 and mdAE1 tryptophan mutageneis studies in transfected HEK-293 cells*.
Class 1: Trp492 and Trp496
Class 1 residues, Trp492 and Trp496, are essential for proper folding and function of AE1. Mutation to either Ala or Phe had a profound effect on protein expression and trafficking. During biosynthesis, mutations of these residues likely lead to misfolding and, as a consequence, ER retention and lack of cell surface expression. The observations that both Ala and Phe substitutions impacted on AE1 expression suggest that Trp492 and Trp496 may be engaged in a crucial role in TM interactions and folding, and that the indole ring may be required in these interactions. Topology and helical models proposed that Trp492 and Trp496 are located at the same side of TM 4 (Reithmeier et al., 1996). As shown in a model of AE1 based on the UraA crystal structure (Barneaud-Rocca et al., Citation2013; Cordat & Reithmeier, 2014), TM4 is sandwiched between TM 8 and 9, which in turn have contacts with TM3 and 5. The Trp residues face out towards the lipid bilayer in this model. Disruption of this packing by mutation of Trp492 or Trp496 would affect protein folding and transport function, espcially since TM 8 contains active site residue Glu and lines the transport passage. Trp residues are important in maintaining the transport function of other transporters, including P-glycoprotein (Pawagi et al., Citation1994) and the multidrug resistance protein MRP1 (Braun & von Heijne, Citation1999). These Trp residues in AE1 may be located close to the inhibitor binding site and are likely those identified as involved in energy transfer to bound stilbene disulfonates (Lieberman & Reithmeier, Citation1983; Rao et al., Citation1979). Unfortunately, the low level of expression and loss of inhibitor binding of these mutants did not allow us to examine this question using purified Trp mutants of AE1.
Class 2: Trp648, Trp662, and Trp723
Mutation of Trp 648, 662, and 723 to Ala reduced the protein expression levels, cell surface expression, and SITS inhibitor binding, while Phe substitutions did not. The outcomes suggest that Trp648, Trp662, and Trp723 have a structural role by forming specific protein-protein interaction sites provided by large aromatic amino acid residues. Trp648 is located at the fourth extracellular loop, six residues distal from the N-glycosylation site at Asn642 (). The model of AE1 based on UraA places Trp648 at the end of a 2-turn helical segment that begins at Ser641 (Barneaud-Rocca et al., Citation2013; Cordat & Reithmeier, 2014). The region Ser643-Leu655 has an inaccessible conformation to membrane impermeant sulfhydryl-specific reagent, lucifer yellow iodoacetamide (LYIA) (649 Da), suggesting the region is buried within the folded structure of this region or perhaps protected by the carbohydrate structure at Asn642, sterically blocking LYIA access (Tang et al., Citation1998). We conclude that Trp648 is involved in specific interactions that stabilize this extracellular loop, either with the protein or the oligosaccharide.
N-glycosylation (Popov et al., Citation1999) and cysteine mutagenesis (Fujinaga et al., Citation1999) defined TM8 as consisting of 21 residues, encompassing Met663-Gln683, placing Trp662 at the extracellular transmembrane interface at the N-terminus of TM8 () consistent with the AEl model based on the UraA structure (Barneaud-Rocca et al., Citation2013; Cordat & Reithmeier, 2014). TM8 is a part of the anion translocation pore and contains three hydrophobic Phe residues facing the same direction, likely towards the lipid bilayer. The opposite side contains Glu681 defining the location of the active site of AE1 (Jennings & Anderson, Citation1987; Jennings & Smith, Citation1992). Trp662 and adjacent hydrophobic residues (Leu, Ile, and Ala), are proposed to line the ion translocation pore (Tang et al., Citation1999). Trp662 was identified as a functionally important residue since cysteine mutagenesis greatly diminished transport activity (Tang et al., Citation1999). We found that mutation of Trp662 to Ala resulted in loss of expression while mutation to Phe resulted in retention of expression and transport activity.
The W723A mutation had low expression, while mutation to Phe resulted in normal levels of expression. As indicated by the folding model of AE1 based on the UraA structure (Barneaud-Rocca et al., Citation2013; Cordat & Reithmeier, 2014), Trp723 is located at the extracellular end of TM10 () and is connected to trypsin-sensitive loop (T-loop: Trp723-Leu764), which may have structural and functional important roles by forming part of the channel in AE1. Experiments (Popov et al., Citation1997) assessing the ability to N-glycosylate residues in AE1 revealed that the loop comprising TMs 10 and 11 may be transiently exposed to the lumen of the ER during biosynthesis and folded into the protein following protein biosynthesis, placing the trypsin-sensitive Lys743 on the cytosolic side of the membrane (). Studies using cysteine scanning mutagenesis (Tang et al., Citation1999) showed that W648C and W662C had transport activities less than 10% of wild-type AE1. Our results indicate that W648F and W662F had higher transport activities than the cysteine mutations. Cysteine scanning mutagenesis was not tested on Trp723, though nearby residues Gly714 and Ser725 were identified as structurally and catalytically important residues in anion transport activity (Fujinaga et al., Citation1999). Together, the low transport activity and accessibility to LYIA suggest that G714, S725, and S731 are in a loop region accessible to the extracellular medium consistent with forming part of the external facing channel. If TM 10 is involved in substrate binding and translocation, then mutation of Trp723 to a small residue may affect functional expression, while mutation to a large aromatic residue like Phe may have little or no effect.
Class 3: Trp831 and Trp848
Mutation of Trp831 and Trp848 to Ala or Phe had no effect on expression, or trafficking from the ER to the cell surface. Scanning cysteine mutagenesis studies showed that biotin maleimide could partially label W831C, indicating a reactive cysteine exposed to aqueous media (Zhu et al., Citation2003). Trp831 is located on a cytosolic loop close to the beginning of TM13 (), which has dynamic aspect. Leu785-Ile841 corresponds to a cytoplasmic loop during biosynthesis (Popov et al., Citation1997). The region Pro815-Lys829 was however efficiently labeled by sulfhydryl-specific reagents in cysteine scanning mutagenesis and postulated to be accessible to labelling reagents on the extracellular portion of the membrane with an extended structure of Val828-Leu835. This extended structure forms the cytosolic loop connecting TM 12 and TM13.
The region may be flexible and induced to be accessible from the outside under certain conditions (Zhu et al., Citation2003). This was supported by N-glycosylation study in which a P820N mutant was slightly glycosylated in cell-free translation experiments but not glycosylated in transfected cells (Popov et al., Citation1999). The BRIC 132 antibody binds to the epitopes Phe813-Tyr824 within TM12, but only when treated with detergent can AE1 be immuno-precipitated from open and leaky erythrocytes (Wainwright et al., Citation1990). The BRIC epitope may be buried under isotonic conditions and conformation changes in low ionic strength may allow the region to be accessible (Wainwright et al., Citation1990). An NMR study (Askin et al., Citation1998) of a synthetic peptide of Gly796-Ile841 showed the region can be fitted into the extramembraneous protrusion of the cytoplasmic region in the three dimensional map of mdAE1 (Wang et al., Citation1994) but the region possesses an unusual structure with two distorted helices (Ile803-Leu810 and Tyr824-Phe836) are connected by the proline-rich loop (Askin et al., Citation1998). The authors postulated the structure of this region was stabilized by inter-helical interactions of conserved hydrophobic residues, Leu800, Val828, and Trp831. Our results indicate that Trp831 is not essential for functional expression of AE1. Models of AE1 based on the UraA strucutre place Trp831 in an exposed cytosolic loop connecting TM 12 and 13 (Barneaud-Rocca et al., Citation2013; Cordat & Reithmeier, 2014).
Although mutation of Trp848 had little impact on expression of AE1 in the present study, Trp848 has been defined at the extra-cytosolic end of TM13 in folding models of AE1 (). The entire region Phe836-Lys851 was not labeled with biotin maleimide in a cysteine mutagenesis study (Fujinaga et al., Citation1999), suggesting that this region forms part of TM13 in a hydrophobic environment embedded in the membrane with Trp848 located at the extra-cytosolic boundary region. The 3-D model of AE1 based on UraA places Trp848 at the extracytosolic end of TM13 (Barneaud-Rocca et al., Citation2013; Cordat & Reithmeier, 2014). The Ile840-Thr853 region was also postulated to be in a TM segment in a N-glycosylation study (Popov et al., Citation1997). TM13 is composed of only ∼16 amino acids, and may form a helical structure too short to fully to span the 30 Å membrane thickness, as ∼20 residues are required. A helical wheel plot (Reithmeier et al., 1996) showed functionally important residues located in hydrophilic helical face including Trp848 (W848C showed 26% of transport activity) and the DIDS-reactive Lys851 at the center of the helical face. The hydrophilic helical side defined by Lys851 may face the entrance to anion translocation pore, and Trp848 may also face this side and may participate in ion translocation by lining the pore. Trp848 is not, however, essential for functional expression of AE1.
Conclusions
This study examined the role of individual Trp residues in the functional expression of AE1 in transfected HEK-293 cells. In soluble proteins, Trp residues are commonly found, at the interface region, between the hydrophobic core and surface (Miller et al., Citation1987). Trp is also a common residue in the binding sites of enzymes (Adamian & Liang, Citation2001; Katz, Citation1995; Ordentlich et al., Citation1995; Yengo et al., Citation1998; Zeltins & Schrempf, Citation1997). In membrane proteins, the amphipathic nature of Trp side chain is important in stabilizing TM segments to position them in the bilayer at the interface of the lipid bilayer during biosynthesis (von Heijne, Citation1999; Yau et al., Citation1998). As Trp residues are conserved across species in the SLC4 family of anion exchangers, this suggests that they may be important in the proper folding and functional expression of these membrane transport proteins. Folding models of AE1 (Fujinaga et al., Citation1999; Popov et al., Citation1997, Citation1999; Zhu et al., Citation2003; Zhu & Casey, Citation2007), suggest that Trp492 and Trp496 are located in TM4 and would face the same side of the helix, Trp648 is just distal to the external N-glycosylation site (Asn642), Trp662 is located at boundary at the beginning of TM8, Trp723 at the boundary at the beginning of TM10, Trp831 is located in a hydrophilic loop preceding TM11, and Trp848 is at the boundary at the extra-cytosolic end of TM11 (). The Trp residues found in human AE1 are conserved mouse, dog, horse and chicken AE1 and in human AE2 and AE3, except Trp831 that is a leucine in human AE2.
The results indicate that Trp residues play different roles in the functional expression of AE1, depending on their location in the protein. Mutations of Trp492 and Trp496 profoundly affected expression, suggesting that they are essential in attaining a proper folded state, while others (Trp831 and Trp848) can be mutated without serious effect on functional expression of AE1. The effect of mutation of Trp residues in Class 2 was intermediate with Ala substitutions affecting expression, while Phe substitution had little effect allowing AE1 to maintain a functional protein structure, suggesting that bulky aromatic side chains are important at these sites.
Declaration of interest
The authors report no conflicts of interest. The authors alone are responsible for the content and writing of the paper. This work was supported by Canadian Institute of Health Research (CIHR) Operating Grants MOP102493 to RAFR and MOP133888 to JRC.
| Abbreviations | ||
| AE1 | = | anion exchanger 1 |
| DIDS | = | 4,4′-isothiocyanostilbene-2,2′-disulfonate |
| Endo H | = | endoglycososidase H |
| PBS | = | phosphate-buffered saline |
| PNGase F | = | N-glycosidase F |
| SITS | = | 4-acetamido-4′-isothiocyanostilbene-2,2′-disulfonate |
| SLC | = | solute carrier |
| TM | = | transmembrane |
Acknowledgements
Yilmaz Alguel (Imperial College, London) is thanked for helpful discussions.
References
- Adamian L, Liang J. 2001. Helix-helix packing and interfacial pairwise interactions of residues in membrane proteins. J Mol Biol 311:891–907
- Askin D, Bloomberg GB, Chambers EJ, Tanner MJ. 1998. NMR solution structure of a cytoplasmic surface loop of the human red cell anion transporter, band 3. Biochemistry 37:11670–11678
- Barneaud-Rocca D, Etchebest C, Guizouarn H. 2013. Structural model of the anion exchanger 1 (SLC4A1) and identification of transmembrane segments forming the transport site. J Biol Chem 288:26372–26384
- Braun P, von Heijne G. 1999. The aromatic residues Trp and Phe have different effects on the positioning of a transmembrane helix in the microsomal membrane. Biochemistry 38:9778–9782
- Brosius FC 3rd, Alper SL, Garcia AM, Lodish HF. 1989. The major kidney band 3 gene transcript predicts an amino-terminal truncated band 3 polypeptide. J Biol Chem 264:7784–7787
- Bustos SP, Reithmeier RA. 2011. Protein 4.2 interaction with hereditary spherocytosis mutants of the cytoplasmic domain of human anion exchanger 1. Biochem J 433:313–322
- Cabantchik ZI, Rothstein A. 1972. The nature of the membrane sites controlling anion permeability of human red blood cells as determined by studies with disulfonic stilbene derivatives. J Membr Biol 10:311–330
- Cordat E, Reithmeier RA. 2014. Structure, function, and trafficking of SLC4 and SLC26 anion transporters. Curr Top Membr 73:1–67
- Drickamer LK. 1978. Orientation of the band 3 polypeptide from human erythrocyte membranes. Identification of NH2-terminal sequence and site of carbohydrate attachment. J Biol Chem 253:7242–7248
- Fujinaga J, Tang XB, Casey JR. 1999. Topology of the membrane domain of human erythrocyte anion exchange protein, AE1. J Biol Chem 274:6626–6633
- Gomez S, Morgans C. 1993. Interaction between band 3 and ankyrin begins in early compartments of the secretory pathway and is essential for band 3 processing. J Biol Chem 268:19593–19597
- Grinstein S, Ship S, Rothstein A. 1978. Anion transport in relation to proteolytic dissection of band 3 protein. Biochim Biophys Acta 507:294–304
- Groves JD, Tanner MJ. 1994. Role of N-glycosylation in the expression of human band 3-mediated anion transport. Mol Membr Biol 11:31–38
- Jennings ML, Anderson MP. 1987. Chemical modification and labeling of glutamate residues at the stilbenedisulfonate site of human red blood cell band 3 protein. J Biol Chem 262:1691–1697
- Jennings ML, Smith JS. 1992. Anion-proton cotransport through the human red blood cell band 3 protein. Role of glutamate 681. J Biol Chem 267:13964–13971
- Katz BA. 1995. Binding to protein targets of peptidic leads discovered by phage display: Crystal structures of streptavidin-bound linear and cyclic peptide ligands containing the HPQ sequence. Biochemistry 34:15421–15429
- Laemmli UK. 1970. Cleavage of structural proteins during the assembly of the head of bacteriophage T4. Nature 227:680–685
- Landolt-Marticorena C, Reithmeier RAF. 1994. Asparagine-linked oligosaccharides are localized to single extracytosolic segments in multispan membrane-glycoproteins. Biochem J 302:253–260
- Landolt-Marticorena C, Williams KA, Deber CM, Reithmeier RAF. 1993. Nonrandom distribution of amino-acids in the transmembrane segments of human type-I single span membrane-proteins. J Molec Biol 229:602–608
- Li J, Quilty J, Popov M, Reithmeier RAF. 2000. Processing of N-linked oligosaccharide depends on its location in the anion exchanger, AE1, membrane glycoprotein. Biochem J 349:51–57
- Lieberman DM, Reithmeier RAF. 1983. Characterization of the stilbenedisulfonate binding-site of the band-3 polypeptide of human-erythrocyte membranes. Biochemistry 22:4028–4033
- Low PS. 1986. Structure and function of the cytoplasmic domain of band 3: Center of erythrocyte membrane-peripheral protein interactions. Biochim Biophys Acta 864:145–167
- Lu F, Li S, Jiang Y, Jiang J, Fan H, Lu G, et al. 2011. Structure and mechanism of the uracil transporter UraA. Nature 472:243–246
- Miller S, Janin J, Lesk AM, Chothia C. 1987. Interior and surface of monomeric proteins. J Mol Biol 196:641–656
- Ordentlich A, Barak D, Kronman C, Ariel N, Segall Y, Velan B, Shafferman A. 1995. Contribution of aromatic moieties of tyrosine 133 and of the anionic subsite tryptophan 86 to catalytic efficiency and allosteric modulation of acetylcholinesterase. J Biol Chem 270:2082–2091
- Pang AJ, Bustos SP, Reithmeier RAF. 2008. Structural characterization of the cytosolic domain of kidney chloride/bicarbonate anion exchanger 1 (kAE1). Biochemistry 47:4510–4517
- Patterson ST, Reithmeier RA. 2010. Cell surface rescue of kidney anion exchanger 1 mutants by disruption of chaperone interactions. J Biol Chem 285:33423–33434
- Pawagi AB, Wang J, Silverman M, Reithmeier RAF, Deber CM. 1994. Transmembrane aromatic amino-acid distribution in P-glycoprotein – a functional-role in broad substrate-specificity. J Molec Biol 235:554–564
- Pimplikar SW, Reithmeier RAF. 1986. Affinity-chromatography of Band-3, the anion transport protein of erythrocyte-membranes. J Biol Chem 261:9770–9778
- Popov M, Li J, Reithmeier RA. 1999. Transmembrane folding of the human erythrocyte anion exchanger (AE1, Band 3) determined by scanning and insertional N-glycosylation mutagenesis. Biochem J 339:269–279
- Popov M, Reithmeier RAF. 1999. Calnexin interaction with N-glycosylation mutants of a polytopic membrane glycoprotein, the human erythrocyte anion exchanger 1 (band 3). J Biol Chem 274:17635–17642
- Popov M, Tam LY, Li J, Reithmeier RA. 1997. Mapping the ends of transmembrane segments in a polytopic membrane protein. Scanning N-glycosylation mutagenesis of extracytosolic loops in the anion exchanger, band 3. J Biol Chem 272:18325–18332
- Quilty JA, Reithmeier RAF. 2000. Trafficking and folding defects in hereditary spherocytosis mutants of the human red cell anion exchanger. Traffic 1:987–998
- Rao A, Martin P, Reithmeier RAF, Cantley LC. 1979. Location of the stilbenedisulfonate binding-site of the human-erythrocyte anion-exchange system by resonance energy-transfer. Biochemistry 18:4505–4516
- Reithmeier RAF. 1995. Characterization and modeling of membrane-proteins using sequence-analysis. Curr Opin Struct Biol 5:491–500
- Reithmeier RAF, Chan SL, Popov M. 1996. Structure of the erythrocyte Band 3 anion exchanger. In Konings WN, Kaback HR, Lolkema JS, eds. Transport Processes in Eukaryotic and Prokaryotic Organisms. Amsterdam: Elsevier Science BV, 281–309
- Sells MA, Li J, Chernoff J. 1995. Delivery of protein into cells using polycationic liposomes. Biotechniques 19:72–76, 78
- Shnitsar V, Li J, Li X, Calmettes C, Basu A, Casey JR, et al. 2013. A substrate access tunnel in the cytosolic domain is not an essential feature of the SLC4 family of bicarbonate transporters. J Biol Chem 288:33848–33860
- Tang XB, Fujinaga J, Kopito R, Casey JR. 1998. Topology of the region surrounding Glu681 of human AE1 protein, the erythrocyte anion exchanger. J Biol Chem 273:22545–22553
- Tang XB, Kovacs M, Sterling D, Casey JR. 1999. Identification of residues lining the translocation pore of human AE1, plasma membrane anion exchange protein. J Biol Chem 274:3557–3564
- Thomas JA, Buchsbaum RN, Zimniak A, Racker E. 1979. Intracellular pH measurements in Ehrlich ascites tumor cells utilizing spectroscopic probes generated in situ. Biochemistry 18:2210–2218
- Towbin H, Staehelin T, Gordon J. 1979. Electrophoretic transfer of proteins from polyacrylamide gels to nitrocellulose sheets: procedure and some applications. Proc Natl Acad Sci USA 76:4350–4354
- von Heijne G. 1999. Recent advances in the understanding of membrane protein assembly and structure. Q Rev Biophys 32:285–307
- Wainwright SD, Mawby WJ, Tanner MJ. 1990. The membrane domain of the human erythrocyte anion transport protein. Epitope mapping of a monoclonal antibody defines the location of a cytoplasmic loop near the C-terminus of the protein. Biochem J 272:265–268
- Wang DN, Sarabia VE, Reithmeier RAF, Kuhlbrandt W. 1994. 3-dimensional map of the dimeric membrane domain of the human erythrocyte anion-exchanger, band-3. EMBO J 13:3230–3235
- Yau WM, Wimley WC, Gawrisch K, White SH. 1998. The preference of tryptophan for membrane interfaces. Biochemistry 37:14713–14718
- Yengo CM, Fagnant PM, Chrin L, Rovner AS, Berger CL. 1998. Smooth muscle myosin mutants containing a single tryptophan reveal molecular interactions at the actin-binding interface. Proc Natl Acad Sci USA 95:12944–12949
- Zeltins A, Schrempf H. 1997. Specific interaction of the Streptomyces chitin-binding protein CHB1 with alpha-chitin – the role of individual tryptophan residues. Eur J Biochem 246:557–564
- Zhang D, Kiyatkin A, Bolin JT, Low PS. 2000. Crystallographic structure and functional interpretation of the cytoplasmic domain of erythrocyte membrane band 3. Blood 96:2925–2933
- Zhu Q, Casey JR. 2007. Topology of transmembrane proteins by scanning cysteine accessibility mutagenesis methodology. Methods 41:439–450
- Zhu Q, Lee DW, Casey JR. 2003. Novel topology in C-terminal region of the human plasma membrane anion exchanger, AE1. J Biol Chem 278:3112–3120