
Abstract
Effects of hypothermia and rewarming on thrombomodulin, catecholamines and heat shock transcription factor 1 (HSF1) were studied in rats. The aims of this study were to clarify whether cold stress, under anesthesia, is sufficient to change levels of thrombomodulin in healthy endothelium and in the circulation and whether adrenaline, noradrenaline and HSF1 could act as regulators in the process. Rats were divided into control, mild hypothermia (2 and 4.5 hours at + 21 °C; MH1, MH2), severe hypothermia (2 and 4.5 h at + 10 °C; SH1, SH2) and two rewarming groups (2 h at + 10 °C followed by 2 h at + 21 °C or 3 h at + 28 °C; SHW1, SHW2) (n = 15/group, except n = 6 in MH1). Fentanyl-fluanisone-midazolam was used as anesthetic. Low levels of thrombomodulin in plasma and myocardial arterioles/venules measured by ELISA and immunohistochemistry were associated with significant increase of thrombomodulin transcript level in SH1 rats analyzed by quantitative PCR. Plasma adrenaline correlated negatively with the relative amount of myocardial thrombomodulin transcripts and positively with plasma thrombomodulin in SH. Transcript levels of thrombomodulin and HSF1 correlated strongly (r = 0.83; p < 0.001) in SH. Plasma/urine ratio of thrombomodulin and plasma adrenaline (r = 0.87; p = 0.005) or noradrenaline (r = 0.78; p = 0.023) were strongly correlated in SHW1 rats. Hence, cellular and soluble levels of thrombomodulin are modified by cold stress in healthy rats, possibly via catecholamines and HSF1.
Introduction
Cold exposure and hypothermia modify physiological responses of cells and tissues. Adaptation takes place with repeated exposures, but acute excessive cold can lead to fatal hypothermia. However, hypothermia in controlled situations is known to protect tissues in stress conditions such as hypoxia. The mechanisms behind such beneficial effects are unclear and are important to understand for several aspects of medical practice, including hypothermic surgery. Furthermore, specific markers of cold exposure and hypothermia would be useful in forensic medicine as the impact of cold in some fatalities can be challenging to confirm.
Hypothermia activates the sympathetic nervous system. This activation is a requirement for survival responses in life-threatening conditions, but a prolonged stimulus in critical illness, for example, has deleterious effects on several organs, especially the heart (Triposkiadis et al., Citation2009). Sympathoadrenal activation leads to increased plasma levels of catecholamines, most importantly adrenaline and noradrenaline (Pakanen et al., Citation2011). They have immediate effects on, for example, blood circulation and vascular endothelium by influencing vasoconstriction. However, high catecholamine levels damage vascular endothelium causing local edema, endothelial cell swelling, necrosis and progressive destruction (Kristová et al., Citation1993; Makhmudov et al., Citation1985).
Thrombomodulin (Esmon et al., Citation1982) is a transmembrane protein specific to endothelial cells, and its soluble forms have been used to estimate endothelial injury (Remková et al., Citation2000). The structure of this protein is complex, with five distinct functional domains (Suzuki et al., Citation1987; Wen et al., Citation1987). The structural properties form the basis for functional heterogeneity of the protein, alternating from its anticoagulant properties (Esmon & Owen, Citation1981) to the regulation of inflammation (Van de Wouwer & Conway, Citation2004). Soluble forms of thrombomodulin in urine and blood possess various degrees of anticoagulant activity similar to their cellular transmembrane counterpart (Nakano et al., Citation1998; Ohlin et al., Citation2005). Different proteases have been suggested to be responsible for the shedding of soluble forms in cell culture, but the mechanism of cleavage in vascular cells has not yet been elucidated. It is obvious, however, that thrombomodulin is crucial for healthy endothelium and a functional circulatory system (Martin et al., Citation2013).
Heat shock transcription factor 1 (HSF1) has been shown to regulate thrombomodulin gene expression in endothelial cells (Fu et al., Citation2008). HSF1 (Abravaya et al., Citation1992) is a DNA-binding regulatory protein able to coordinate transcription during stress when transcription, translation and proliferation are generally depressed. In response to stress, HSF1 trimerizes, accumulates in the nucleus and binds to heat shock elements along target genes, which leads to transcriptional activation (Vihervaara & Sistonen, Citation2014). Heat shock of vascular endothelial cells is known to increase transcriptional activity of thrombomodulin (Conway et al., Citation1994). Thrombomodulin is an intron-less gene (Jackman et al., Citation1987) and may need to be rapidly regulated for survival during environmental challenges (Jeffares et al., Citation2008), including cold.
Hypothermia is known to cause alterations in platelet aggregation and endothelial-associated coagulation. The concentration of soluble thrombomodulin is further increased in hypothermic cardiopulmonary bypass compared with normothermic surgery for patients with cardiovascular diseases. This was suggested to result from endothelial damage or activation promoted by hypothermia (Boldt et al., Citation1996). According to our hypothesis, cold stress to animals without cardiovascular disease is sufficient to cause alterations in cellular and soluble levels of thrombomodulin. Furthermore, catecholamines and HSF1 could be potential stress mediators behind these alterations. In this study, we investigated the effects of whole body cold stress as well as rewarming on cardiac, circulating and excreted forms of thrombomodulin in healthy rats. In addition, correlations between thrombomodulin, adrenaline and noradrenaline in the circulation or urine and HSF1 mRNA levels in the heart were studied.
Materials and methods
Animals
A total of 96 Sprague-Dawley male rats aged between 8 and 9 weeks and with an average weight of 329 g were subjected to experimental procedures. The rats were reared in the Laboratory Animal Centre, University of Oulu, Finland. The rats (n = 4/cage) received food and water ad libitum. They were housed in an air-conditioned (12 changes/h) room with an artificial lighting schedule (12 h light:12 h dark, lights on at 06:00 h, off at 18:00 h). The temperature in the animal rooms and the temperature during experiments conducted at room temperature was + 21 ± 2 °C. Experiments started between 08:00 h and 09:00 h. All experiments were conducted according to the protocol approved by the Finnish National Animal Experiment Board (license no: ESAVI/974/04.10.03/2012). The license requires that the animals are anesthetized during cold exposure.
Experimental design
In pilot experiments, rectal temperature of rats and primarily thrombomodulin mRNA expression in rat heart tissues and occasionally also concentrations of soluble thrombomodulin were determined (data not shown) after different durations (50, 60, 120, 220, 270 and 300 min) in a cold room at + 10 °C and at + 21 ± 2 °C room temperature (0, 120 and 270 min). Based on pilot tests, the actual experiments were decided to be those presented in . Rats were randomly divided into seven groups. The groups were: control (C), mild hypothermia 1 (MH1), mild hypothermia 2 (MH2), severe hypothermia 1 (SH1), severe hypothermia 2 (SH2), SH followed by rewarming at room temperature (SHW1) and SH followed by rewarming at + 28 °C in an incubator (SHW2). MH1 consisted of six rats, while all the other groups consisted of 15 rats.
Figure 1. Illustration of the experimental protocol. Rats were anesthetized and killed immediately (control group) or subjected to various ambient temperatures presented in the figure (all other groups). MH1, mild hypothermia 1: the rats were kept at room temperature for 2 h. MH2, mild hypothermia 2: the rats were kept at room temperature for 4.5 h. SH1, severe hypothermia 1: the rats were kept in a cold room at + 10 °C for 2 h. SH2, severe hypothermia 2: the rats were kept at + 10 °C until the rectal temperature had decreased to + 20 °C with 4.5 h mean duration of cold exposure. SHW1, severe hypothermia followed by rewarming at room temperature: the rats were kept at + 10 °C for 2 h and then at room temperature for another 2 h. SHW2, severe hypothermia followed by rewarming at + 28 °C: the rats were first kept at + 10 °C for 2 h, and after that they were moved into an incubator with a temperature of + 28 °C for 3 h. During the last 3 h, no anesthetic was given to the rats in this group to ensure recovery of normal body temperature. However, a single intramuscular 0.12-ml dose was administered prior to killing; n = 6–15 per group; data are mean ± SEM.
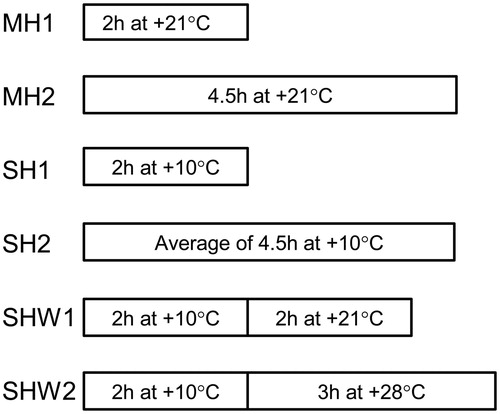
The immediate transient drop in body temperature after administration of anesthetic cannot be avoided by external warming (De Witte et al., Citation2010; Hynson & Sessler, Citation1992), so the rats in groups MH1 and MH2 were not warmed during anesthesia. These time point controls for SH1 and SH2 groups allowed us to monitor the pharmacological, anesthesia-induced decrease in body temperature, which also contributes to the SH of anesthetized rats exposed to cold.
Each rat was anesthetized using 0.5 mL of a mixture of Hypnorm® (fentanyl 0.32 mg/mL + fluanisone 10 mg/mL; Janssen Pharmaceutica, Inc., Beerse, Belgium), Dormicum® (midazolam 5 mg/mL; Roche, Basel, Switzerland) and aqua 1:1:2 injected subcutaneously into the back. The rats were weighed, and their body temperature was measured with a rectal temperature probe. During the experiments, the rats were monitored continuously, and whenever a toe pinch reflex appeared, 0.12 mL intramuscular injection of the anesthetic was administered into the thigh to ensure a rapid effect. The mean total doses of anesthetic (fentanyl + fluanisone + midazolam) in each group were: C, 0.04 mg + 1.25 mg + 0.63 mg; MH1, 0.06 mg + 2.05 mg + 1.03 mg; MH2, 0.10 mg + 3.10 mg + 1.55 mg; SH1, 0.07 mg + 2.33 mg + 1.16 mg; SH2, 0.09 mg + 2.88 mg + 1.44 mg; SHW1, 0.09 mg + 2.90 mg + 1.45 mg and SHW2, 0.07 mg + 2.25 mg + 1.13 mg. The rectal temperature data were collected at intervals of 5 min except for the rats in the SHW1 and SHW2 groups, in which temperature was recorded only at the beginning of the test, at the 2-h interval and at the end of the test. After completion of the experiments, the rats were killed by decapitation, and the heart and samples were collected of blood, into tubes containing ethylenediaminetetraacetic acid, and urine. The upper half of the heart, horizontally cut through the ventricles, was fixed with formalin (24 h) and embedded in paraffin, and the lower half was frozen with liquid nitrogen and stored at −80 °C. Urine and plasma, separated from blood, were stored at −80 °C. Non-hemolyzed plasma was obtained from all 15 rats in groups C, SH2, SHW1, 14 rats in group MH2, 13 rats in groups SH1, SHW2 and from all six rats in group MH1. Sufficient urine was collected from the bladders of 7 C, 5 MH1, 14 MH2, 13 SH1, 8 SH2 and SHW1 and 12 SHW2 rats.
Real-time quantitative RT-PCR
Total RNA was extracted from heart tissues stored at −80 °C with an miRNeasy mini kit (Qiagen, Hilden, Germany) using an automated QIAcube sample preparation instrument (Qiagen) according to the manufacturer's protocols. The quality of RNA was evaluated electrophoretically. A High Capacity cDNA RT kit (Applied Biosystems, Foster City, CA) was used to reverse transcribe the RNAs with random primers according to the manufacturer's protocol.
The complementary DNAs were amplified in duplicate with a Rotor-Gene 3000 (Corbett Life Science, Sydney, Australia) using gene-specific primers (Sigma, Haverhill, UK); thrombomodulin: NM_031771.2, F 5′-GATCTCCATTGCCAGCCT-3′, R 5′-CACGTGCTGCAGTACTACCT-3′, amplicon size 140 bp; HSF1: XM_006241890.1, F 5′-CCATGAAGCACGAGAACGAG-3′, R 5′-ACTGCACCAGTGAGATCAGGA-3′, amplicon size 117 bp; amphiregulin: NM_017123.1, F 5′-GTGCATGCCATTGCCTAGCTGA-3′, R 5′-TCATTTCCGGTGTGGCTTGGCA-3′, amplicon size 78 bp, and the Maxima SYBR Green qPCR Master Mix (Fermentas, Glen Burnie, MD) real-time PCR system according to the manufacturers' protocols. Amplifications were carried out as follows: one cycle for denaturation ( + 95 °C, 10 min) followed by 40 cycles for three-stage PCR (thrombomodulin and amphiregulin: + 95 °C 15 s, + 57 °C 30 s and + 72 °C 30 s; HSF1: + 95 °C 15 s, + 60 °C 30 s and + 73 °C 30 s). Fluorescence signals were measured continuously during repetitive cycles in order to detect Ct values for target (thrombomodulin and HSF1) and reference (amphiregulin) genes in the samples. The mean fold change in relative expression of the target gene at each group was calculated using the 2–ΔΔCt method (Livak & Schmittgen, Citation2001), where ΔΔCt = (Cttarget gene − Ctreference gene)group x − (Cttarget gene − Ctreference gene)control group.
Immunohistochemistry
The paraffin-embedded heart tissue specimens were sectioned horizontally at a thickness of 5 μm. The sections were deparaffinized and rehydrated prior to automatic epitope retrieval by the PT-link system (DAKO, Glostrup, Denmark). Immunohistochemical staining was carried out in an automated instrument (DAKO, Autostainer Plus) using the EnVision (Peroxidase/DAP) detection system (DAKO) according to standard procedures and manufacturers' instructions. Monoclonal antibody MCA641 (mouse IgG2a; AbD Serotec, Raleigh, NC) was used to detect thrombomodulin protein at 1:30 dilution for the heart sections. Slides were counterstained with hematoxylin (Reagena, Toivala, Finland). Thrombomodulin immunoreactivity in endothelial cells in myocardial blood vessels was divided into three categories: (1) absent to weak staining intensity, (2) moderate staining intensity and (3) strong staining intensity. The staining of endothelial cells was scored separately in the myocardial arterioles and venules, and in the capillaries. The sections were scored blind to group by two observers. The slides were observed with a Nikon Microphot SA microscope and photographed with a Nikon FX35DX camera (Nikon, Tokyo, Japan). All six cases from MH1 and 12 randomly selected cases from the other groups were included in the immunohistological study.
Soluble thrombomodulin and catecholamine assays
An enzyme-linked immunosorbent assay kit (Uscn Life Science Inc., Houston, TX) was used to determine the plasma and urine concentrations of soluble thrombomodulin. Sensitivity of the assay was typically less than 7.1 pg/ml. Coefficients of variance for intra/inter-assay precisions were < 10% and < 12%, respectively. A Cat Combi ELISA kit (DRG, Marburg, Germany) was used for the quantitative determination of plasma and urine adrenaline and noradrenaline. Analytical sensitivities for adrenaline and noradrenaline were 0.011 and 0.044 ng/ml in plasma and 0.33 and 1.33 ng/ml in urine, respectively. Coefficients of variance for intra-assay precisions were 15.0% for adrenaline and 16.1% for noradrenaline at 2.5 ng/ml and 24.4 ng/ml levels, respectively. The measurements were performed with a Multiscan EX microplate reader (Thermo Scientific, Waltham, MA).
Statistics
Statistical analyses were conducted using IBM SPSS statistics, version 19 (Armonk, NY). The pair-wise analyses were done either with the parametric t-test (statistical significance level set at p < 0.05) or with the non-parametric Mann–Whitney test (statistical significance level set at p < 0.05). Correlations between the variables were evaluated by Pearson correlation test (two-tailed; statistical significance level set at p < 0.05). The data are given as mean ± SEM.
Results
Body temperature measurements
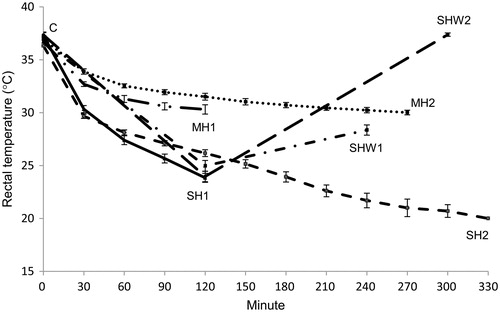
The rectal temperatures of the rats during the experiments are presented in . Cold exposure at + 10 °C for 2 and 4.5 h decreased mean body temperatures of anesthetized rats more than did equal lengths of anesthesia without ambient cold exposure: SH1 vs. MH1, t(19) = 8.10, p = 0.000, t-test; SH2 vs. MH2, U = 0.00, Z = −4.92, p = 0.000, Mann–Whitney test. There was no statistically significant difference between MH1 vs. MH2 or between control and SHW2 groups.
Figure 2. Rectal temperatures of rats during experiments. Rectal temperatures of the rats were measured at intervals of 5 min except for the rats in the SHW1 and SHW2 groups, where the temperatures were measured at the beginning of the test, at the 2-h interval and at the end of the test. C, control; MH1, mild hypothermia 1; MH2, mild hypothermia 2; SH1, severe hypothermia 1; SH2, severe hypothermia 2; SHW1, severe hypothermia followed by rewarming at room temperature; SHW2, severe hypothermia followed by rewarming at + 28 °C; n = 6–15 per group; data are mean ± SEM.
Plasma thrombomodulin
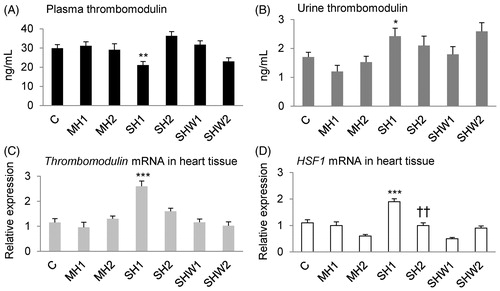
The mean value for plasma thrombomodulin concentration in the SH1 group was significantly lower than the respective value in the MH1 group, t(17) = 3.18, p = 0.005, t-test ().
Figure 3. Rat thrombomodulin concentrations in plasma and urine, thrombomodulin and HSF1 mRNA expressions in heart tissue. Panel A: plasma thrombomodulin (ng/mL; n = 6–15 per group), panel B: urine thrombomodulin (ng/mL; n = 5–14 per group), panel C: relative cardiac thrombomodulin mRNA expression (n = 6–15 per group) and panel D: relative cardiac HSF1 mRNA expression (n = 6–15 per group); data are mean ± SEM; C, control; MH1, mild hypothermia 1; MH2, mild hypothermia 2; SH1, severe hypothermia 1; SH2, severe hypothermia 2; SHW1, severe hypothermia followed by rewarming at room temperature; SHW2, severe hypothermia followed by rewarming at + 28 °C; HSF1, heat shock transcription factor 1; *p < 0.05, **p < 0.01, ***p < 0.001 vs. MH1 (t-test); ††p < 0.01 vs. MH2 (t-test).
Urine thrombomodulin
The mean urine thrombomodulin concentration was greater in SH1 than in MH1 rats, t(16) = −2.56, p = 0.021, t-test ().
Thrombomodulin mRNA expression in heart tissue
The mean relative thrombomodulin mRNA expression in the SH1 group was significantly greater than that in the MH1 group, t(19) = −4.70, p = 0.000, t-test ().
HSF1 mRNA expression in heart tissue
The mean relative HSF1 mRNA expression in the SH1 group was significantly greater than the mean expression in the MH1 group, t(19) = −4.87, p = 0.000, t-test, and the mean expression in the SH2 group was significantly greater than that in the MH2 group, t(22.50) = −2.98, p = 0.007, t-test ().
Thrombomodulin protein expression in myocardial blood vessels
Myocardial endothelial cells showed positive cytoplasmic thrombomodulin immunostaining in all groups (; ). In myocardial arterioles and venules, the mean values for thrombomodulin staining in the SH1 and SHW2 groups were significantly lower than that in the SHW1 group: SH1 vs. SHW1, U = 24.00, Z = −3.03, p = 0.005, Mann–Whitney test; SHW2 vs. SHW1, U = 18.00, Z = −3.48, p = 0.001, Mann–Whitney test.
Figure 4. Thrombomodulin protein expression in rat heart tissue. Thrombomodulin immunohistochemical staining can be seen in the vascular endothelial cells of heart tissues (n = 12 per group); C, control; MH2, mild hypothermia 2; SH1, severe hypothermia 1; SH2, severe hypothermia 2; SHW1, severe hypothermia followed by rewarming at room temperature; SHW2, severe hypothermia followed by rewarming at + 28 °C; scale bar = 50 μm.
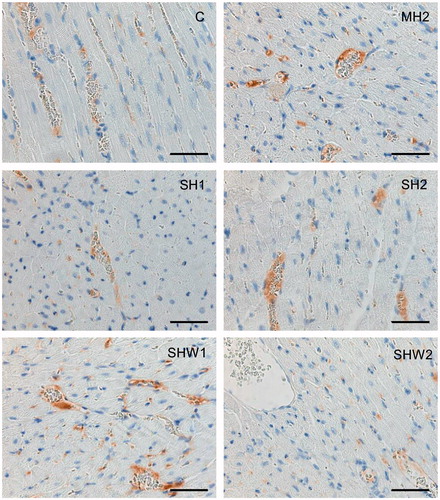
Table 1. Thrombomodulin protein expression in endothelial cells of myocardial blood vessels.
In capillary endothelial cells, the staining in the SHW1 group was stronger than in the SHW2 group, U = 16.00, Z = −3.43, p = 0.001, Mann–Whitney test, and also stronger than in the SH1 group: U = 28.50, Z = −2.80, p = 0.010, Mann–Whitney test.
The staining intensity among arterioles/venules and capillaries did not differ significantly within groups.
Plasma and urine catecholamines
The plasma and urine catecholamine concentrations and statistical analyses are listed in .
Table 2. Plasma and urine catecholamine concentrations and statistical analyses.
Correlations
Results of correlation analyses are summarized in .
Table 3. Correlations with rat endpoint body temperatures, cardiac thrombomodulin mRNA expression and catecholamine values.
Discussion
We have shown in rats that SH causes a decrease in the concentration of thrombomodulin in plasma and an increase in the concentration in urine. Concomitantly, increased levels of cardiac transcripts encoding thrombomodulin and HSF1 were detected. Relative amounts of these transcripts correlated strongly with each other, especially in SH. Variation in catecholamine levels occurred during cold stress, and particularly high correlations were seen between the plasma thrombomodulin/urine thrombomodulin ratio and plasma adrenaline and noradrenaline concentrations in rewarming. As a whole, the results support our hypothesis that the levels of cellular and soluble forms of thrombomodulin are decreased and increased, respectively, by cold stress in healthy endothelium and the circulation, possibly in a catecholamine and HSF1-dependent way.
Previous studies have indicated that cold exposure increases the concentrations of soluble thrombomodulin in plasma of patients undergoing cardiopulmonary bypass (Boldt et al., Citation1996). Our results concerning healthy hypothermic rats indicate variations in plasma thrombomodulin levels within a narrow range (). SH caused by 2 h of cold exposure (SH1 group) led to a significantly decreased plasma thrombomodulin concentration compared with that in MH1 group. Simultaneously, increased thrombomodulin level in urine was detected in SH ().
A concomitant increase in the heart thrombomodulin mRNA level with a minimal thrombomodulin concentration in plasma was detected in SH1 rats (). Furthermore, the relative amount of membrane-bound thrombomodulin in the endothelial cells of myocardial arterioles/venules was low in SH1 rats (; ). The low level of thrombomodulin protein could explain the transcriptional activation of the thrombomodulin gene during SH. According to a model of endothelial gene regulation, biochemical and biomechanical signals from the extracellular milieu are typical modulators of inducible genes like thrombomodulin in the endothelium (Minami & Aird, Citation2005). A moderate negative correlation between plasma thrombomodulin concentration and thrombomodulin mRNA expression in the heart was detected in SH (r = −0.64; p < 0.001). In contrast, a correlation between plasma and cellular thrombomodulin protein could not be shown. Therefore, it is possible that some kind of feedback mechanism exists between the soluble blood thrombomodulin and cardiac thrombomodulin mRNA expression. Interestingly, Martin et al. (Citation2013) suggested that a chronically elevated cyclic circumferential strain leads to reduced cellular expression of thrombomodulin protein and mRNA in cultured human aortic endothelial cells with a simultaneous increase of thrombomodulin secretion into the medium.
According to immunohistochemistry (), the levels of membrane-bound thrombomodulin in myocardial arterioles/venules and capillaries were statistically similar within each group (), although the micro- and macrovascular endothelial cells are known to respond differently under specific stress conditions (Wiktorowska-Owczarek et al., Citation2007). However, when compared to the SH1 group, higher mean levels of cellular thrombomodulin were detected in the SHW1 group where normal body temperature was not quite reached. In contrast, the SHW2 group with recovered body temperature showed lower levels of cellular thrombomodulin, possibly due to increased release. Especially in the capillaries, the high thrombomodulin protein level was associated with low endpoint body temperature upon rewarming (r = –0.67; p < 0.001). These results suggest that controlling the amount of cellular thrombomodulin is important during and after cold stress.
Plasma adrenaline could be an important regulator of thrombomodulin transcript levels in cold exposure and rewarming (). Adrenaline is known to increase cyclic adenosine monophosphate (cAMP) level, leading to the activation of the protein kinase A signaling cascade (Triposkiadis et al., Citation2009). In endothelial cells, upregulation of thrombomodulin gene transcription by cAMP treatment has been reported (Grey et al., Citation1998; Hirokawa & Aoki, Citation1990), but the regulatory mechanisms are most likely modified in hypothermia. The regulatory regions of the thrombomodulin gene contain multiple binding sites for heat shock factors, indicating the possibility that transcriptional changes can occur during stress, leading to alterations in cellular and soluble thrombomodulin levels (Conway et al., Citation1994). The transcription factor HSF1 has been connected both to cold and heat stress, but the activation mechanism of the factor differs in hypo- and hyperthermia (Cullen & Sarge, Citation1997). In the SH1 group, a high relative expression level of HSF1 was found, similar to that of thrombomodulin (). Positive correlation between the relative transcript levels of HSF1 and thrombomodulin was strong especially in SH (r = 0.83; p < 0.001). Thus, HSF1 might act as a transcriptional activator of the thrombomodulin gene during SH. This factor is also involved in the transcriptional upregulation of thrombomodulin induced by statins (Fu et al., Citation2008). Furthermore, HSF1 is possibly also under adrenaline-dependent regulation during SH, as indicated by a clear correlation (r = −0.65; p < 0.001) between plasma adrenaline concentration and HSF1 mRNA expression.
As a whole, the correlation analyses between thrombomodulin and catecholamines () indicate that at least adrenaline may be a key regulator of the cellular and soluble forms of thrombomodulin during cold stress; noradrenaline may also be involved in these regulatory processes. The cleavage of the transmembrane domain of thrombomodulin is known to be directed by the cytoplasmic tail (Lohi et al., Citation2004). A mechanism for catecholamine action on thrombomodulin shedding could be based on the protein kinase A-dependent phosphorylation of threonine-550 (Cho et al., Citation2013) in the cytoplasmic tail of thrombomodulin.
In conclusion, SH leads to a decrease in plasma thrombomodulin concentration and a concomitant increase in cardiac thrombomodulin transcript levels. HSF1 might be involved in the transcriptional upregulation of thrombomodulin during SH. Adrenaline could be an important regulator of thrombomodulin during cold stress, as indicated by positive and negative correlations concerning the soluble protein and transcript levels, respectively. The role of noradrenaline could not be excluded in the cold-induced regulatory processes of thrombomodulin. The value of thrombomodulin as a hypothermia marker should be further evaluated. Altogether, our data suggest that there is interplay between the local and systemic changes in thrombomodulin levels due to hypothermia and catecholamine action.
Declaration of interest
The authors declare that there are no conflicts of interest.
This work was supported by the University of Oulu, Finland.
Acknowledgements
The authors are grateful to the staff of the laboratory and the department. The authors also thank veterinarian Sakari Laaksonen and the staff at the Laboratory Animal Center for their help and expertise with laboratory animals.
Related Research Data
References
- Abravaya K, Myers MP, Murphy SP, Morimoto RI. The human heat shock protein hsp70 interacts with HSF, the transcription factor that regulates heat shock gene expression. Genes Dev 1992;6:1153–64
- Boldt J, Knothe C, Welters I, Dapper FL, Hempelmann G. Normothermic versus hypothermic cardiopulmonary bypass: do changes in coagulation differ? Ann Thorac Surg 1996;62:130–5
- Cho CF, Chen PK, Chang PC, Wu HL, Shi GY. Human plasminogen kringle 1–5 inhibits angiogenesis and induces thrombomodulin degradation in a protein kinase A-dependent manner. J Mol Cell Cardiol 2013;63:79–88
- Conway EM, Liu L, Nowakowski B, Steiner-Mosonyi M, Jackman RW. Heat shock of vascular endothelial cells induces an up-regulatory transcriptional response of the thrombomodulin gene that is delayed in onset and does not attenuate. J Biol Chem 1994;269:22804–10
- Cullen KE, Sarge KD. Characterization of hypothermia-induced cellular stress response in mouse tissues. J Biol Chem 1997;272:1742–6
- De Witte JL, Demeyer C, Vandemaele E. Resistive-heating or forced-air warming for the prevention of redistribution hypothermia. Anesth Analg 2010;110:829–33
- Esmon CT, Owen WG. Identification of an endothelial cell cofactor for thrombin-catalyzed activation of protein C. Proc Natl Acad Sci U S A 1981;78:2249–52
- Esmon NL, Owen WG, Esmon CT. Isolation of a membrane-bound cofactor for thrombin-catalyzed activation of protein C. J Biol Chem 1982;257:859–64
- Fu Q, Wang J, Boerma M, Berbée M, Qiu X, Fink LM, Hauer-Jensen M. Involvement of heat shock factor 1 in statin-induced transcriptional upregulation of endothelial thrombomodulin. Circ Res 2008;103:369–77
- Grey ST, Csizmadia V, Hancock WW. Differential effect of tumor necrosis factor-alpha on thrombomodulin gene expression by human monocytoid (THP-1) cell versus endothelial cells. Int J Hematol 1998;67:53–62
- Hirokawa K, Aoki N. Up-regulation of thrombomodulin in human umbilical vein endothelial cells in vitro. J Biochem 1990;108:839–45
- Hynson JM, Sessler DI. Intraoperative warming therapies: a comparison of three devices. J Clin Anesth 1992;4:194–9
- Jackman RW, Beeler DL, Fritze L, Soff G, Rosenberg RD. Human thrombomodulin gene is intron depleted: Nucleic acid sequences of the cDNA and gene predict protein structure and suggest sites of regulatory control. Proc Natl Acad Sci USA 1987;84:6425–9
- Jeffares DC, Penkett CJ, Bähler J. Rapidly regulated genes are intron poor. Trends Genet 2008;24:375–8
- Kristová V, Kriska M, Canová R, Hejdová E, Kobzová D, Dobrocký P. Endothelial changes following repeated effect of vasoconstrictive substances in vitro. Acta Physiol Hung 1993;81:363–70
- Livak KJ, Schmittgen TD. Analysis of relative gene expression data using real-time quantitative PCR and the 2-ΔΔCT method. Methods 2001;25:402–8
- Lohi O, Urban S, Freeman M. Diverse substrate recognition mechanisms for rhomboids; thrombomodulin is cleaved by mammalian rhomboids. Curr Biol 2004;14:236–41
- Makhmudov RM, Mamedov YaD, Dolgov VV, Repin VS. Catecholamine-mediated injury to endothelium in rabbit perfused aorta: a quantitative analysis by scanning electron microscopy. Cor Vasa 1985;27:456–63
- Martin FA, Murphy RP, Cummins PM. Thrombomodulin and the vascular endothelium: insights into functional, regulatory, and therapeutic aspects. Am J Physiol Heart Circ Physiol 2013;304:H1585–97
- Minami T, Aird WC. Endothelial cell gene regulation. Trends Cardiovasc Med 2005;15:174.e1–24
- Nakano M, Furutani M, Hiraishi S, Ishii H. Characterization of soluble thrombomodulin fragments in human urine. Thromb Haemost 1998;79:331–7
- Ohlin AK, Larsson K, Hansson M. Soluble thrombomodulin activity and soluble thrombomodulin antigen in plasma. J Thromb Haemost 2005;3:976–82
- Pakanen L, Kortelainen M, Särkioja T, Porvari K. Increased adrenaline to noradrenaline ratio is a superior indicator of antemortem hypothermia compared with separate catecholamine concentrations. J Forensic Sci 2011;56:1213–18
- Remková A, Kovácová E, Prikazská M, Kratochvil'ová H. Thrombomodulin as a marker of endothelium damage in some clinical conditions. Eur J Intern Med 2000;11:79–84
- Suzuki K, Kusumoto H, Deyashiki Y, Nishioka J, Maruyama I, Zushi M, Kawahara S, et al. Structure and expression of human thrombomodulin, a thrombin receptor on endothelium acting as a cofactor for protein C activation. EMBO J 1987;6:1891–7
- Triposkiadis F, Karayannis G, Giamouzis G, Skoularigis J, Louridas G, Butler J. The sympathetic nervous system in heart failure physiology, pathophysiology, and clinical implications. J Am Coll Cardiol 2009;54:1747–62
- Van de Wouwer M, Conway EM. Novel functions of thrombomodulin in inflammation. Crit Care Med 2004;32:S254–61
- Vihervaara A, Sistonen L. HSF1 at a glance. J Cell Sci 2014;127:261–6
- Wen DZ, Dittman WA, Ye RD, Deaven LL, Majerus PW, Sadler JE. Human thrombomodulin: complete cDNA sequence and chromosome localization of the gene. Biochemistry 1987;26:4350–7
- Wiktorowska-Owczarek A, Namiecinska M, Balcerczyk A, Nowak JZ. Human micro- and macrovessel-derived endothelial cells: a comparative study on the effects of adrenaline and a selective adenosine A2-type receptor agonist under normoxic and hypoxic conditions. Pharmacol Rep 2007;59:800–6