
Abstract
Acute stress leads to the rapid secretion of glucocorticoids, which accelerates cellular metabolism, resulting in increased reactive oxygen and nitrogen species generation. Although the nitrergic system has been implicated in numerous stress-related diseases, the time course and extent of nitrosative changes during acute stress have not been characterized. Outbred male Wistar rats were randomly allocated into control (n = 9) or 120 min acute immobilization stress (n = 9) groups. Serial blood samples were collected at 0 (baseline), 60, 90, and 120 min. Plasma corticosterone concentrations increased by approximately 350% at 60, 90, and 120 (p < 0.001) min of stress. The production of nitric oxide, measured as the benzotriazole form of 4-amino-5-methylamino-2′,7′-difluorofluorescein, increased during stress exposure by approximately 5%, 10%, and 15% at 60 (p < 0.05), 90 (p < 0.01) and 120 (p < 0.001) min, respectively, compared to controls. Nitric oxide metabolism, measured as the stable metabolites nitrite and nitrate, showed a 40–60% increase at 60, 90, and 120 (p < 0.001) min of stress. The oxidative status of 2′,7′-dichlorofluorescein in plasma was significantly elevated at 60 (p < 0.01), 90, and 120 (p < 0.001) min. A delayed decrease of approximately 25% in the glutathione redox ratio at 120 min (p < 0.001) also indicates stress-induced cellular oxidative stress. The peroxidation of plasma lipids increased by approximately 10% at 90 (p < 0.05) and 15% at 120 (p < 0.001) min, indicative of oxidative damage. It was concluded that a single episode of stress causes early and marked changes of both oxidative and nitrosative status sufficient to induce oxidative damage in peripheral tissues.
Introduction
Living organisms maintain a complex and dynamic homeostasis that is continually challenged by intrinsic and extrinsic stressors. Three discrete and dedicated systems maintain and reinstate homeostasis during stress. The autonomic nervous system (ANS) quickly responds to stress exposure through the sympathetic and parasympathetic divisions. The rapidly activated sympathetic catecholamines are responsible for generation of the “fight or flight” response in addition to potentiating the pituitary gland to subsequent hypothalamic activation (Wamsteeker & Bains, Citation2010). The hypothalamic-spinal-adrenocortical (HSA) axis modulates adrenal sensitivity to adrenocorticotropic hormone (ACTH) through a nitric oxide-mediated pathway (Jansen et al., Citation1995; Mohn et al., Citation2005; Ulrich-Lai et al., Citation2006). In addition, prolactin facilitates adrenal sensitivity to ACTH by a neural pathway that is independent of glucocorticoid-mediated negative feedback (Jaroenporn et al., Citation2009). Together, stress-induced activation of both the ANS and HSA axis prime the stress system, and subsequent activation of the hypothalamic–pituitary–adrenocortical (HPA) axis produces maximal ACTH-induced release of adrenal glucocorticoids. This results in an increase in gluconeogenesis and cellular metabolism leading to a spontaneous increase in different forms of free radicals including both reactive oxygen species (ROS) and nitrogen species (RNS) which ultimately lead to both oxidative and nitrosative stress (Liu & Zhou, Citation2012; Zhou et al., Citation2011).
The gaseous RNS, nitric oxide, is endogenously synthesized through conversion of l-arginine to l-citrulline by nitric oxide synthases or the nitrate-nitrite-nitric oxide pathway (Lundberg et al., Citation2008). Nitric oxide is involved in the regulation of many physiological processes, such as vascular tone, neurotransmission, and the immune system (Hibbs et al., Citation1988; Ignarro et al., Citation1987; Knowles et al., Citation1989). However, the pro-oxidant actions of nitric oxide cause nitrosative stress, which is defined as an increase in RNS occurring in response to the by-products formed from an oxidative challenge (Ghafourifar et al., Citation2001). A primary reaction in the production of RNS is the combination of nitric oxide and superoxide anions to form the highly reactive metabolite, peroxynitrite, a potent neurotoxin. It is now considered that nitric oxide and peroxynitrite can inhibit components of the mitochondrial respiratory chain such as cytochrome c oxidase, thereby decreasing the affinity to oxygen, potentially leading to cellular energy deficiency and ultimately cell death (Bolanos et al., Citation1994; Guidarelli et al., Citation2000). In the circulation, erythrocytes are the major scavenger of nitric oxide in which the reaction of nitric oxide with oxyhemoglobin produces the more stable metabolite nitrate and non-oxygen binding methemoglobin (Lundberg et al., Citation2008).
Assessment of total nitrite and nitrate (NOx) content in biological fluids is routinely used as an indirect estimate of nitric oxide production and metabolism in vivo. There is considerable evidence for a link between altered NOx content and neurodegenerative conditions including Alzheimer’s, Huntington’s, and Parkinson’s diseases (Boje, Citation2004). Clinical studies using peripheral measures have also demonstrated an increase in total nitrate and nitrite levels in major depression and autistic patients (Sogut et al., Citation2003; Suzuki et al., Citation2001). However, these represent changes occurring in chronic conditions, while the acute physiology of altered nitrosative status is poorly understood. We hypothesized that the production of reactive nitrogen species contributes to the acute increase in oxidative status observed following stress exposure. Therefore, in the present study, an acute immobilization stress model was used to establish the temporal profile of nitrosative changes and their involvement in the rapid onset of redox imbalance.
Methods
Experimental animals
Outbred male Wistar rats (Rattus norvegicus) aged 6–7 weeks postnatal, weighing 255.6 ± 2.82 g, were sourced from the University of Queensland Biological Resources breeding colony. Rats were housed individually under standard laboratory conditions (22 ± 2 °C; 55 ± 5% humidity) with a 12:12 h light:dark cycle (lights off at 12.30 h). Standard rat chow and water were available ad libitum. All experimental procedures were in accordance with regulations and policies outlined by The University of Queensland Animal Ethics Committee with AEC approval number SBS/363/11/URG.
Acute immobilization stress
Acute immobilization stress was applied according to a well-established protocol of Hori et al. (Citation2004). Rats were immobilized on a Perspex® board (18 × 25 cm) in the supine position using a polyester strapping and adhesive tape with their legs set at 45° to the midline. Acute immobilization stress was applied for 2 h (stress treatment started at 13:30 h) within individual home cages enclosed with a larger containment chamber (68 cm (L) × 45 cm (W) × 38.5 cm (H)) to reduce external disturbances. To isolate the effects of immobilization stress, control rats were deprived of food and water during the treatment period.
Experimental protocol
Rats were habituated to human handling for 10 min per day one week prior to experimentation. On each experimental day, rats were transported in their home cages from the colony room to an experimental room that was under low light and noise within the same animal facility. They were acclimatized to the novel experimental room for one hour and then randomly allocated to either control (n = 9) or 2 hour immobilization stress (n = 9) treatment groups. The distal 1–2 mm of the tail was clipped once only and a baseline (0 min) blood sample was collected into both ethylenediaminetetraacetic acid (EDTA)-coated Eppendorf tubes (1.5 mg mL−1 blood) and ice-chilled heparinized tubes (20 IU mL−1 blood). Subsequent collection at 60, 90, and 120 min was achieved by first gently removing clotted blood. Blood samples were each around 150 µL to guarantee that the total amount of blood collected remained under 10% of the calculated blood volume. A 2.5 µL aliquot of heparinized whole blood was used for the determination of glucose using a standard glucometer and test strips (Accu-Chek® Performa®, Roche Diagnostics Aust. Pty. Ltd., Castle Hill, Australia) and the remaining sample was centrifuged at 200 × g for 5 min. Supernatant plasma was collected and stored at −80 °C for later determination of nitric oxide production, general oxidative status, lipid peroxidation, prolactin, insulin, and corticosterone concentrations. Supernatant plasma with EDTA as anticoagulant was stored at −80 °C for measuring nitric oxide metabolism, NOx. Aliquots of heparinized erythrocytes were stored at −80 °C for later analysis of reduced and oxidized glutathione and hemoglobin. Following the final sample, rats were weighed and killed by overdose with the anesthetic sodium pentobarbital (100 mg kg−1 i.p. injection, Lethabarb, Virbac, Peakhurst, Australia).
Hormone assays
Plasma prolactin concentrations were assayed using commercially available ELISA kits (Demeditec Diagnostics, GmbH; Kiel, Germany) with a lower detection limit of 0.6 ng mL−1 according to the manufacturer’s protocols. The intra- and inter-assay coefficients of variation were 4.2% and 4.0%, respectively. Plasma corticosterone concentrations were determined in duplicate using radioimmunoassay with a minimum sensitivity of 10 pg mL−1 as described in Spiers et al. (Citation2013). A 5 µL plasma aliquot was extracted in 2 mL of glass-distilled dichloromethane. Extracts were dried under a stream of nitrogen gas and reconstituted in phosphate buffered saline (PBS; 100 mmol L−1, pH = 7.0) containing 0.1% (w/v) porcine gelatin. A 100 µL aliquot of unlabeled corticosterone standard or reconstituted sample was incubated with 100 µL of anti-rat corticosterone polyclonal antibody (Sapphire Bioscience Pty. Ltd., Waterloo, Australia) and 100 µL of [1, 2, 6, 7-3H]-corticosterone tracer and incubated overnight at 4 °C. The following day, samples were loaded with 500 µL of dextran-coated charcoal (50 mmol L−1, pH = 7.4) and centrifuged at 1000 × g for 10 min at 4 °C. Radioactivity was counted in a 100 µL aliquot of the resulting supernatant using a Liquid Scintillation Spectrometer (Tri-Carb 3100 TR, Perkin Elmer, Waltham, MA). Unknown sample concentrations were determined from a standard curve and corrected for dilution and extraction efficiency. Dichloromethane extraction efficiency was 89.6% and intra- and inter-assay coefficients of variation were 4.5% and 3.1%, respectively. Plasma insulin concentrations were measured using a commercial radioimmunoassay kit (Coat-a-Count® Insulin, Siemens Healthcare, Frimley, UK) according to the manufacturer's protocol. Assay sensitivity was 0.25 mIU L−1 with intra- and inter-assay coefficients of variation of 3.1% and 5.0%, respectively.
Hemoglobin and protein determination
Hemoglobin was determined by a modification of the cyanmethemoglobin method of Fairbanks & Klee (Citation1999) using bovine hemoglobin as a standard. Plasma protein content was determined with a commercially available RED 660TM Protein Assay (G-Biosciences, St Louis, MO) using bovine serum albumin as a standard.
Nitrosative status
The production of nitric oxide was assayed in plasma with 4-amino-5-methylamino-2′,7′-difluorofluorescein diacetate (DAF-FM DA) synthesized by Kojima et al (Citation1999). This pH-independent fluorescent dye undergoes de-acetylation by esterases to become a weakly fluorescent DAF-FM with a fluorescence quantum yield of around 0.005 (Kojima et al., Citation1999). After reacting directly with nitric oxide in the presence of molecular oxygen, the resultant benzotriazole form (DAF-FM T) shows a stable and an approximately 160-fold increase in fluorescence intensity which can be detected with excitation and emission maxima of 485 nm and 520 nm, respectively (Kojima et al., Citation1999). Briefly, a 4 µmol L−1 DAF-FM DA working solution was prepared fresh in PBS (50 mmol L−1, pH = 7.4). Frozen plasma was defrosted and a 1% (v/v) plasma suspension was prepared in PBS. Four replicates were plated on a 96-well plate containing final concentrations of 0.5% (v/v) plasma suspension and 2 µmol L−1 of DAF-FM DA under low light conditions. Plates were incubated for 60 min and sample fluorescence was measured by a POLARstar OPTIMA microplate reader (BMG Labtechnologies, Mornington, Australia). Data were corrected with corresponding protein concentrations and expressed as the percentage change in arbitrary fluorescence units relative to baseline values. The intra-assay coefficient of variation was 2.4%.
The total nitric oxide metabolites, NOx, were measured with the Griess reaction using a commercially available colorimetric assay kit (Cayman Chemical Company, Ann Arbor, MI) with a minimum sensitivity of 2.5 µmol L−1 according to the manufacturer’s instructions. Plasma samples using EDTA as an anticoagulant were ultra-filtered through a 10-kDa molecular weight cut-off filter using commercially available centrifugal devices (Pall Nanosep®, Cheltenham, Australia). Samples were corrected with corresponding protein concentrations and expressed as a percentage change from baseline values. All samples were run on the same day with an intra-assay coefficient of variation of 3.3%.
General oxidative status assay
General oxidative status in plasma was measured fluorometrically using methods modified from Spiers et al. (Citation2013). Frozen plasma was vortex-defrosted and a 1% (v/v) plasma suspension was prepared in PBS. Four replicates were plated on a 96-well plate containing final concentrations of 0.5% (v/v) plasma suspension and 100 µmol L−1 of 2′,7′-dichlorofluorescin diacetate (DCFH-DA). Sample fluorescence was measured by a POLARstar OPTIMA microplate reader (BMG Labtechnologies) with excitation and emission filters set at 485 nm and 520 nm, respectively. Data were corrected with corresponding protein concentrations in plasma and expressed as the percentage change in arbitrary fluorescence units relative to baseline values. The intra-assay coefficient of variation was 2.5%.
Reduced and oxidized glutathione assay
Reduced (GSH) and oxidized (GSSG) glutathione disulfide were measured with the fluorophore O-phthalaldehyde (OPA) using a procedure modified from Senft et al. (Citation2000). Briefly, a 50 µL aliquot of erythrocytes was suspended in 450 µL of 5% (w/v) metaphosphoric acid. The denatured protein precipitate was removed by centrifugation (2300 × g for 5 min). Aliquots of the supernatant were redox quenched with potassium phosphate buffer (1.0 M, pH = 7.0) and incubated with 20 µL of OPA (4 mg mL−1 in methanol) to specifically quantify GSH. The concentration of GSH was corrected with the non-glutathione-dependent fluorescence by a corresponding volume matched 7.5 mmol L−1 N-ethylmaleimide (NEM)-reacted sample. For the determination of GSSG, deproteinated supernatant was incubated with 20 µL of 7.5 mmol L−1 NEM for 5 min to remove GSH and redox quenched in potassium phosphate buffer. A 30 µL aliquot of 100 mmol L−1 sodium dithionite was added to one duplicate to convert GSSG to GSH. This converted GSH was measured fluorometrically following incubation with OPA. The concentration of GSSG was calculated by the difference between sodium dithionite-reacted sample and its corresponding blank using 0.1 mol L−1 potassium buffer with EDTA (KPE buffer; pH = 7.5). The OPA-derived fluorescence was measured using a POLARstar OPTIMA microplate reader (BMG Labtechnologies) with excitation and emission filters set at 365 nm and 430 nm, respectively, and sample values were determined directly from linear GSH and GSSG standard curves with a minimum sensitivity of 2.5 µmol L−1. The intra- and inter-assay coefficients of variation were 1.5% and 8.1%, respectively, for the GSH assays and 4.0% and 8.3%, respectively, for GSSG assays. Data were corrected with corresponding hemoglobin concentrations and expressed as the GSH/GSSG ratio relative to baseline values.
Lipid peroxidation in plasma
The peroxidation of lipid in plasma was determined according to the method previously described by Zavodnik et al. (Citation2002) by quantifying the production of malondialdehyde using a thiobarbituric acid reactive substances (TBARS) assay. 1,1,3,3-Tetraethoxypropane was used as an external standard for malondialdehyde (MDA) with a minimum detection sensitivity of 3.1 nmol L−1. To prevent further peroxidation during the assay, 10 µl of butylated hydroxytoluene in methanol was added into 50 µl of standards or diluted plasma. A 125 µl aliquot of 1% (w/v) thiobarbituric acid (TBA) in 0.05 mol mol L−1 sodium hydroxide solution (pH = 3.5) was added and vortexed vigorously. Following the addition of 315 µl of 20% trichloroacetic acid (w/v), the mixture was incubated in an 85 °C water bath for 30 min using glass marbles as condensers. After cooling on ice for 10 min, the colored product was extracted with n-butanol (500 µl) and the mixture was centrifuged at 1000 × g for 5 min. The extracted adduct was plated on a 96-well plate and measured fluorometrically at 544 nm (excitation) and 590 nm (emission) using a POLARstar OPTIMA microplate reader (BMG Labtechnologies). Samples were corrected for corresponding protein concentrations and expressed as the percentage change in MDA-TBA adduct formation relative to baseline values. The intra- and inter-assay coefficients of variation were 4.3% and 7.5%, respectively.
Statistics
Data were analyzed using statistical software GraphPad Prism (Version 5.0.3, GraphPad Software Inc., San Diego, CA). Two-way repeated measure ANOVAs with Bonferroni post-test were used to compare control and stress data for all time course analyses. Results were expressed as mean ± standard error of the mean (±SEM) and p values less than 0.05 were considered statistically significant.
Results
Endocrine and metabolic
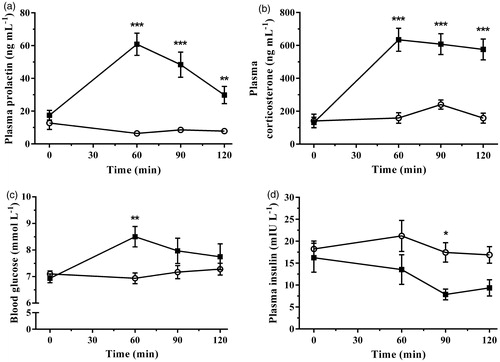
This study associated specific indicators of nitrosative activation with profiles of known endocrine and oxidative parameters following an acute immobilization stress. Plasma prolactin concentration significantly increased during immobilization stress [F(1,16) = 36.60, p < 0.0001] in a time-dependent manner [F(3,48) = 14.59, p < 0.0001]. A comparison of group means showed highly significant increases in prolactin at 60, 90, and 120 min of immobilization when compared with control concentrations (). The changes in plasma corticosterone concentration following immobilization stress are shown in . Baseline concentrations of corticosterone prior to immobilization were not significantly different between control and stress groups. Immobilization significantly increased plasma corticosterone concentration above controls [F(1,16) = 70.11, p < 0.0001] over the time-course of the experiment [F(3,48) = 16.35, p < 0.0001]. The effect of treatment over time was also significant [F(3,48) = 11.26, p < 0.0001]. Corticosterone concentrations increased approximately 150–300% above controls at 60, 90, and 120 min of immobilization while no significant differences were observed in controls. The accompanying changes in blood glucose following the onset of immobilization are illustrated in . A Two-way repeated measures ANOVA demonstrated a time-dependent effect [F(3,48) = 4.77, p = 0.005], and a significant interaction between time and stress treatment [F(3,48) = 6.74, p = 0.0007], while the main effect of stress was not significant [F(1,16) = 3.12, p = 0.097]. Post-test analysis revealed a significant increase in blood glucose concentration after 60 min following the onset of stress. Plasma insulin concentration decreased in a stress- [F(1,14) = 7.36, p = 0.017] and time-dependent [F(3,42) = 2.89, p = 0.047] manner with no significant interaction between stress and time [F(3,42) = 1.18, p = 0.33]. Post-test analysis showed a significant decrease in plasma insulin concentration following 90 min of immobilization stress exposure ().
Figure 1. The effect of acute immobilization stress on (a) plasma prolactin, (b) plasma corticosterone, (c) blood glucose, and (d) plasma insulin concentrations from control (○) and stressed (▪) rats (n = 9 per group for plasma prolactin, corticosterone, and blood glucose; n = 8 per group for plasma insulin). All measures were determined from serial blood samples collected at 0 (baseline), 60, 90, and 120 min. Data are expressed as mean ± SEM (two-way ANOVA with Bonferroni post-test, *p < 0.05, **p < 0.01, ***p < 0.001).
Nitrosative status
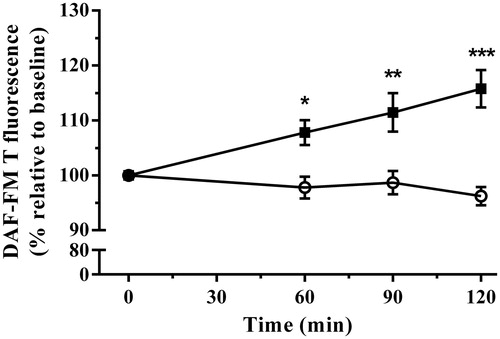
The nitrergic system forms a subgroup of reactive species, including nitric oxide, responsible for numerous important physiological functions. Following the onset of immobilization stress, there was a linear increase in nitric oxide production with a correlation coefficient of r2 = 0.99 [p < 0.001] while there was no significant change in controls (). A Two-way repeated measures ANOVA demonstrated stress treatment significantly increased nitric oxide production [F(1,16) = 15.57, p = 0.0012] over the duration of the experiment [F(3,48) = 3.32, p = 0.0274], and the interaction between stress treatment and time was also significant [F(3,48) = 8.77, p < 0.0001]. Post-test analysis showed this increase became significantly different from controls at 60, 90, and 120 min.
Figure 2. The effect of acute immobilization stress on nitric oxide production measured by the benzotriazole derivative of 4-amino-5-methylamino-2′,7′-difluorofluorescein (DAF-FM T) formation in plasma from control (○) and stressed (▪) rats (n = 9 per group). Relative DAF-FM T formation was determined from serial blood samples collected at 0 (baseline), 60, 90, and 120 min. Data are expressed as mean ± SEM (two-way ANOVA with Bonferroni post-test, *p < 0.05, **p < 0.01, ***p < 0.001).
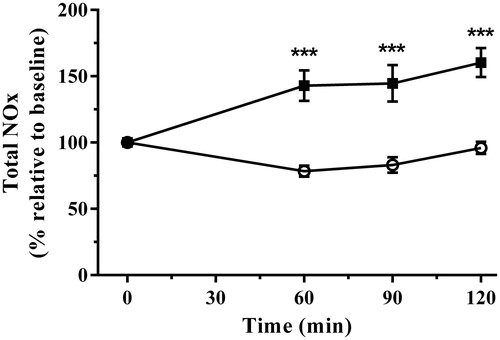
Nitric oxide metabolism, measured as the stable metabolites NOx, also demonstrated linear increases [r2 = 0.94, p < 0.05] following application of immobilization stress. NOx production increased [F(1,16) = 41.68, p < 0.0001] in a time-dependent manner [F(3,48) = 5.47, p = 0.0026] and the interaction of stress treatment and time was also highly significant [F(3,48) = 10.25, p < 0.0001]. NOx increased above controls at 60, 90, and 120 min ().
Figure 3. The effect of acute immobilization stress on total nitrite and nitrate (NOx) levels from control (○) and stressed (▪) rats (n = 9 per group). Relative total NOx was determined from serial blood samples collected at 0 (baseline), 60, 90, and 120 min. Data are expressed as mean ± SEM (two-way ANOVA with Bonferroni post-test, ***p < 0.001).
Redox status
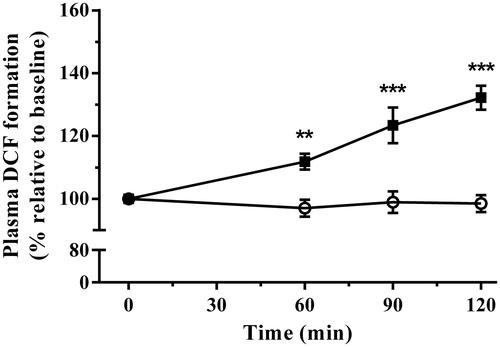
shows the changes in plasma general oxidative status following immobilization stress. Plasma oxidative status demonstrated highly significant linear increases [r2 = 0.98, p < 0.05] following exposure to immobilization [F(1,16) = 30.57, p < 0.0001] in a time-dependent manner [F(3,48) = 15.64, p < 0.0001]. The interaction between treatment and time also demonstrated significance [F(3,48) = 17.36, p < 0.0001]. Post-test analysis showed immobilization stress increased plasma oxidative status above controls at 60, 90, and 120 min ().
Figure 4. The effect of acute immobilization stress on general oxidative status measured by dichlorofluorescein (DCF) formation in plasma from control (○) and stressed (▪) rats (n = 9 per group). Relative DCF formation was determined from serial blood samples collected at 0 (baseline), 60, 90, and 120 min. Data are expressed as mean ± SEM (two-way ANOVA with Bonferroni post-test, **p < 0.01, ***p < 0.001).
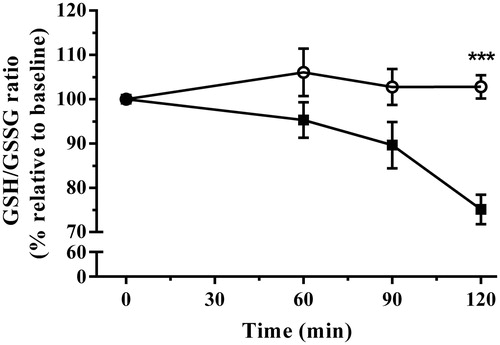
Over the duration of the experiment, concentrations of total erythrocytic GSH did not change significantly. However, application of immobilization stress increased the oxidized fraction while decreasing the reduced fraction of glutathione equivalents relative to baseline values. This resulted in delayed decreases in the ratio of GSH/GSSG from baseline, indicative of oxidative stress onset following immobilization stress [F(1,16) = 15.78, p = 0.011]. The interaction of stress with time was also significant overall [F(3,48) = 5.38, p = 0.0028]. Bonferroni post-test analysis demonstrated that this increase due to immobilization did not occur until 120 min of stress exposure ().
Figure 5. The effect of acute immobilization stress on the erythrocytic glutathione to glutathione disulfide (GSH/GSSG) ratio indicative of oxidative stress from control (○) and stressed (▪) rats (n = 9 per group). The relative ratio was determined from serial blood samples collected at 0 (baseline), 60, 90, and 120 min. Data are expressed as mean ± SEM (two-way ANOVA with Bonferroni post-test, ***p < 0.001).
Lipid peroxidation
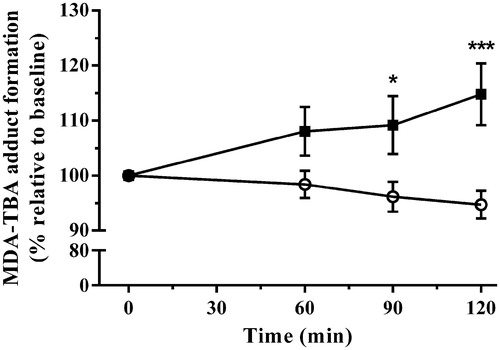
Immobilization stress effectively elevated MDA production [F(1,16) = 7.52, p = 0.0145]. The interaction of stress with time was also statistically significant [F(3,48) = 5.49, p = 0.0025]. Post-test analysis showed that this increase became significant at 90, and 120 min of stress exposure ().
Figure 6. The effect of acute immobilization stress on plasma lipid peroxidation measured by malondialdehyde-thiobarbituric acid (MDA-TBA) adduct formation from control (○) and stressed (▪) rats (n = 9 per group). Relative plasma MDA-TBA was determined from serial blood samples collected at 0 (baseline), 60, 90, and 120 min. Data are expressed as mean ± SEM (two-way ANOVA with Bonferroni post-test, *p < 0.05, ***p < 0.001).
Discussion
This study has demonstrated that alongside known hormonal parameters, acute psychological stress increases the production and metabolism of nitric oxide, likely contributing to the observed increase in the general oxidative status assay. The marked 250% increase in plasma prolactin from baseline observed at 60 min of immobilization stress is in agreement with Ren and colleagues (Citation2010). Moreover, the 350% increase in plasma corticosterone at 60 min is comparable with previous findings by Lee et al. (Citation2008) using the same stressor. Acute immobilization stress increased circulating blood glucose by approximately 25% at 60 min, which then progressively declined towards baseline. These results are supported by the findings of Sanchez et al. (Citation2002) who reported a similar initial increase in plasma glucose of tape-immobilized mice at 20 min, which significantly declined between 20 and 180 min. The decline in circulating glucose during stress noted in the present study does not seem to be insulin-dependent, as we found that stress decreased insulin concentrations. Such a reduction in plasma insulin is suggested to be adrenergic-mediated and has been demonstrated in previous reports to be accompanied by increased level of the hyperglycemic hormone glucagon (Amrani et al., Citation1994; Machado et al., Citation1995; Mioduszewski & Critchlow, Citation1982; Perez-Llamas et al., Citation1992; Yamada et al., Citation1993). The fall in blood glucose concentration in rats exposed to immobilization stress is likely a result of increased glucose utilization due to enhanced skeletal muscle activity that has been observed in this particular stress model (Sanchez et al., Citation2002).
The present study demonstrated a 7% increase in plasma nitric oxide measured by DAF-FM T formation at 60 min in response to immobilization stress, with a further linear increase to 15% at 120 min. Several experiments have utilized DAF-FM DA to assess nitric oxide dynamics, such as bioimaging intracellular nitric oxide in smooth muscle cells pretreated with various cytokines and showing a fluorescence increase following DAF-FM DA loading (Itoh et al., Citation2000). The increased fluorescence was reversed using a nitric oxide synthase inhibitor, NG-nitro-l-arginine methyl ester (L-NAME). Sicard et al. (Citation2008) measured nitric oxide with DAF-FM DA using flow cytometry as an oxidative/nitrosative stress index in blood monocytes of normal and hypertensive rats. Under these conditions, DAF-FM T fluorescence increased significantly by approximately 25% in genetically hypertensive rats compared to the normotensive strain. It has been reported that these diaminofluorescein probes react specifically with nitric oxide without interacting with the metabolites, nitrite and nitrate, or other ROS and RNS including superoxide, hydrogen peroxide, and peroxynitrite (Kojima et al., Citation1998). It was later confirmed that both DAF-FM and the diacetate form is pH-insensitive above pH 5.5 and more photostable and sensitive for nitric oxide than DAF-2 and DAF-2 DA (Freitas et al., Citation2009; Itoh et al., Citation2000; Kojima et al., Citation1999). Balcerczyk et al. (Citation2005) reported an induction of DAF-FM fluorescence using various peroxynitrite concentrations. However, this was limited to less than one fluorescent unit in the diacetate form even in the presence of supra-physiological concentrations of peroxynitrite. Moreover, DAF-FM DA fluorescence induced by peroxynitrite is 300 times less than DAF-FM at similar peroxynitrite concentrations. In a recent study, the sensitivity of DAF-FM DA was examined by incubating plant tissue with the nitric oxide donor or scavenger, sodium nitroprusside (SNP) and 2-(4-carboxyphenyl)-4,4,5,5-tetramethylimidazoline-1-oxyl-3-oxide (cPTIO) respectively (Kolbert et al., Citation2012). Incubation with SNP significantly increased fluorescence intensity of DAF-FM T over all concentrations tested. However, this SNP-induced increase was abolished by co-incubation with cPTIO. No change was observed in DAF-FM T fluorescence when tissues were incubated with increasing concentrations of hydrogen peroxide. Based on these studies, it can be concluded that DAF-FM DA is specific for nitric oxide as long as precaution is taken to limit photobleaching. The present study and previous reported observations demonstrate that DAF-FM DA is a reliable indicator of nitric oxide in biological samples. However, to validate this stress-induced increase in nitric oxide, this study utilized the conventional method of assessing the stable metabolites, NOx.
Immobilization stress induced an increase in nitric oxide metabolites by approximately 40–60% from baseline over the duration of stress exposure. The magnitude of changes in NOx is in the range reported in blood from patients suffering major depression, suicidal ideation, and autism (Lee et al., Citation2006; Sogut et al., Citation2003; Suzuki et al., Citation2001). The significance of this comparison lies in the link between increased nitric oxide and release of the excitatory amino acid glutamate in the central nervous system (Segieth et al., Citation1995). It is a common observation in stress models that glutamate release is enhanced while glial-mediated glutamate cycling is reduced, leading to altered synaptic transmission in limbic and cortical areas (Yuen et al., Citation2009). Although the underlying mechanisms between stress and the nitrergic system remain unclear, a number of studies have demonstrated that various inhibitors of nitric oxide synthase possess anxiolytic- and antidepressant-like properties (Joca & Guimaraes, 2006; Volke et al., 2003; Zhang et al., 2010). Interestingly, Zhang et al. (2010) demonstrated that the selective serotonin type 1A receptor agonist 8-hydroxy-2-(di-n-propylamino)tetralin (8-OH-DPAT) and the selective serotonin reuptake inhibitor fluoxetine reduce neuronal nitric oxide synthase protein expression in the hippocampus and reduce anxiety-like behaviors. Furthermore, knock out mice lacking neuronal nitric oxide synthase also demonstrated a reduction in anxiety-like behavior and were no longer sensitive to serotonin agonists or uptake inhibitors. A follow-up study revealed that chronic mild stress and glucocorticoid exposure lead to hippocampal neuronal nitric oxide synthase overexpression (Zhou et al., Citation2011). This increase in neuronal nitric oxide synthase-derived nitric oxide caused the downregulation of hippocampal glucocorticoid receptor expression, ultimately leading to depressive-like behavior in mice.
In addition to changes in central nervous system activity, persistent increases in nitric oxide lead to cellular damage directly, or by interaction with superoxide, leading to the formation of peroxynitrite radicals. Damage via protein carbonyl formation and lipid peroxidation has been shown in erythrocytes and neural tissues following exposure to different stressors (Sahin et al., Citation2004; Sahin & Gumuslu, Citation2007). In the present study, oxidative status increased by approximately 30% at 120 min of immobilization stress. Increases in GSH oxidation to GSSG is expected to follow increases in cellular oxidative status, as was evident in our data after 120 min of stress exposure. This coincided with increased plasma malondialdehyde production, a widely accepted general indicator of oxidative damage. Liu et al. (Citation1994) demonstrated a significant increase in plasma lipid peroxidation using similar methods following 6 h of immobilization stress which could be reversed by reduced glutathione treatment, implicating directly the causative role of oxidative damage.
By showing changes in the oxidative and nitrosative systems, and linking these to indices of cellular oxidative damage, the present study has confirmed the involvement of RNS in the rapid redox response to stress. Together with ROS, these likely contribute to the depletion of the cellular glutathione ratio and increase in markers of lipid peroxidation. The time domain and recovery of these physiological changes following stress exposure is an important consideration for future studies utilizing oxidative measures in peripheral blood. Furthermore, the mechanistic link between stress exposure, glucocorticoids, and increased nitric oxide production will need to be elucidated in both blood and tissues.
Declaration of interest
The authors declare no competing financial interests.
This work was supported by a University of Queensland Research Grant. This funding body had no further role in the study design; in the collection, analysis and interpretation of data; in the writing of the report; and in the decision to submit the paper for publication.
Acknowledgements
We would like to thank Ms Kerri Tyrrell for her technical assistance and the animal technicians from the University of Queensland Biological Resources animal house.
Related Research Data
References
- Amrani A, Chaouloff F, Mormede P, Dardenne M, Homo-Delarche F. (1994). Glucose, insulin, and open field responses to immobilization in nonobese diabetic (NOD) mice. Physiol Behav 56:241–6
- Balcerczyk A, Soszynski M, Bartosz G. (2005). On the specificity of 4-amino-5-methylamino-2′,7′-difluorofluorescein as a probe for nitric oxide. Free Radic Biol Med 39:327–35
- Boje KM. (2004). Nitric oxide neurotoxicity in neurodegenerative diseases. Front Biosci 9:763–76
- Bolanos JP, Peuchen S, Heales SJ, Land JM, Clark JB. (1994). Nitric oxide-mediated inhibition of the mitochondrial respiratory chain in cultured astrocytes. J Neurochem 63:910–16
- Fairbanks SW, Klee GG. (1999). Biochemical aspects of hematology. In: Burtis CA, Ashwood ER, editors. Tietz textbook of clinical chemistry. 3rd ed. Philadelphia: WB Saunders. p 1673–4
- Freitas M, Lima JL, Fernandes E. (2009). Optical probes for detection and quantification of neutrophils' oxidative burst: a review. Anal Chim Acta 649:8–23
- Ghafourifar P, Bringold U, Klein SD, Richter C. (2001). Mitochondrial nitric oxide synthase, oxidative stress and apoptosis. Biol Signals Recept 10:57–65
- Guidarelli A, Tommasini I, Fiorani M, Cantoni O. (2000). Essential role of the mitochondrial respiratory chain in peroxynitrite-induced strand scission of genomic DNA. IUBMB Life 50:195–201
- Hibbs JB, Jr Taintor RR, Vavrin Z, Rachlin EM. (1988). Nitric oxide: a cytotoxic activated macrophage effector molecule. Biochem Biophys Res Commun 157:87–94
- Hori N, Yuyama N, Tamura K. (2004). Biting suppresses stress-induced expression of corticotropin-releasing factor (CRF) in the rat hypothalamus. J Dent Res 83:124–8
- Ignarro LJ, Buga GM, Wood KS, Byrns RE, Chaudhuri G. (1987). Endothelium-derived relaxing factor produced and released from artery and vein is nitric oxide. Proc Natl Acad Sci USA 84:9265–9
- Itoh Y, Ma FH, Hoshi H, Oka M, Noda K, Ukai Y, Kojima H, et al. (2000). Determination and bioimaging method for nitric oxide in biological specimens by diaminofluorescein fluorometry. Anal Biochem 287:203–9
- Jansen AS, Nguyen XV, Karpitskiy V, Mettenleiter TC, Loewy AD. (1995). Central command neurons of the sympathetic nervous system: basis of the fight-or-flight response. Science 270:644–6
- Jaroenporn S, Nagaoka K, Ohta R, Shirota M, Watanabe G, Taya K. (2009). Differences in adrenocortical secretory and gene expression responses to stimulation in vitro by ACTH or prolactin between high- and low-avoidance Hatano rats. Stress 12:22–9
- Joca SR, Guimaraes FS. (2006). Inhibition of neuronal nitric oxide synthase in the rat hippocampus induces antidepressant-like effects. Psychopharmacology (Berl) 185:298–305
- Knowles RG, Palacios M, Palmer RM, Moncada S. (1989). Formation of nitric oxide from L-arginine in the central nervous system: a transduction mechanism for stimulation of the soluble guanylate cyclase. Proc Natl Acad Sci USA 86:5159–62
- Kojima H, Nakatsubo N, Kikuchi K, Kawahara S, Kirino Y, Nagoshi H, Hirata Y, Nagano T. (1998). Detection and imaging of nitric oxide with novel fluorescent indicators: diaminofluoresceins. Anal Chem 70:2446–53
- Kojima H, Urano Y, Kikuchi K, Higuchi T, Hirata Y, Nagano T. (1999). Fluorescent indicators for imaging nitric oxide production. Angew Chem Int Ed Engl 38:3209–12
- Kolbert Z, Petô A, Lehotai N, Feigl G, Ördög A, Erdei L. (2012). In vivo and in vitro studies on fluorophore-specificity. Acta Biol Szegediensis 56:37–41
- Lee BH, Lee SW, Yoon D, Lee HJ, Yang JC, Shim SH, Kim DH, et al. (2006). Increased plasma nitric oxide metabolites in suicide attempters. Neuropsychobiology 53:127–32
- Lee T, Saruta J, Sasaguri K, Sato S, Tsukinoki K. (2008). Allowing animals to bite reverses the effects of immobilization stress on hippocampal neurotrophin expression. Brain Res 1195:43–9
- Liu JK, Wang XY, Mori A. (1994). Immobilization stress-induced antioxidant defense changes in rat plasma: effect of treatment with reduced glutathione. Int J Biochem 26:511–17
- Liu W, Zhou C. (2012). Corticosterone reduces brain mitochondrial function and expression of mitofusin, BDNF in depression-like rodents regardless of exercise preconditioning. Psychoneuroendocrinology 37:1057–70
- Lundberg JO, Weitzberg E, Gladwin MT. (2008). The nitrate-nitrite-nitric oxide pathway in physiology and therapeutics. Nat Rev Drug Discov 7:156–67
- Machado LJ, Marubayashi U, Reis AM, Coimbra CC. (1995). Effect of [1-Sar,8-Thr]-angiotensin II on the hyperglycemic response to hemorrhage in adrenodemedullated and guanethidine-treated rats. Regul Pept 60:69–77
- Mioduszewski R, Critchlow V. (1982). Forebrain structures which mediate the effects of stress on prolactin and growth hormone secretion in the rat. Endocrinology 110:1972–6
- Mohn CE, Fernandez-Solari J, De Laurentiis A, Prestifilippo JP, de la Cal C, Funk R, Bornstein SR, et al. (2005). The rapid release of corticosterone from the adrenal induced by ACTH is mediated by nitric oxide acting by prostaglandin E2. Proc Natl Acad Sci USA 102:6213–18
- Perez-Llamas F, Zamora S, Rosique MJ, Sastre JF. (1992). Effects of inhalation of ethyl-ether on glycemia and on some variables of intermediate metabolism in rats. Arch Int Physiol Biochim Biophys 100:335–7
- Ren L, Li X, Weng Q, Trisomboon H, Yamamoto T, Pan L, Watanabe G, Taya K. (2010). Effects of acute restraint stress on sperm motility and secretion of pituitary, adrenocortical and gonadal hormones in adult male rats. J Vet Med Sci 72:1501–6
- Sahin E, Gumuslu S. (2007). Stress-dependent induction of protein oxidation, lipid peroxidation and anti-oxidants in peripheral tissues of rats: comparison of three stress models (immobilization, cold and immobilization-cold). Clin Exp Pharmacol Physiol 34:425–31
- Sahin E, Gumuslu S, Ozturk O, Abidin I, Yargicoglu P, Agar A. (2004). Marked changes in erythrocyte antioxidants and lipid peroxidation levels of rats exposed to acute, repeated and chronic restraint stress. Pharmazie 59:961–4
- Sanchez O, Arnau A, Pareja M, Poch E, Ramirez I, Soley M. (2002). Acute stress-induced tissue injury in mice: differences between emotional and social stress. Cell Stress Chaperones 7:36–46
- Segieth J, Getting SJ, Biggs CS, Whitton PS. (1995). Nitric oxide regulates excitatory amino acid release in a biphasic manner in freely moving rats. Neurosci Lett 200:101–4
- Senft AP, Dalton TP, Shertzer HG. (2000). Determining glutathione and glutathione disulfide using the fluorescence probe o-phthalaldehyde. Anal Biochem 280:80–6
- Sicard P, Delemasure S, Korandji C, Segueira-Le Grand A, Lauzier B, Guilland J-C, Duvillard L, Zeller M, et al. (2008). Anti-hypertensive effects of Rosuvastatin are associated with decreased inflammation and oxidative stress markers in hypertensive rats. Free Radic Res 42:226–36
- Sogut S, Zoroglu SS, Ozyurt H, Yilmaz HR, Ozugurlu F, Sivasli E, Yetkin O, et al. (2003). Changes in nitric oxide levels and antioxidant enzyme activities may have a role in the pathophysiological mechanisms involved in autism. Clin Chim Acta 331:111–17
- Spiers JG, Chen HJ, Bradley AJ, Anderson ST, Sernia C, Lavidis NA. (2013). Acute restraint stress induces rapid and prolonged changes in erythrocyte and hippocampal redox status. Psychoneuroendocrinology 38:2511–19
- Suzuki E, Yagi G, Nakaki T, Kanba S, Asai M. (2001). Elevated plasma nitrate levels in depressive states. J Affect Disord 63:221–4
- Ulrich-Lai YM, Arnhold MM, Engeland WC. (2006). Adrenal splanchnic innervation contributes to the diurnal rhythm of plasma corticosterone in rats by modulating adrenal sensitivity to ACTH. Am J Physiol Regul Integr Comp Physiol 290:R1128–35
- Volke V, Wegener G, Bourin M, Vasar E. (2003). Antidepressant- and anxiolytic-like effects of selective neuronal NOS inhibitor 1-(2-trifluoromethylphenyl)-imidazole in mice. Behav Brain Res 140:141–7
- Wamsteeker JI, Bains JS. (2010). A synaptocentric view of the neuroendocrine response to stress. Eur J Neurosci 32:2011–21
- Yamada F, Inoue S, Saitoh T, Tanaka K, Satoh S, Takamura Y. (1993). Glucoregulatory hormones in the immobilization stress-induced increase of plasma glucose in fasted and fed rats. Endocrinology 132:2199–205
- Yuen EY, Liu W, Karatsoreos IN, Feng J, McEwen BS, Yan Z. (2009). Acute stress enhances glutamatergic transmission in prefrontal cortex and facilitates working memory. Proc Natl Acad Sci USA 106:14075–9
- Zavodnik IB, Zavodnik LB, Bryszewska MJ. (2002). The mechanism of Zn-phthalocyanine photosensitized lysis of human erythrocytes. J Photochem Photobiol B 67:1–10
- Zhang J, Huang XY, Ye ML, Luo CX, Wu HY, Hu Y, Zhou QG, et al. (2010). Neuronal nitric oxide synthase alteration accounts for the role of 5-HT1A receptor in modulating anxiety-related behaviors. J Neurosci 30:2433–41
- Zhou QG, Zhu LJ, Chen C, Wu HY, Luo CX, Chang L, Zhu DY. (2011). Hippocampal neuronal nitric oxide synthase mediates the stress-related depressive behaviors of glucocorticoids by downregulating glucocorticoid receptor. J Neurosci 31:7579–90