
Abstract
Postnatal stress alters stress responses for life, with serious consequences on the central nervous system (CNS), involving glutamatergic neurotransmission and development of voluntary alcohol intake. Several drugs of abuse, including alcohol and cocaine, alter glutamate transport (GluT). Here, we evaluated effects of chronic postnatal stress (CPS) on alcohol intake and brain glutamate uptake and transporters in male adolescent Wistar rats. For CPS from postnatal day (PD) 7, pups were separated from their mothers and exposed to cold stress (4 °C) for 1 h daily for 20 days; controls remained with their mothers. Then they were exposed to either voluntary ethanol (6%) or dextrose (1%) intake for 7 days (5–7 rats per group), then killed. CPS: (1) increased voluntary ethanol intake, (2) did not affect body weight gain or produce signs of toxicity with alcohol exposure, (3) increased glutamate uptake by hippocampal synaptosomes in vitro and (4) reduced protein levels (Western measurements) in hippocampus and frontal cortex of glial glutamate transporter-1 (GLT-1) and excitatory amino-acid transporter-3 (EAAT-3) but increased glutamate aspartate transporter (GLAST) levels. We propose that CPS-induced decrements in GLT-1 and EAAT-3 expression levels are opposed by activation of a compensatory mechanism to prevent excitotoxicity. A greater role for GLAST in total glutamate uptake to prevent enlarged extracellular glutamate levels is inferred. Although CPS strongly increased intake of ethanol, this had little impact on effects of CPS on brain glutamate uptake or transporters. However, the impact of early life adverse events on glutamatergic neurotransmission may underlie increased alcohol consumption in adulthood.
Introduction
Adverse early life events constitute a major risk factor for the development of mental disorders. Moreover, they may also increase an individual's vulnerability to substance abuse later in adult life (Fumagalli et al., Citation2007). Manipulations such as maternal separation (MS) have been used as an animal model of early-life traumatic experience (Lehmann & Feldon, Citation2000). Different experimental protocols of MS in rats have shown alterations in central nervous system (CNS) functioning: learning impediments, drug abuse and other behavioral changes (Pryce et al., Citation2005; Sanders & Spears, Citation2007).
Drugs of abuse cause long-term changes in the CNS (Jain & Balhara, Citation2010; Nestler, Citation2002). Alcohol is used as a social drug and it is the second most widely consumed psychoactive substance in the world after caffeine (Melchior et al., Citation2014). Ethanol affects the activities of many receptors, ion channels, carrier proteins and protein kinases in the CNS (Harris et al., Citation2008). In regard to glutamate transmission, ethanol inhibits N-methyl-d-aspartic acid (aspartate) (NMDA)-receptor activation (Smothers & Woodward, Citation2006) and interacts with glutamate uptake (Othman et al., Citation2002).
Glutamate is the major excitatory amino acid in the mammalian CNS, being implicated in several physiological processes. Termination of excitatory activity is mediated by high-affinity Na+-dependent glutamate transporters (GluTs), principally located in glial cells surrounding synapses and in post-synaptic neurons. A family of Na+-dependent transporters is of prominent importance for glutamate uptake and for regulating homeostasis in the CNS (Balcar, Citation2002; Thomas et al., Citation2011). To date, five high-affinity GluTs have been cloned from human and animal tissues, and they are identified as glutamate aspartate transporter (GLAST), excitatory amino-acid transporter-1 (EAAT-1) (Storck et al., Citation1992), glial glutamate transporter-1 (GLT-1 and EAAT-2) (Pines et al., Citation1992), excitatory amino-acid carrier-1 (EAAC-1 and EAAT-3) (Kanai & Hediger, Citation1992), EAAT-4 (Fairman et al., Citation1995) and EAAT-5 (Arriza et al., Citation1997). Unlike other neurotransmitters, glutamate is not metabolized in the synaptic cleft (Kanai et al., Citation1993). The primary means by which it is removed from the synapse is by GluTs, including GLAST and GLT-1 (EAAT2) (Anderson & Swanson, Citation2000). Evidence indicates that chronic alcohol exposure not only leads to functional increases in glutamate output but also to impaired function of GluTs.
Knowing that aversive events in early life can induce drug abuse, we were interested to study the effects of postnatal stress on voluntary ethanol intake to obtain a model of voluntary intake induced by stress in order to study the mechanisms involved in this relationship. There is evidence that the frontal cortex (FC) and hippocampus are involved in regulating the hypothalamic–pituitary–adrenocortical (HPA) axis and are vulnerable to effects of stress. The hippocampus is an anatomical structure responsible for diverse memory processes (Kessels et al., Citation2001) and is particularly sensitive to chronic stress and to glucocorticoids (Conrad, Citation2008). The FC is directly linked to reward systems (dopaminergic projections of the ventral tegmental area (VTA) (Kalivas, Citation2009). It has been demonstrated that ethanol regulates neuronal GluT expression in vitro (Kim et al., Citation2005), and that GluT expression is downregulated in the cortex of alcohol preferring rats (Schreiber & Freund, Citation2000). We aimed to analyze glutamate uptake and GluT expression in the FC and hippocampus in a voluntary ethanol intake animal model, using young adult rats exposed to chronic postnatal stress (CPS) and their controls. We hypothesized that CPS increases ethanol intake and alters glutamatergic transmission.
Methods
Animals
Pregnant Wistar rats were obtained from the School of Pharmacy and Biochemistry, University of Buenos Aires. All the rats were maintained under standard laboratory conditions (12 h light–dark schedule, lights on from 08:00 to 20:00 h, temperature: 21 ± 2 °C) with food and water ad libitum. The pregnant rats were housed three per cage. All the animal procedures were performed in accordance with the Guide on Care and Use of Laboratory Animals, US National Research Council, 1996 and approved (Res. CD N°2962/10) by the Institutional Committee for care and use of laboratory animals (CICUAL), School of Medicine, University of Buenos Aires. All the efforts were made to minimize animal suffering. The rats were weighed and general health assessed weekly.
Chronic postnatal stress
The MS procedure was based on a standardized protocol (Ogawa et al., Citation1994), with slight modifications. Whole litters were randomly assigned to one of two rearing conditions: prolonged MS or non-MS (control). For MS litters, dams were removed from the home cage and placed in an adjacent cage. The whole litter was left in the home cage at 4 °C in a cold room with the light on for 1 h during 20 days from postnatal day (PD) 7 (Ladd et al., Citation1996; Odeon et al., Citation2010, Citation2013) (day of birth was designated PD1). No mortality was observed with this procedure. Rat pups are capable of behavioral thermoregulation as early as the first week of postnatal life, and can produce heat metabolically without shivering (Farrell & Alberts, Citation2007).
The separation cages contained abundant 3 cm deep bedding material so that pups could thermoregulate by contact with littermates and by burrowing into the bedding. Under such conditions, pup core temperature is maintained, indicating effective behavioral and physiological thermoregulation (Farrell & Alberts, Citation2007). After 1 h, the mother was returned to the home cage. Separations were carried out between 10:00 and 11:00 h. Except for routine cage cleaning, the control litters remained with the dams undisturbed until weaning age at PD22. Such a group is considered the most appropriate control for MS studies (Lehmann & Feldon, Citation2000). After weaning, rats were housed by sex in standard cages and conditions. At PD27, male pups were selected for the next experiments described here. All the rats were handled daily by the same investigator to minimize stress reactions to manipulation. Unrelated rats were used to avoid confounding litter effects (each experimental group was made up of rats from at least 3 l).
Stress treatment across 20 days began at PD7. At PD27, they were exposed to either voluntary ethanol (6%) or dextrose (1%) intake as well as plain water for 7 days. For this part of the study, three rats were housed per cage, with six to seven cages per experimental group.
The rats had free access to the drinking bottles, as in the two-bottle free choice method (Crabbe et al., Citation2011). At the end of 7 days with free access to ethanol or dextrose, the rats were killed. The age of the rats at this point was 34 days ().
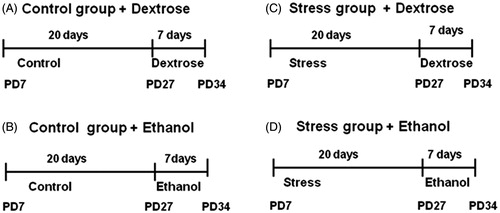
Figure 1. Experimental design. Postnatal stress or no disturbance (Control) from postnatal days (PD) 7–27. From PD 27–34 given to drink either: water, and dextrose: 1% solution (g/100 ml); or water, and ethanol: 6% solution (g/100 ml).
Determination of hepatic transaminases
We assessed liver function through measurement of plasma levels of transaminase activities (AST, aspartate aminotransfere and ALT, alanine aminotransferase) by a routine spectrometric assay. Enzymatic transamination consists of the enzyme catalyzed reversible transfer of the alpha amino nitrogen of an amino acid to an alpha-keto acid with the synthesis of a second amino acid and a second alpha-keto acid. Enzymes catalyzing different transamination reactions are found widely distributed in animal tissues and have been shown to change in activity in some tissues during disease (Karmen et al., Citation1995).
Following decapitation without anesthesia, blood was collected from the trunk in a 15-ml conical tube with heparin. Plasma was separated by centrifugation (3000 g, 15 min, 4 °C) and frozen at −70 °C.
Glutamate uptake
Preparation of tissue
Rats were decapitated without anesthesia, and the brains were removed from five to six rats in each group. FC and hippocampus were dissected on a Petri dish at 0 °C, according to Glowinski & Iversen (Citation1966) and homogenized with a glass-PTFE homogenizer in 20 vols of 0.32 M sucrose. Homogenates were centrifuged at 800 g for 15 min at 4 °C, the supernatant was then centrifuged at 20,000 g for 20 min at 4 °C. The pellet (P2 = crude synaptosomal fraction) was suspended with a glass-PTFE homogenizer in fresh 0.32 M sucrose and again centrifuged at 20,000 g for 20 min at 4 °C. This procedure was repeated 3 times. The resulting pellet was resuspended and the suspension was used in uptake experiments within 5 h of preparation. Measurements were made separately on the preparations from each rat (Odeon et al., Citation2010, Citation2013; Takarada et al., Citation2003).
Tissue measurements
Uptake experiments were carried out using fresh synaptosome-enriched fractions from 20 mg of the original tissue (wet weight) per 1 ml of incubation medium. This consisted of 125 mM NaCl, 3.5 mM KCl, 1.5 mM CaCl2, 1.2 mM MgSO4, 1.25 mM KH2PO4, 25 mM NaHCO3, 10 mM HEPES and 10 mM d-glucose, pH adjusted to 7.4. The tissue (FC or hippocampus) was first incubated for 5 min at 30 °C, (as described by Takarada et al., Citation2003), followed by addition of pure 10 nM radiolabeled substrate, [3H]-l-glutamate (specific activity: 46.9 Ci/mmol, from Perkin Elmer, NEN, Life Science Inc., Boston, MA), without addition of non-radiolabeled substrate, followed by incubation for 1–30 min, for time-course studies. The incubation was ended by vacuum filtration through Whatman glass fiber filters (type D) and three rapid washes with isotonic saline solution (at 2–4 °C). The radioactivity on the filter was measured using liquid scintillation counting. Parallel experiments were always performed without any incubation to obtain radioactivity that was not specifically taken up into brain preparations. Using the known specific activity, the net uptake of [3H]-l-glutamate by the synaptosomes was calculated and expressed as fmol/mg protein/min. All the measurements were made in triplicate. Protein content was estimated by the Lowry technique (Lowry et al., Citation1951) using bovine serum albumin as standard.
Inhibition experiments were performed in the presence of 500 μM dihydrokainate (DHK, Tocris Bioscence) which was added to the membranes immediately before the 5-min [3H]-glutamate uptake measurement (Guillet et al., Citation2002). The assay was performed in all the groups with and without inhibitor and the percentage of inhibition as the difference in uptake was calculated.
Western blotting
This analysis was used to measure levels of GLT-1, GLAST and EAAT-3 protein expression in hippocampus and FC. Dissected tissues were homogenized with a glass-PTFE homogenizer in lysis buffer containing Tris Base 50 mM, NaCl 150 mM, EDTA 2 mM, sodium dodecyl sulfate (SDS) 0.05%, Triton X-100 1%, phenylmethanesulfonyl fluoride (PMSF) 100 g/ml and leupeptin 1 μg/ml. The homogenates were centrifuged at 12,000 g for 5 min at 4 °C. An aliquot from the supernatant was taken for protein determination by the Lowry technique (Lowry et al., Citation1951). Aliquots (total proteins 20 μg) were separated on 12% SDS–polyacrylamide gel (SDS–PAGE) at 130 V and transferred to a nitrocellulose membrane using a blot system (Transblot, BioRad). FC and hippocampus preparations from each rat were run separately. The membranes were incubated in blocking buffer (1 × Tris-buffered saline (TBS) and 5% non-fat dry milk) for 1 h at room temperature (RT) and then incubated overnight at 4 °C with one of the following specific primary antibodies: guinea pig anti-GLT-1(1/500) (AB1520, Millipore Chemicon), rabbit anti-actin (1/1000) (A2066, Sigma Chemical), rabbit anti GLAST (1/500) (AB1783, Millipore Chemicon) or rabbit anti-EAAC1 (1/500) (sc-25658, Santa Cruz Biotechnology). Blots were then washed 3 times for 10 min in 1 × TBS with 0.3% Tween-20 (TBST) at RT and then incubated for 1 h at RT with goat anti rabbit IgG (1/2000) (Santa Cruz Biotechnology) or goat anti-guinea pig (1/2000) (Santa Cruz Biotechnology) conjugated to horseradish peroxidase. They were then washed 3 times for 10 min in 1 × TBS-T 0.1% at RT. Inmunodetection of bands was accomplished using the Pierce Super Signal Chemiluminescence Kit (Kit-ECL, Western blotting substrate from Pierce, Thermo Scientific IL) and exposure on X-ray film. For quantification of band intensity, blots were scanned and analyzed using Image J PC software analysis. The expression level corresponds to the number of black pixels of each band. The results were expressed as optical density (OD) in arbitrary units. Actin was used as a loading control. The amount of protein was expressed as a ratio between the protein and actin.
Statistical analysis
All data are expressed as mean ± standard error of the mean (SEM). Statistical significance was assessed with two-way analysis of variance (ANOVA) followed by post hoc Tukey test, except for alcohol intake data, which were analyzed by Student's t-test. Each group comprised six rats. Each rat in a group came from a different cage. Significance was set at p < 0.05.
Results
Body weight gain
The general state of the rats were monitored, and the rats exposed to CPS were in good general condition, as judged by appearance of the coat and posture. The body weights of the rats were not significantly different (two-way ANOVA, F3,25 = 0.3477, p = 0.911) among the experimental groups throughout the experiment. Percent body weight gains in the last week were: control: 46.3 ± 2.54% (body weight: 110 ± 7.16 g, n = 10), control + EtOH: 46.0 ± 2.35% (body weight: 109 ± 5.56 g, n = 10), stress: 49.2 ± 1.98% (body weight: 92.4 ± 6.06 g, n = 10) and stress + EtOH: 50.4 ± 2.20% (body weight: 105.2 ± 20.8 g, n = 10).
Ethanol intake
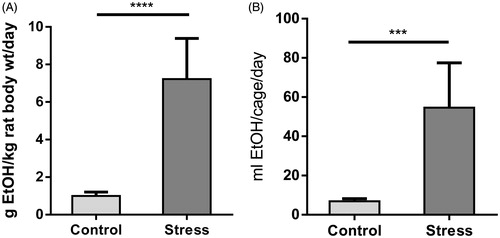
The data in show ethanol consumption as g/kg rat body weight/day and in shows the volume of 6% ethanol intake per cage of three rats per day. In the CPS group, compared with non-stressed controls, there were significant increases in the estimated amount ingested each day (g/kg rat body weight/day) (t = 7.58, df = 12) and in ethanol intake volume per cage of three rats, (t = 5.54, df = 12). We did not find any significant differences in dextrose intake (data not shown).
Figure 2. Ethanol intake. (A) Voluntary ethanol expressed in grams of ethanol (EtOH) consumed/kg body weight/day. (B) Indicates volume of 6% ethanol intake per cage (of three rats) per day. Values are the mean ± SEM for seven cages. t-test, ****p < 0.0001, ***p < 0.01.
Hepatic transaminases
Aspartate aminotransferase (AST) and alanine aminotransferase (ALT) activities were measured and the ratio AST/ALT used as an indicator of liver damage was calculated. No significant differences (F3, 22 = 0.404, p = 0.75) were found among the different groups. The ratios of AST/ALT activities were: control: 1.02 ± 0.06, control + EtOH: 1.03 ± 0.08, stress: 0.7 ± 0.05 and stress + EtOH: 0.9 ± 0.05 (n = 4).
Glutamate uptake by FC and hippocampal synaptosemes
We measured Na+-dependent uptake of [3H]-l-glutamate by FC and hippocampus synaptosomes (). Time-course experiments verified that glutamate uptake was essentially linear up to 5 min at the respective incubation temperature (30 °C). In all the cases, uptake reached a plateau by ∼10 min. There was a significant increase in glutamate uptake in the CPS groups: in hippocampus (at 2 min: F3,15 = 16.17, p = 0.001; at 3 min: F3,15 = 10.81, p = 0.001; at 5 min: F3,15 = 7.27, p = 0.004 and at 10 min: F3,15 = 5.25, p = 0.01) and FC (at 10 min: F3,15 = 5.68, p = 0.01 and at 30 min: F3,15 = 5.26, p = 0.02) as compared to the respective control groups. We found a more pronounced increase in glutamate uptake in hippocampus in the CPS groups ().
Figure 3. Time course of [3H]-l-glutamate uptake in fresh synaptosome-enriched fractions of frontal cortex (FC) and hippocampus (Hic). Samples were incubated with [3H]-l-glutamate at 10 nmol/l substrate concentrations, for 1–30 min. Values are the mean ± SEM (n = 5–6 rats per group), all the experiments were done in triplicate. Control, no postnatal stress; stress, chronic postnatal stress; dex, water and 1% dextrose to drink; EtOH, water and 6% ethanol to drink. Two-way ANOVA with repeated measures, *p < 0.05, **p < 0.01, ***p < 0.001.
![Figure 3. Time course of [3H]-l-glutamate uptake in fresh synaptosome-enriched fractions of frontal cortex (FC) and hippocampus (Hic). Samples were incubated with [3H]-l-glutamate at 10 nmol/l substrate concentrations, for 1–30 min. Values are the mean ± SEM (n = 5–6 rats per group), all the experiments were done in triplicate. Control, no postnatal stress; stress, chronic postnatal stress; dex, water and 1% dextrose to drink; EtOH, water and 6% ethanol to drink. Two-way ANOVA with repeated measures, *p < 0.05, **p < 0.01, ***p < 0.001.](/cms/asset/d97dc7f0-ed26-4f81-9cec-eadb039dd15b/ists_a_1041909_f0003_b.jpg)
The GLT-1-specific blocker, DHK (500 μM), inhibited glutamate uptake by both the FC and hippocampal synaptosomes (). However, the percentage inhibition of GluT in the hippocampal (but not FC) preparations was significantly greater in the stressed groups than in the control groups (F3,15 = 7.53, p = 0.043).
Figure 4. Effect of glial glutamate transporter-1 (GLT-1) inhibitor dihydrokainate (DHK, 500 mM) on 5 min [3H]-l-glutamate uptake. Fresh synaptosome-enriched fractions from frontal cortex (FC) and hippocampus (Hic). Values are the percentage of inhibition, calculated as the difference in uptake with and without inhibitor (n = 5–6 rats per group) all the experiments were done in triplicate. Values are mean + SEM. Two-way ANOVA and main effects, *p < 0.05.
![Figure 4. Effect of glial glutamate transporter-1 (GLT-1) inhibitor dihydrokainate (DHK, 500 mM) on 5 min [3H]-l-glutamate uptake. Fresh synaptosome-enriched fractions from frontal cortex (FC) and hippocampus (Hic). Values are the percentage of inhibition, calculated as the difference in uptake with and without inhibitor (n = 5–6 rats per group) all the experiments were done in triplicate. Values are mean + SEM. Two-way ANOVA and main effects, *p < 0.05.](/cms/asset/5b71465d-7b62-4965-8d20-59491617680d/ists_a_1041909_f0004_b.jpg)
Western-blot analysis of glutamate transporters in FC and hippocampus
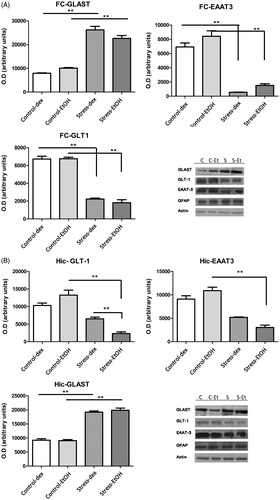
The Western blots revealed that the homogenates include GLT-1, GLAST and EAAT-3 proteins (). Single bands were seen in homogenates at 88, 69 and 61 kDa for EAAT-3, GLT-1 and GLAST, respectively. The levels of expression of both GLT-1 and EAAT-3 were decreased in the hippocampus (F3,15 = 30.92, p = 0.001; F3,15 = 39.33, p = 0.001) and FC (F3,15 = 116.1, p = 0.0001; F3,15 = 63.94, p = 0.0001) in the CPS groups compared with their respective control groups. In hippocampus, there was a more pronounced decrease of GLT-1 in the group that consumed ethanol (27% in stressed group versus 74% in stress-ethanol group with respect to control group). Conversely, GLAST expression increased in the hippocampus (F3,15 = 117.5, p = 0.001) and the FC (F3,15 = 87.25, p = 0.001). In all the samples run, glial fibrillary acidic protein (GFAP) was found and there were no significant differences among the different groups (data not shown). Hence the samples obtained from brain homogenates contained a glial fraction and the amount was not modified by treatment.
Figure 5. Western-blot analysis for glutamate transporter proteins. Measurements were made on glutamate aspartate transporter (GLAST; MW ∼66 kDa), glial glutamate transporter-1 (GLT1; MW ∼52 kDa) and excitatory amino-acid transporter-3 (EAAT3; MW ∼57 kDa) in homogenates of frontal cortex, FC (A) and hippocampus, Hic (B). Band densities were quantified and are shown as a bar chart (OD: optical density). The expression level corresponds to the number of black pixels of each band counted using Image J. Actin (MW ∼42 kDa) served as a loading control. Glial fibrillary acidic protein (GFAP; MW ∼49 kDa) served as a glial marker. Blots are representative of three experimental groups for each blot. Control (C), no postnatal stress; stress (S), chronic postnatal stress; dex, water and 1% dextrose to drink; EtOH, water and 6% ethanol to drink. The FC and hippocampus from each rat was run separately. Data are mean ± SEM (n = 5 rats per group). Two-way ANOVA and main effects, *p < 0.05, **p < 0.01.
Discussion
The present results provide evidence that both ethanol intake and activity and protein expression of GluTs in certain areas of the rat brain are affected by CPS. The main findings of this study are as follows: (1) CPS increased voluntary ethanol intake, (2) CPS did not modify activity of hepatic transaminases in plasma, and body weight increase was not affected by treatment, (3) CPS increased glutamate uptake in FC and hippocampal synaptosomes and (4) in the FC and hippocampus, CPS reduced both GLT-1 and EAAT-3 protein expression, and increased GLAST protein level.
The finding that in our experimental model of early life stress voluntary alcohol intake was increased in adolescent/adult male rats, establishes an experimental protocol to study early environmental influence on behavior and neurochemistry. Also, body weight gain was not affected by treatments, thus indicating that CPS in this model did not reduce food intake and growth, while the rats otherwise appeared healthy (Niemelä & Alatalo, Citation2010).
As CPS did not modify circulating levels of hepatic transaminases, this argues against the possibility that alcohol intake might have a toxic effect which would be evidenced by hepatic injury. Transaminase levels are reliable markers of hepatocellular necrosis. Alcohol abuse is but one of many causes of increased plasma transaminase levels (Giannini et al., Citation2005). In the present type of experiment, we did not find changes in levels of transaminases (Nyblom et al., Citation2004). AST is a cytosolic enzyme found in high concentrations in the liver, which is relatively specific for this organ. However, hepatocellular injury and cell death do not necessarily trigger the release of these enzymes into the circulation. ALT is less specific and less sensitive as an indicator of liver damage.
A number of animal models have been developed that make it possible not only to observe the effects of specific social circumstances on alcohol intake (McBride & Li, Citation1998) but also to evaluate the involvement of particular neural or genetic factors (Anacker & Ryabinin, Citation2010). Wistar rats are commonly used in studies of alcohol drinking and, in appropriate circumstances; they exhibit high ethanol preference and intake (Simms et al., Citation2008). These rats may be referred to as a standard, outbred strain of rats and their alcohol preference is within the range observed in other outbred rodent strains. A study in Fawn-Hooded rats by Lodge & Lawrence (Citation2003) demonstrated that activation of the HPA axis was important for the observed ethanol preference in stressed rats. The early postnatal period and the bond between mother and infant seem essential in the development and shaping of normal stress responses and emotional behavior (Ellenbroek & Cools, Citation2000; Pryce et al., Citation2005; Robinson, Citation1998). In our experiments, we found that control groups exposed to CPS and offered voluntary dextrose in a two-bottle choice procedure did not show altered dextrose consumption. Studies using other models of early life stress similarly indicate that these models selectively increase ethanol intake without altering the consumption of sweetened solutions (McCool & Chappell, Citation2009).
Social isolation has been used extensively as an animal model to investigate the impact of early life social deficits on brain and behavior. There is a critical period during which social isolation has the most profound and often irreversible effects. Emerging evidence indicates that many aspects of alcohol and drug dependence involve changes in glutamate transmission. A number of studies have reported that drugs of abuse, including alcohol and cocaine (Chappell et al., Citation2013), alter GluT (Rao & Sari, Citation2012). Smith & Navratilova (Citation1999) found that the effects of ethanol on glutamate transport may be mediated in part, by the level of Ca2+/calmodulin kinase activity in astrocytes. Similarly, Othman et al. (Citation2002) indicated that in rat cortical astrocytes in vitro ethanol affects [3H]-l-glutamate uptake by affecting protein kinase C (PKC) modulation of transporter activity.
We also found changes following CPS in the glutamatergic system. These could be an effect of glucocorticoid. It is known that this hormone may regulate GluT expression (Danbolt, Citation2001) and ethanol intake (Costin et al., Citation2013). The net effect is observed in the increased glutamate uptake, however protein levels of the main transporters, both glial (GLT-1) and the neuronal (EAAT-3) transporters, were decreased. Importantly, the third transporter that was analyzed, GLAST, which is present in glia (Balcar, Citation2002), located in both the FC and hippocampus, showed increased protein expression levels after the CPS treatment. It might be that the decreased expression of the major uptake proteins for glutamate and the possible excitotoxic consequence could trigger a compensatory mechanism through the increase in GLAST that was seen. There is extensive evidence for a differential regulation of the expression of GLT-1 and GLAST (Danbolt, Citation2001; Gegelashvili et al., Citation2000; Schlag et al., Citation1998). Inhibitors of GluTs are a crucial tool for elucidating the physiological roles of these transporters in detail. It would also be important to work with specific inhibitors of GluT-mediated uptake in order to better understand the functioning of the system and the effects of treatment. We made experiments with the compound DHK, a selective inhibitor of GLT-1 (Arriza et al., Citation1994; Bernardinelli & Chatton, Citation2008) and saw a significant diminution of glutamate uptake in synaptosomes from both the FC and hippocampus. Notably, the percentage inhibition of uptake when GLT-1 was blocked was reduced in the CPS groups. This leads us to infer that the proportion of re-uptake of glutamate by GLT-1 was lower in the CPS-treated groups. Thus, it is possible that the role of GLAST in these rats was greater than in controls in accordance with the increment in GLAST protein expression levels. Thus, the decrease in the percentage inhibition by DHK could explain the increase in uptake, despite the decrease in GLT-1 and EAAT-3 protein expression. GLT-1 and GLAST are often described as the glial-specific GluT, while GLT-1 accounts for > 90% of the total glutamate uptake, and it is an essential contributor to GluT homeostatic roles, as well as EAAT-3 that has been found predominantly in neurons.
In summary, we found that CPS induced a decrement in GLT-1 and EAAT-3 protein expression levels in the FC and hippocampus. The changes in the glutamatergic system include a greater role for GLAST in total glutamate uptake with a significant increase in GLAST protein expression levels, leading to increased glutamate uptake, as seen, and preventing enhanced extracellular glutamate levels. The finding that CPS altered glutamate regulation in the FC and hippocampus and increased voluntary alcohol intake indicates a possible role for altered glutamate regulation in the causal relationship between early life stress and drug abuse (Pautassi et al., Citation2010; Sommer & Saavedra, Citation2008). This requires testing in further studies.
Declaration of interest
This work was supported by grants: UBACTY No. 2002-0100100323 from the University of Buenos Aires and PIP No. 114-2009-0100118 from National Scientific and Technologic Research Council (CONICET) to G.B.A. G.B.A. is member of CONICET. The authors report no conflicts of interest. The authors alone are responsible for the content and writing of the article.
References
- Anacker AM, Ryabinin AE. (2010). Biological contribution to social influences on alcohol drinking: evidence from animal models. Int J Environ Res Public Health 7(2):473–93
- Anderson CM, Swanson RA. (2000). Astrocyte glutamate transport: review of properties, regulation, and physiological functions. Glia 32(1):1–14
- Arriza JL, Eliasof S, Kavanaugh MP, Amara SG. (1997). Excitatory amino acid transporter 5, a retinal glutamate transporter coupled to a chloride conductance. Proc Natl Acad Sci USA 94(8):4155–60
- Arriza JL, Fairman WA, Wadiche JI, Murdoch GH, Kavanaugh MP, Amara SG. (1994). Functional comparisons of three glutamate transporter subtypes cloned from human motor cortex. J Neurosci 14(9):5559–69
- Balcar VJ. (2002). Molecular pharmacology of the Na+ dependent transport of acidic amino acids in the mammalian central nervous system. Biol Pharm Bull 25(3):291–301
- Bernardinelli Y, Chatton JY. (2008). Differential effects of glutamate transporter inhibitors on the global electrophysiological response of astrocytes to neuronal stimulation. Brain Res 1240:47–53
- Chappell AM, Carter E, McCool BA, Weiner JL. (2013). Adolescent rearing conditions influence the relationship between initial anxiety-like behavior and ethanol drinking in male Long-Evans rats. Alcohol Clin Exp Res 37(Suppl 1):E394–403
- Conrad CD. (2008). Chronic stress-induced hippocampal vulnerability: the glucocorticoid vulnerability hypothesis. Rev Neurosci 19(6):395–411
- Costin BN, Wolen AR, Fitting S, Shelton KL, Miles MF. (2013). Role of adrenal glucocorticoid signaling in prefrontal cortex gene expression and acute behavioral responses to ethanol. Alcohol Clin Exp Res 37(1):57–66
- Crabbe JC, Spence SE, Brown LL, Metten P. (2011). Alcohol preference drinking in a mouse line selectively bred for high drinking in the dark. Alcohol 45(5):427–40
- Danbolt NC. (2001). Glutamate uptake. Prog Neurobiol 65(1):1–105
- Ellenbroek BA, Cools AR. (2000). The long-term effects of maternal deprivation depend on the genetic background. Neuropsychopharmacology 23(1):99–106
- Fairman WA, Vandenberg RJ, Arriza JL, Kavanaugh MP, Amara SG. (1995). An excitatory amino-acid transporter with properties of a ligand-gated chloride channel. Nature 375(6532):599–603
- Farrell WJ, Alberts JR. (2007). Rat behavioral thermoregulation integrates with nonshivering thermogenesis during postnatal development. Behav Neurosci 121(6):1333–41
- Fumagalli F, Molteni R, Racagni G, Riva MA. (2007). Stress during development: impact on neuroplasticity and relevance to psychopathology. Prog Neurobiol 81(4):197–217
- Gegelashvili G, Dehnes Y, Danbolt NC, Schousboe A. (2000). The high-affinity glutamate transporters GLT1, GLAST, and EAAT4 are regulated via different signalling mechanisms. Neurochem Intern 37(2–3):163–70
- Giannini EG, Testa R, Savarino V. (2005). Liver enzyme alteration: a guide for clinicians. CMAJ 172(3):367–79
- Glowinski J, Iversen LL. (1966). Regional studies of catecholamines in rat brain. I. The disposition of [3H]-Noradrenaline, [3H]-Dopamine and [3H]-DOPAC in various regions of the brain. J Neurochem 13(8):665–9
- Guillet B, Lortet S, Masmejean F, Samuel D, Nieoullon A, Pisano P. (2002). Developmental expression and activity of high affinity Glutamate transporters in rat cortical primary cultures. Neurochem Int 40(7):661–71
- Harris RA, Trudell JR, Mihic SJ. (2008). Ethanol's molecular targets. Sci Signal 1(28):re7
- Jain R, Balhara YP. (2010). Impact of alcohol and substance abuse on adolescent brain: a preclinical perspective. Indian J Physiol Pharmacol 54(3):213–34
- Kalivas PW. (2009). The glutamate homeostasis hypothesis of addiction. Nat Rev Neurosci 10(8):561–72
- Kanai Y, Hediger MA. (1992). Primary structure and functional characterization of a high-affinity glutamate transporter. Nature 360(6403):467–71
- Kanai Y, Smith CP, Hediger MA. (1993). The elusive transporters with a high affinity for glutamate. Trends Neurosci 6(9):365–70
- Karmen A, Wróblewski F, LaDue JS. (1995). Transaminase activity in human blood. J Clin Invest 34(1):126–33
- Kessels RP, de Haan EH, Kappelle LJ, Postma A. (2001). Varieties of human spatial memory: a meta-analysis on the effects of hippocampal lesions. Brain Res Brain Res Rev 35:295–303
- Kim JH, Do SH, Kim YL, Zuo Z. (2005). Effects of chronic exposure to ethanol on glutamate transporter EAAT3 expressed in Xenopus oocytes: evidence for protein kinase C involvement. Alcohol Clin Exp Res 29(11):2046–52
- Ladd CO, Owens MJ, Nemeroff CB. (1996). Persistent changes in corticotrophin-releasing factor neuronal systems induced by maternal deprivation. Endocrinology 137(4):1212–18
- Lehmann J, Feldon J. (2000). Long-term biobehavioral effects of maternal separation in the rat: consistent or confusing? Rev Neurosci 11(4):383–408
- Lodge DJ, Lawrence AJ. (2003). The CRF1 receptor antagonist antalarmin reduces volitional ethanol consumption in isolation-reared fawn-hooded rats. Neuroscience 117(2):243–7
- Lowry OH, Rosebrough NJ, Farr AI. (1951). Protein measurement with the folin phenol reagent. J Biol Chem 193(1):265–75
- McBride WJ, Li TK. (1998). Animal models of alcoholism: neurobiology of high alcohol-drinking behavior in rodents. Crit Rev Neurobiol 12(4):339–69
- McCool BA, Chappell AM. (2009). Early social isolation in male Long-Evans rats alters both appetitive and consummatory behaviors expressed during operant ethanol self-administration. Alcohol Clin Exp Res 33(2):273–82
- Melchior M, Prokofyeva E, Younès N, Surkan PJ, Martins SS. (2014). Treatment for illegal drug use disorders: the role of comorbid mood and anxiety disorders. BMC Psychiatry 14:89–98
- Nestler EJ. (2002). From neurobiology to treatment: progress against addiction. Nat Neurosci 5(Suppl):1076–9
- Niemelä O, Alatalo P. (2010). Biomarkers of alcohol consumption and related liver disease. Scand J Clin Lab Invest 70(5):305–12
- Nyblom H, Berggren U, Balldin J, Olsson R. (2004). High AST/ALT ratio may indicate advanced alcoholic liver disease rather than heavy drinking. Alcohol Alcohol 39(4):336–9
- Odeon MM, Salatino AE, Acosta GB. (2013). Consequences of postnatal stress: maternal separation in rats induces long-lasting changes on glutamate transporters. Clin Exp Pharmacol 3:121–5
- Odeon MM, Salatino AE, Rodríguez CB, Scolari MJ, Acosta GB. (2010). The response to postnatal stress: amino acids transporters and PKC activity. Neurochem Res 35(7):967–75
- Ogawa T, Mikuni M, Kuroda K, Muneoka K, Mori KJ, Takahashi K. (1994). Periodic maternal deprivation alters stress response in adult offspring: potentiates the negative feedback regulation of restraint stress-induced adrenocortical response and reduces the frequencies open field-induced behaviors. Pharmacol Biochem Behav 49:961–7
- Othman T, Sinclair CJ, Haughey N, Geiger JD, Parkinson FE. (2002). Ethanol alters glutamate but not adenosine uptake in rat astrocytes: evidence for protein kinase C involvement. Neurochem Res 27(4):289–96
- Pautassi RM, Camarini R, Quadros IM, Miczek KA, Israel Y. (2010). Genetic and environmental influences on ethanol consumption: perspectives from preclinical research. Alcohol Clin Exp Res 34(6):976–87
- Pines G, Danbolt NC, Bjoras M, Zhang Y, Bendahan A, Eide L, Koepsell H, et al. (1992). Cloning and expression of a rat brain L-Glutamate transporter. Nature 360(6403):464–7
- Pryce CR, Rüedi-Bettschen D, Dettling AC, Weston A, Russig H, Ferger B, Feldon J. (2005). Long-term effects of early-life environmental manipulations in rodents and primates: potential animal in depression research. Neurosci Biobehav Rev 29(4–5):649–74
- Sanders S, Spear NE. (2007). Ethanol acceptance is high during early infancy and becomes still higher after previous ethanol ingestion. Alcohol Clin Exp Res 31(7):1148–58
- Rao PSS, Sari Y. (2012). Glutamate Transporter 1: target for the treatment of alcohol dependence. Curr Med Chem 19:5148–56
- Robinson MB. (1998). The family of sodium dependent glutamate transporters: a focus on the GLT-1/TGLUS2 subtype. Neurochem Int 33(6):479–91
- Schlag BD, Vondrasek JR, Munir M, Kalandadze A, Zelenaia OA, Rothstein JD, Robinson MB. (1998). Regulation of the glial Na-dependent glutamate transporters by cyclic AMP analogs and neurons. Mol Pharmacol 53:355–69
- Schreiber R, Freund WD. (2000). Glutamate transport is downregulated in the cerebral cortex of alcohol-preferring rats. Med Sci Monit 6(4):649–52
- Simms JA, Steensland P, Medina B, Abernathy KE, Chandler LJ, Wise R, Bartlett SE. (2008). Intermittent access to 20% ethanol induces high ethanol consumption in Long-Evans and Wistar rats. Alcohol Clin Exp Res 32(10):1816–23
- Smith TL, Navratilova E. (1999). Increased calcium/calmodulin protein kinase activity in astrocytes chronically exposed to ethanol: influences on glutamate transport. Neurosci Lett 269(3):145–8
- Smothers CT, Woodward JJ. (2006). Effects of amino acid substitutions in transmembrane domains of the NR1 subunit on the ethanol inhibition of recombinant N-methyl-D-aspartate receptors. Alcohol Clin Exp Res 30(3):523–30
- Sommer WH, Saavedra JM. (2008). Targeting brain angiotensin and corticotrophin-releasing hormone systems interaction for the treatment of mood and alcohol use disorders. J Mol Med 86(6):723–8
- Storck T, Schulte S, Hofmann K, Stoffel W. (1992). Structure, expression, and functional analysis of a Na(+)-dependent Glutamate/Aspartate transporter from rat brain. Proc Natl Acad Sci USA 89(22):10955–9
- Takarada T, Balcar VJ, Baba K, Takamoto A, Acosta GB, Takano K, Yoneda Y. (2003). Uptake of [3H]L-serine in rat brain synaptosomal fractions. Brain Res 983(1–2):36–47
- Thomas CG, Tian H, Diamond JS. (2011). The relative roles of diffusion and uptake in clearing synaptically released glutamate change during early postnatal development. J Neurosci 31(12):4743–54