
Abstract
Early-life stress affects metabolic outcomes and choice of diet influences the development of metabolic disease. Here we tested the hypothesis that chronic sugar intake exacerbates metabolic deficits induced by early-life stress. Early-life stress was induced in Sprague–Dawley rats using limited nesting material in early lactation (LN, postnatal days 2–9), and siblings were given chow alone or with additional sucrose post weaning (n = 9–17 per group). Female control and LN siblings had unlimited access to either chow plus water, or chow and water plus 25% sucrose solution (Sucrose), from 3–15 weeks of age. Weekly body weight and food intake were measured. Glucose and insulin tolerance were tested at 13 and 14 weeks of age, respectively. Rats were killed at 15 weeks. Hepatic triglyceride and markers of lipid synthesis – fatty acid synthase, acetyl-CoA carboxylase alpha and oxidation – and peroxisome proliferator-activated receptor gamma coactivator 1-alpha (Pgc-1α) were examined. Mediators of hepatic glucocorticoid metabolism, specifically 11-beta hydroxysteroid dehydrogenase-1 (11βHSD-1), 5-α reductase, and glucocorticoid and mineralocorticoid receptor mRNAs were also measured. Sucrose increased caloric intake in both groups, but overall energy intake was not altered by LN exposure. LN exposure had no further impact on sucrose-induced glucose intolerance and increased plasma and liver triglycerides. Hepatic markers of fat synthesis and oxidation were concomitantly activated and 11βHSD-1 mRNA expression was increased by 53% in LN-Sucrose versus Con-Sucrose rats. Adiposity was increased by 26% in LN-Sucrose versus Con-Sucrose rats. Thus, LN exposure had minimal adverse metabolic effects despite high-sugar diet postweaning.
Introduction
Early-life stress during critical developmental periods is causally linked to adverse mental health outcomes including anxiety-, depression- and addiction-like behaviors (Beesdo et al., Citation2009; Calabrese et al., Citation2009). Early adversity is associated with dysregulated hypothalamic–pituitary–adrenal (HPA) axis activity (Heim & Nemeroff, Citation2001), and increased corticosterone responses to stressors (Maniam & Morris, Citation2010b). However, anxiety and depression are associated with eating disorders including bingeing and this has been implicated in the development of obesity (Grucza et al., Citation2007; Maniam & Morris, Citation2012; Polivy et al., Citation1994). Both human and experimental studies show that consumption of diets rich in sugar is associated with increased risk of dyslipidaemia, hepatic lipid accumulation, insulin resistance, and hyperglycemia (Bray, Citation2013; Ferramosca et al., Citation2014; Johnson et al., Citation2013; Sheludiakova et al., Citation2012). Recent human data showed that chronic stress in combination with a high-sugar and high-fat diet increased visceral fat accumulation, and induced insulin resistance compared to nonstressed controls consuming the same diet (Aschbacher et al., Citation2014).
We previously showed that rats exposed to early-life stress, who were then offered a cafeteria diet high in sugar and fat postweaning, were less anxious than littermates who consumed chow (Maniam & Morris, Citation2010b). Increased consumption of palatable foods, commonly high in sugar and fat, in response to stress has been suggested to be a form of self-medication, also known as “comfort” eating (Adam & Epel, Citation2007; Laugero et al., Citation2001; Tomiyama et al., Citation2011). In our hands, the cafeteria diet, however, appeared to exacerbate the metabolic risk of rats subjected to early-life stress, with a doubling of insulin concentrations compared to control rats consuming the same diet (Maniam & Morris, Citation2010a,Citationb). Recent work also demonstrated that rats exposed to early-life stress showed a preference for palatable food during later exposure to chronic stress (Machado et al., Citation2013). The issue of whether early-life adversity contributes to later metabolic health outcomes is controversial (Maniam et al., Citation2014) with evidence for both improved and worsened metabolic disease risk. On balance, however, evidence suggests that depending on diet and lifestyle, the risk for disease is modified (Maniam et al., Citation2014). Despite this, limited work has systematically examined the metabolic consequences of early-life stress (Maniam et al., Citation2014) and the underlying mechanism(s) of any metabolic consequences reported so far are unclear. In this study, we sought to examine whether the diet consumed following early-life stress affects risk of metabolic disease.
There are several mechanisms that may mediate stress-related impact on metabolic disturbances, such as altered insulin/glucose tolerance and hepatic lipid accumulation. In rodents, chronic stress during adulthood has been shown to alter insulin metabolism and glucose utilization pathways (Sadeghimahalli et al., Citation2015; Uchida et al., Citation2012). Despite there being some evidence showing functional changes in insulin sensitivity following early adversity (Kaufman et al., Citation2007), the molecular and protein changes in peripheral tissues related to glucose and insulin homeostasis are unknown. As muscle is a key tissue in glucose and insulin metabolism. In this article, key mediators of insulin signaling and glucose utilization markers were examined.
Glucocorticoids have an important role in lipid homeostasis in different physiological states, where elevated glucocorticoid exposure can lead to lipid disorders including dyslipidemia and fatty liver (Arnaldi et al., Citation2010; Macfarlane et al., Citation2008). While early-life stress is known to activate the HPA axis, leading to hypersecretion of glucocorticoids (Heim & Nemeroff, Citation2001; Maniam & Morris, Citation2010b; Maniam et al., Citation2014), the implications for intracellular glucocorticoid concentrations in peripheral tissues are unknown. 11-beta hydroxysteroid dehydrogenase-1 (11βHSD-1) is a critical regulator of intracellular glucocorticoid concentrations in peripheral tissues, particularly in liver, driving the conversion of inactive to active cortisol (Tomlinson et al., Citation2004). Accumulating clinical evidence shows a link between abnormal glucocorticoid metabolism and aspects of the metabolic syndrome such as insulin/glucose intolerance and hepatic lipid accumulation (Andrew et al., Citation2002). Given that energy metabolism is affected by both circulating and tissue glucocorticoids, here we examined whether early-life stress alters mediators of liver glucocorticoid metabolism and whether this is associated with lipid profile changes induced by early-life stress and the consumption of sucrose.
With the increase in sugar consumption in the general population, it is likely that early-life stress and consumption of sugary foods may co-exist, thus understanding the consequences of a high-sugar diet following early-life stress is critical. This study is the first to examine the interaction between early-life stress and high-sugar diet in an animal model. As chronic sugar consumption disrupts glucose/insulin metabolism, and is a known risk factor for lipid accumulation in plasma and liver; this project aimed to expand understanding of the consequences of stress during the early postnatal period on the metabolic response to a poor diet such as one with high sucrose content. Thus the study aims to shed light on whether early-life stress modifies the vulnerability or resilience to metabolic disease in later life.
We modeled early-life stress in female rats using a paradigm in which the dams are given limited nesting material (LN) in early lactation, and tested the hypothesis that exposure to early-life stress induced by LN exacerbates metabolic derangements induced by chronic sucrose consumption, particularly altered body composition, glucose/insulin intolerance and plasma and hepatic lipid dysregulation. As women are reported to have higher risk for metabolic disorders following early-life stress exposure (Mason et al., Citation2013; Zheng et al., Citation2012), here we examined female offspring.
Methods
Animals
All animal procedures were approved by the Animal Care and Ethics Committee of UNSW Australia. Male and female Sprague–Dawley rats (Animal Resource Centre, Perth, WA, Australia) were maintained in a temperature (21–23 °C) and humidity (50–70%) controlled colony room on a 12 h light/12 h dark cycle (lights on at 07:00 h) with ad libitum access to standard laboratory chow and water. Mating was carried out in house with 1 male:4 females in a cage. Once pregnancy was confirmed based on 30% weight increase, pregnant dams were housed singly. Pups found at 09:00 h were designated as postnatal day (PND) 1 and those found at 17:00 h in the afternoon were designated as PND 0.
Litters comprising 9–15 pups were included and standardized to 12 pups per litter on PND 1 using pups from dams littering on the same day to minimize alterations in maternal behavior and pup nutrition. Litters were housed with the dam in polypropylene cages (20 × 32 × 19 cm) on wood shavings with a metal lid. On PND 2, litters were assigned to either normal bedding (control) or LN. The LN paradigm involved fitting a metal base with drilled holes to the cage, which was raised slightly to allow urine and droppings to escape. Rats in the LN group were provided with a single piece of paper towel as bedding material. Both groups were left undisturbed between PND 2 and 9, following which LN dams received normal bedding material until weaning. Data shown are from 9 to 17 female offspring per experimental group depending on the measure, from 8 LN and 7 control dams.
Postweaning diet
At PND 21, female pups were weaned and housed 3–4 rats/cage. Female offspring were assigned to either standard laboratory chow (11 kJ/g energy; 12% fat, 21% protein, 65% carbohydrate, Gordon’s Specialty Stockfeeds, NSW, Australia) and access to two water bottles or chow and access to one bottle containing sucrose (25% w/vol, 16.2 kJ/g) and one water bottle. Chow, water and sucrose were available ad libitum. This generated 4 groups: Control + Water (Con); Control + Sucrose (Con-Sucrose); LN + Water (LN) and LN + Sucrose (LN-Sucrose). Rats were weighed at weaning and at regular intervals throughout the study. Food and fluid intake over 24 h was recorded at regular intervals by weighing food and bottles before presentation to the rats and again after 24 h. Average energy intake per cage was calculated based on supplier's information for chow and for sucrose, amount of sucrose intake per day (g) × 16.2 kJ/g. The number of cages per experimental group was 3–4.
Intraperitoneal glucose tolerance test
Female offspring underwent an intraperitoneal (i.p.) glucose tolerance test at 13 weeks of age. Rats were fasted overnight and a baseline blood glucose concentration was measured from tail blood (Accu-Chek, Roche Diagnostics, Sydney, NSW, Australia). The sensitivity of the Accu-Chek meter is 0.6 mmol/L. The intra-assay variability was <5%. The rats were administered glucose (50% glucose, 2 g/kg i.p. n = 9–13 per group) and blood glucose concentrations were measured at 15, 30, 45, 60, 90 and 120 min postinjection. Blood samples were collected from an initial cut over a lateral tail vein at baseline and again, after removal of the formed scab, at 15, 30, 45, 60, 90 and 120 min. Approximately 300 μL (total of 1.5 mL over 2 h per 300 g body weight) blood were collected into ethylenediamine tetraacetic acid (EDTA) coated tubes and maintained at 4 °C until centrifuged. Blood collection began at 09:00 h. The area under the curve (AUC) of blood glucose concentrations was calculated for each rat.
Intraperitoneal insulin tolerance test
An i.p. insulin tolerance test was carried out at 14 weeks of age after fasting for 6 h. Baseline glucose level was measured (Accu-Chek); rats were administered insulin (Actrapid, Novo Nordisk (100 IU/mL); 1 U/kg, n = 9–13 per group) and blood samples were obtained as above at 15, 30, 45, 60, 90 and 120 min for measurement of glucose concentrations.
Insulin sensitivity index
Insulin sensitivity also was calculated on samples from rats that underwent a glucose tolerance test by the quantitative insulin sensitivity check index (QUICKI). QUICKI = 1/[log(I) + log(G)] where I is the fasting plasma insulin concentration and G is the fasting glucose concentration (Katz et al., Citation2000).
Terminal sample collection
At 15 weeks of age, after 16 h fasting, rats were anaesthetized by ketamine/xylazine injection (ketamine: 100 mg/mL, xylazine: 20 mg/mL, dose: 100/15 mg/kg i.p.). Body weight was measured. Rats were decapitated and trunk blood was collected in a tube containing ethylenediamine tetraacetic acid (EDTA; 0.1 mL, 65 mg/mL) and plasma separated by centrifugation (9677 g, 23 °C, 10 min) and stored at −20 °C for subsequent determination of insulin and triglyceride concentrations. The liver was dissected, weighed and snap frozen in liquid nitrogen and stored at −80 °C for subsequent mRNA and protein analysis. Epididymal white adipose tissue (WAT), retroperitoneal WAT, and visceral WAT and muscle (soleus and gastrocnemius) were dissected and weighed.
Hormone and lipid assays
Plasma insulin concentration was measured using a commercial ELISA kit (Millipore, Sydney, NSW, Australia) according to the manufacturer's instructions. For insulin, the sensitivity of the assay was 0.2 ng/mL. The intra-assay variability was <10%. Prior to liver triacylglycerol analysis, tissue was homogenized using a chloroform–methanol mixture with a Precellys 24 homogenizer (Sapphire Bioscience, Sydney, NSW, Australia) using a modified method described elsewhere (Folch et al., Citation1957). The homogenate was transferred into glass tubes which were vortexed and placed on a roller mixer overnight. The next day, 2 mL of 0.6% NaCl was added and centrifuged (10,000 g, 10 min, room temperature 23 °C). The entire lower organic phase was extracted into new glass tubes and evaporated under nitrogen gas in a heating block at 40 °C for 30 min. The dried extract was dissolved in absolute ethanol. Plasma and liver triglyceride contents were determined using a colorimetric assay kit (Roche Diagnostics) with density measured on a BioRad iMark plate reader (BioRad, Sydney, NSW, Australia).
Immunoblotting
Whole tissue lysates from powdered liver were prepared using a Precellys 24 homogenizer (Sapphire Bioscience, Sydney, NSW, Australia) in radioimmunoprecipitation assay buffer (RIPA) buffer containing 65 mM Tris (pH 7.4), 150 mM NaCl, 5 mM EDTA, 1% Nonidet P-40, 0.5% sodium deoxycholate, 0.1% sodium dodecyl sulfate (SDS), 10% glycerol, 1 μg/mL aprotinin, 1 μg/mL leupeptin, 10 mM sodium fluoride, 1 mM sodium orthovanadate (Na3VO4) and 1 mM phenylmethanesulfonylfluoride or phenylmethylsulfonyl fluoride (PMSF) according to methods described elsewhere (Hoy et al., Citation2007). The liver tissue homogenate was then incubated for 2 h at 4 °C and then centrifuged at 10,000 g for 15 min to remove insoluble material. Protein concentration was determined by Bradford protein assay (Bio-Rad) using bovine serum albumin (BSA) as standard. Proteins were resolved by sodium dodecyl sulfate polyacrylamide gel electrophoresis (SDS-PAGE) electrophoresis on a 4–15% polyacrylamide gel (BioRad) and transferred to a polyvinylidene difluoride (PVDF) membrane. Nonspecific binding sites were blocked in Tris-buffered saline with 4% bovine serum albumin and 0.1% Tween-20 for 1 h at room temperature. Membranes were incubated on a roller at 4 °C overnight with the following primary antibody dilutions: anti-fatty acid synthase (cell signaling; 1:1000), anti-Pgc-1α (Millipore; 1:1000) followed by anti-rabbit IgG horse radish peroxidase (HRP)-linked antibody (cell signaling; 1:10,000); and anti-14-3-3 (Millipore; 1:1000) followed by anti-mouse IgG HRP-linked antibody (cell signaling; 1:10,000). After washing in Tris-buffered saline with 0.1% Tween-20, membranes were visualized with enhanced chemiluminescence (ECL, Millipore) with images captured using Image Quant LAS-4000 (GE Healthcare, Sydney, NSW, Australia). Protein expression levels were quantified by densitometry using ImageJ 1.47v software (NIH, Bethesda, MD).
Quantitative real-time polymerase chain reaction (qRT-PCR)
RNA was extracted using Tri-reagent (Sigma-Aldrich, Sydney, NSW, Australia) and treated with DNase I (Invitrogen, Melbourne, VIC, Australia) to remove any contaminating genomic DNA and stored at −80 °C as previously described (Maniam & Morris, Citation2010a). RNA concentration was determined using a Biospec-nano spectrophotometer (Shimadzu, Sydney, NSW, Australia). Two micrograms of RNA was reverse transcribed to cDNA using Omniscript Reverse Transcription kit (Qiagen, Melbourne, VIC, Australia) and stored at −20 °C.
Liver
Quantitative real-time PCR (qRT-PCR) was performed on liver samples using Taqman probes (Applied Biosystems, Melbourne, VIC, Australia) for genes associated with glucose and insulin metabolism plus inflammatory markers including acetyl-CoA carboxylase alpha (Acaca, Rn00573474_m1), cluster of differentiation 36 (Cd36, Rn02115479_g1), carnitine palmitoyltransferase 1a (Cpt1a, Rn00580702_m1), fat mass and obesity associated (Fto, Rn01538187_m1), glucose-6-phosphatase (G6pc, Rn00689876_m1), nuclear receptor subfamily 3, group C, member 1 (GR, Rn00561369_m1), hexose-6-phosphatase dehydrogenase (H6pd, Rn01519771_m1), hydroxysteroid 11-beta dehydrogenase 1 (Hsd11b1/11βHSD-1, Rn00567167_m1), interleukin 15 (Il-15, Rn00689964_m1), Interleukin 1 beta (Il-1b, Rn00580432_m1), MLX-interacting protein-like (Mlxipl/ChREPB, Rn00591943_m1) nuclear receptor subfamily 3, group C, member 2 (MR, Rn00565562_m1), nuclear receptor subfamily 1, group H, member 3 (Nr1h3/LXRα, Rn00581185_m1), phosphoenolpyruvate carboxykinase 1 (Pck1/Pepck, Rn01529014_m1), peroxisome proliferator activated receptor alpha (Ppara, Rn00566193_m1), Sirtuin 1 (Sirt1, Custom inventoried – AJD1TRO), Sirtuin 3 (Sirt3, Rn01501410_m1), steroid-5-alpha-reductase, alpha polypeptide 1(Srd5a1/5-α reductase, Rn00567064_m1), sterol regulatory element binding transcription factor 1(Srebf1, Rn01495769_m1), tumor necrosis factor (Tnf, Rn99999017_m1) and Tribbles homolog 3 (Trib3, Rn00595314_m1). Five housekeeper genes were assessed and the stability of each was analyzed using Normfinder software. The geometric mean of the two housekeepers with the highest stability value, Ywhaz (tyrosine 3-monooxygenase/tryptophan 5-monooxygenase activation protein) and B2m (beta-2 microglobulin), was used as reference. Analysis was performed using the ΔΔCT method and data expressed relative to a pooled calibrator sample.
Skeletal muscle (soleus)
For muscle gene expression related to glucose and insulin homeostasis, we performed qRT-PCR using micro fluid cards (Life Technologies) which were precustomized with genes of interest and three housekeepers including insulin growth factor (Igf1-Rn99999087_m1), total insulin receptor (Insr-Rn00690703_m1), insulin receptor 1 (Irs1-Rn02132493_s1), insulin receptor 2 (Irs2-Rn01482270_s1), solute carrier family 2 (facilitated glucose transporter), member 4 (Slc2a4-Rn01752377_m1), forkhead box O1 (Foxo1-Rn01494868_m1), forkhead box O3 (Foxo3-Rn01441087_m1), v-akt murine thymoma viral oncogene homolog 2 (Akt2-Rn00690904_gH) and v-akt murine thymoma viral oncogene homolog 3 (protein kinase B, gamma (Akt3-Rn00442194_m1). We used 1.5 μg of cDNA. Hundred microliters of cDNA/Mastermix (Advanced Fast Mastermix, Life Technologies) mixture was pipetted into the micro fluid cards, and after centrifugation, the cards were sealed and qRT-PCR was performed.
Statistical analysis
Data are presented as mean ± standard error of mean (SEM). Body weight, food intake, glucose/insulin tolerance data and plasma insulin concentrations over time during the glucose tolerance test were analyzed using ANOVA with repeated measures, followed by post-hoc Fisher’s Least Significant Difference (LSD) test. Body weight at weaning was analyzed using one-way ANOVA, followed by post-hoc Fisher’s LSD. Data on organ weight, terminal plasma hormone concentrations, and mRNA and protein expression in liver and muscle tissue were analyzed using two-way ANOVA, followed by post-hoc Fisher’s LSD. p < 0.05 was considered significant. Post-hoc analysis was only conducted when a significant interaction between sucrose consumption and LN exposure was found in the two-way ANOVA analysis.
Results
Effects on body weight and food intake
For body weight at weaning (pre-diet), one-way ANOVA revealed a significant effect of treatment (F(3, 43) = 9.144, p < 0.0001). Post-hoc analysis revealed that LN rats were significantly lighter than control rats (p < 0.01, ). However, at 15 weeks, two-way ANOVA revealed no significant interaction between diet and LN exposure on body weight but a significant effect of LN exposure at 15 weeks, F(1, 46) = 4.19, p = 0.04. Body weight of LN rats consuming chow or chow plus sucrose was not significantly different from control rats, independent of diet (p > 0.05, ). Examination of the combined weekly intakes showed no significant interaction between sucrose consumption and LN exposure but a main effect of sucrose consumption was observed (F(1, 9) = 15.99, p < 0.01, two-way ANOVA). Relative energy intakes from chow and sucrose were not significantly different across the LN and control groups ().
Table 1. Effects of limited bedding material (LN) exposure and sucrose consumption on offspring phenotype.
Effects of LN exposure on glucose and insulin tolerance and insulin secretion during glucose tolerance test
Glucose tolerance test
For blood glucose concentrations, repeated measures ANOVA revealed a significant interaction between time and treatment (F(18, 222) = 4.175, p < 0.0001) with a main effect of treatment (F(3, 37) = 6.664, p = 0.001). LN exposure did not alter glucose tolerance in the chow fed rats (p > 0.05, ). However, in those consuming sucrose, in the LN rats glucose concentrations at 30 and 45 min post-glucose were 16% and 21% lower than in control rats consuming sucrose (p < 0.05, ). Examination of the overall blood glucose concentration AUC revealed no significant interaction between diet and LN exposure, however, main effects of LN exposure (F(1, 37) = 4.571, p = 0.04) and sucrose (F(1, 37) = 19.28, p < 0.0001) were observed. LN rats consuming sucrose had similar glucose clearance as the control rats consuming the same diet ( inset).
Figure 1. Early-life limited nesting (LN) and glucose and insulin regulation and tolerance in adulthood. Glucose tolerance test (2 g/kg of 50% glucose, i.p.) was conducted at 13 weeks of age. (A) Blood glucose concentrations; inset: incremental area under the curve (AUC). (B) Plasma insulin concentrations during the glucose tolerance test; inset: incremental area under the curve (AUC). (C) Insulin tolerance test (1 U/kg) conducted 1 week later. Blood glucose concentrations; inset: incremental area under the curve (AUC). Con: controls (no LN); Suc: sucrose diet. Data are mean ± S.E.M; repeated measures two-way ANOVA followed by LSD, n = 9–13/group. Post-hoc analysis performed when a significant interaction between diet and LN present. †p < 0.05 versus rats consuming only chow (diet effect). *p < 0.05 versus control rats consuming the same diet (LN effect).
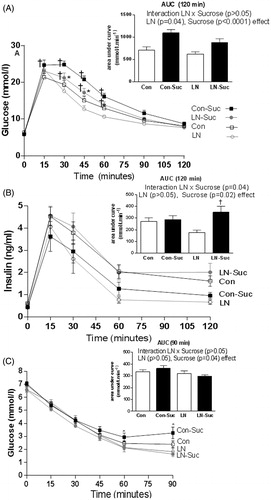
Insulin secretion during the glucose tolerance test showed no significant interaction between time and treatment, but significant main effects of time (F(4, 136) = 81.61, p < 0.0001) and treatment group (F(3, 34) = 3.206, p = 0.035) on insulin concentrations were observed (). Examining the AUC for insulin secretion during the glucose tolerance test showed a significant interaction between sucrose consumption and LN exposure (F(1, 38) = 4.145), p = 0.04) and a main effect of sucrose consumption (F(1, 38) = 5.989, p = 0.02). Interestingly, LN rats consuming sucrose had a much greater AUC for insulin secretion during the glucose tolerance test than their chow LN counterparts (p < 0.01, inset). Body weights were not significantly different across groups at the time of testing (data not shown).
Insulin tolerance test
For blood glucose concentrations, a significant interaction between time and treatment was observed (F(15, 200) = 2.474, p = 0.002; ). The immediate response to insulin in the first 30 min was not different across groups, as reflected by similar glucose concentrations during this phase. However, a faster rebound was observed in the LN-Sucrose versus the Con-Sucrose rats, as evidenced by higher glucose concentrations 60 min post-insulin injection (p < 0.05, ). Examination of the AUC for blood glucose concentrations in the insulin tolerance test showed no significant interaction between diet and LN exposure (p > 0.05, inset). There was only a main effect of LN (F(1,40) = 4.337, p = 0.04). The LN rats consuming chow or chow plus sucrose had similar insulin tolerance relative to control rats consuming the same diet ( inset).
A surrogate marker of insulin sensitivity, QUICKI, was also calculated and this demonstrated significant interaction between sucrose consumption and LN exposure (F(1, 33) = 22.91, p < 0.0001). In addition, main effects of LN exposure (F(1, 33) = 49.76, p < 0.0001) and sucrose consumption (F(1, 33) = 72.69, p < 0.0001) were observed. LN rats consuming chow had improved insulin sensitivity relative to unstressed controls (p < 0.05, ). Sucrose consumption impaired insulin sensitivity (p < 0.05, ) and this sucrose-induced impairment was greater in LN rats (p < 0.01, ).
Effects of LN exposure and sucrose consumption on offspring body weight, organ mass and plasma measures post-mortem
In terms of fat mass, we observed a significant interaction between LN exposure and sucrose consumption (F(1, 48) = 6.509, p = 0.014) and as expected sucrose consumption had a significant effect on adipose tissue mass (F(1, 48) = 78.19, p < 0.0001). While sucrose consumption increased percent fat mass by 70% in the control rats, the LN rats consuming sucrose had a marked increase of 156% fat mass versus their LN-chow counterparts (p < 0.01, ). In addition, post-hoc analysis revealed that LN-Sucrose rats had 26% more total WAT mass versus Con-Sucrose (p = 0.007, ). Liver weights including net weight and as percent body weight were not altered by LN exposure or sucrose consumption (). As an index of lipid accumulation, triglycerides in liver and plasma were measured, and as expected a main effect of sucrose consumption on liver (F(1, 41) = 13.71, p = 0.0006) and plasma (F(1, 52) = 29.93, p < 0.0001) triglyceride concentrations were observed with no significant interaction between sucrose intake and LN exposure (). We also examined the impact of LN exposure and sucrose consumption on the metabolic parameters circulating insulin and glucose concentrations. After the terminal 16 h fast, neither LN exposure nor sucrose consumption altered plasma insulin and glucose concentrations ().
There were no significant interactions between sucrose consumption and LN exposure on net muscle mass but when muscle mass was expressed as percent body weight, a significant interaction between sucrose consumption and LN exposure was present (F(1, 45) = 4.97, p = 0.031) and a significant main effect of sucrose consumption was observed on percent muscle mass (F(1, 45) = 12.95, p = 0.0008). Post-hoc analysis revealed LN-Sucrose rats had reduced percent muscle mass relative to Con-Sucrose rats (p < 0.05, ).
Effects of LN exposure and sucrose consumption on expression of genes associated with insulin and glucose homeostasis in muscle
Muscle insulin signaling has important effects on glucose homeostasis; hence, several mediators of insulin signaling and metabolism were measured to understand further the changes in insulin sensitivity induced by LN exposure in rats fed chow and sucrose. As insulin receptor in the muscle mediates diverse effects of insulin and plays a key role in regulating whole body glucose homeostasis, total insulin receptor expression was measured. Interestingly, a significant interaction between LN exposure and sucrose diet was present (F(1, 28) = 4.277, p = 0.048, ) with no main effects of diet or LN exposure. In the chow-fed rats, LN exposure increased the expression of insulin receptor mRNA relative to control rats consuming the same diet (p = 0.023, ). However, LN exposure had no effects on insulin receptor mRNA expression in the sucrose fed rats. mRNAs for other isoforms of insulin receptors were measured including insulin receptor 1 and 2 but these were not affected by either LN exposure or sucrose diet. Muscle is a major tissue that utilizes glucose, and glucose transporter-4 is expressed in abundance in the muscle. Here, despite no significant interaction between LN exposure and sucrose diet on glucose transporter-4, LN exposure led to higher levels of glucose transporter-4 mRNA expression relative to control rats, particularly in those consuming sucrose (F(1, 28) = 8.415, p = 0.007, ). FoxO is a downstream target of insulin and FoxO regulates upstream insulin signaling, thus modulating insulin sensitivity and glucose metabolism. Here, FoxO1 mRNA expression was not affected by LN exposure and sucrose diet; FoxO3 mRNA expression was not significantly affected by LN exposure, for sucrose diet (F(1, 27) = 3.601, p = 0.061, ). Akt kinase is a critical component of the insulin signaling pathway and FoxO3 is a downstream protein of the Akt signaling pathway. We measured mRNA expression of Akt-2 and Akt-3; no significant interaction between LN exposure and sucrose diet was observed; however, a main effect of LN exposure (F(1, 28) = 14.83, p = 0.006, ) on Akt-3 mRNA expression was evident with marked increases of mRNA expression of Akt-3 by LN exposure in both chow- and sucrose-fed rats.
Table 2. Effects of limited bedding material (LN) exposure and post-weaning sucrose consumption on mRNA expression of genes related to insulin and glucose homeostasis in skeletal muscle (soleus).
Effects of LN exposure and sucrose consumption on hepatic fat synthesis markers
We found a significant interaction between LN exposure and sucrose consumption (F(1, 47) = 9.835, p = 0.003) and a main effect of sucrose consumption (F(1, 47) = 38.47, p < 0.0001) on hepatic Acetyl-CoA carboxylase alpha (Acaca) mRNA expression, a marker of fat synthesis. In the chow-fed rats, LN exposure had no effect on the liver mRNA expression of Acaca versus control rats consuming chow. However, in the sucrose-fed rats, LN exposure increased Acaca mRNA significantly compared to control rats (p < 0.05, ). As expected, sucrose intake significantly increased Acaca mRNA expression by about 10% in control rats (Con-Sucrose) and a 66% increase was observed in LN rats (LN-Sucrose) (p < 0.05, ).
Figure 2. Effect of early-life limited nesting (LN) exposure and sucrose diet on hepatic lipid synthesis markers. (A) Acetyl-CoA carboxylase alpha (Acacia) mRNA expression. (B) Fatty acid synthase (FAS) protein expression. Measured in liver of female offspring aged 15 weeks after 16 h fasting. Con: controls (no LN); Suc: sucrose diet. Data are mean ± S.E.M; two-way ANOVA followed by LSD, n = 9–17/group. Post-hoc analysis performed when a significant interaction between diet and LN present. †p < 0.05 versus rats consuming only chow (diet effect). *p < 0.05 versus control rats consuming the same diet (LN effect).
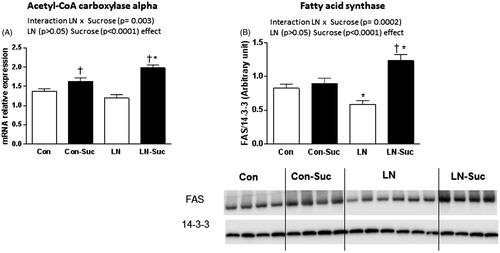
Fatty acid synthase (FAS) protein was also measured as a marker of fat synthesis. A significant interaction between LN exposure and sucrose consumption on FAS protein levels was observed (F(1, 42) = 16.33, p = 0.0002). In addition, a main effect of sucrose consumption was present (F(1, 42) = 25.41, p < 0.0001) which was only observed in LN rats. FAS was significantly decreased by 29% in the LN rats consuming chow versus Con rats (p < 0.05, ). In contrast, LN rats consuming sucrose post-weaning had a 27% increase in liver FAS versus control rats consuming the same diet (p < 0.01, ). Sucrose consumption did not alter FAS expression levels in the control rats (p > 0.05, ).
Effects of LN exposure and sucrose consumption on hepatic fat oxidation markers
Pgc-1α was measured as a marker of fat oxidation, and a significant interaction between LN exposure and sucrose consumption was observed on Pgc-1α protein level (F(1, 40) = 4.272, p = 0.045). In addition, a main effect of sucrose consumption was present (F(1, 40) = 10.09, p = 0.003). Sucrose consumption did not alter Pgc-1α protein expression levels in the controls rats, but Pgc-1α was increased by 30% in the LN rats drinking sucrose (p < 0.05, ). Post-hoc analysis revealed that LN-Sucrose rats had increased Pgc-1α protein expression levels relative to Con-Sucrose rats (p < 0.05, ).
Figure 3. Effect of early-life limited nesting (LN) exposure and sucrose diet on hepatic lipid oxidation mRNA and protein markers. (A) peroxisome proliferator-activated receptor gamma co-activator 1alpha (Pgc-1α) protein; (B) carnitine palmitoyltransferase 1a (Cpt1a) mRNA; (C) lipid transportation cluster of differentiation 36 (CD36) mRNA. Measured in liver of female rats aged 15 weeks after 16 h fasting. Con: controls (no LN); Suc: sucrose diet. Data are mean ± S.E.M; two-way ANOVA followed by LSD, n = 9–17/group. Post-hoc analysis performed when a significant interaction between diet and LN present. †p < 0.05 versus rats consuming chow (diet effect). *p < 0.05 versus control rats consuming the same diet (LN effect).
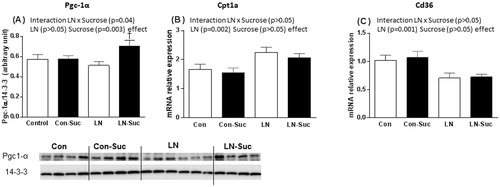
Liver Cpt1a and Cd36 mRNA expression were also measured due to their roles in fat oxidation and transportation, respectively. While there was no significant interaction between LN exposure and sucrose consumption on the expression of liver Cpt1a and Cd36, a main effect of LN exposure (F(1, 50) = 12.40, p = 0.001 Cd36, F(1, 46) = 10.92, p = 0.002 Cpt1a) was observed. In line with main effects of LN exposure, LN rats had increased expression of Cpt1a and decreased Cd36 mRNA independent of sucrose consumption (). Sucrose intake had no effect on these measures in both LN and control groups ().
Effects of LN exposure and sucrose consumption on hepatic genes involved in glucose metabolism
There were no significant interactions between sucrose consumption and LN exposure or main effect of LN exposure on the mRNA expression of the hepatic genes related to glucose metabolism. However, there was a main effect of sucrose consumption on Sirt3, Trib3, Chrebp, LXRα, FtO and Srebf1 (p < 0.01, ). As expected, sucrose diet increased mRNA expression of genes involved in hepatic glucose metabolism in control rats, such as Sirt3 (47%), Chrebp (14%), LXRα (22%), Fto (43%) and Srebf1 (60%) (Con-Sucrose vs Con p < 0.05, ). Examination of the data suggests that in LN rats consuming sucrose diet had a greater effect compared to control rats consuming sucrose, with the following increases in mRNA expression: Chrebp (20%), LXRα (32%), Srebf1 (109%) (LN-Sucrose vs LN p < 0.01, ). Other genes involved in hepatic glucose metabolism such as G6pc, H6pc and Pepck were not altered across groups (p > 0.05, ). In this cohort, LN exposure or daily consumption of 25% sucrose had no effect on markers of inflammation in the liver, including TNF, Il-1β and Il-15 (p > 0.05, ).
Table 3. Effect of limited bedding material (LN) exposure and sucrose consumption on mRNA expression of glucose metabolism-related genes and inflammatory markers in the liver.
Effects of LN exposure and sucrose consumption on hepatic glucocorticoid metabolism
Key regulators of glucocorticoid metabolism were measured including GR, MR, 5α-reductase and 11βHSD-1. For liver GR and MR mRNA expression, there were no significant interactions between sucrose consumption and LN exposure but a main effect of LN exposure was observed (GR- F(1, 45) = 4.438, p = 0.041, MR-F(1, 47) = 4.318, p = 0.043, ).
Figure 4. Effect of early-life limited nesting (LN) exposure and sucrose diet on hepatic mRNA expression of glucocorticoid action and metabolism markers. (A) Glucocorticoid receptor; (B) mineralocorticoid receptor; (C) 5-α reductase; (D) 11β hydroxysteroid dehydrogenase-1 (11βHSD-1). Measured in liver of female pups aged 15 weeks, after 16 h of fasting. Con: controls (no LN); Suc: sucrose diet. Data are mean ± S.E.M; two-way ANOVA followed by LSD, n = 9–17/group. Post-hoc analysis performed when a significant interaction between diet and LN present. †p < 0.05 versus rats consuming only chow (diet effect). *p < 0.05 versus control rats consuming the same diet (LN effect).
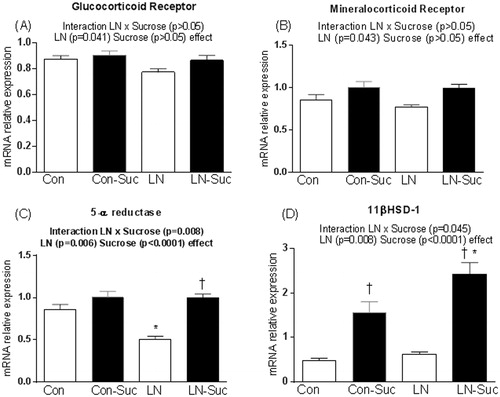
Interestingly, for 5-α reductase mRNA expression, a significant interaction between LN exposure and sucrose consumption (F(1, 47) = 7.781, p = 0.008) with main effects of LN exposure (F(1, 47) = 8.399, p = 0.006) and sucrose consumption (F(1, 47) = 26.69, p < 0.0001) were observed. Thus LN rats had an almost 50% reduction in 5α-reductase mRNA expression compared to Con rats (p < 0.05, ), but no effect of LN was observed in the sucrose fed rats. Thus, the reduced liver 5α-reductase mRNA seen in LN rats was returned to control levels by sucrose ().
Here the interaction between LN exposure and sucrose consumption on liver 11βHSD-1 mRNA expression approached significance (F(1, 48) = 3.956, p = 0.05). Significant main effects of LN exposure (F(1, 48) = 7.609, p = 0.008) and sucrose consumption (F(1, 48) = 61.83, p < 0.0001) on 11βHSD-1 mRNA expression were also observed. Sucrose consumption tripled liver 11βHSD-1 mRNA expression in control rats, and it was almost quadrupled in LN-Sucrose rats versus LN chow only-fed counterparts (p < 0.001, ). The combination of LN exposure and sucrose diet increased hepatic 11βHSD-1 mRNA expression by 53% versus Con-Sucrose rats (p < 0.01, 4D); no effect of LN was evident in chow-fed rats.
Discussion
This study provides a novel understanding of the impact of high sugar intake following early-life stress on glucose/insulin handling, plasma and hepatic lipid accumulation and hepatic glucocorticoid metabolism as rats mature. Contrary to our hypothesis, our results indicate that in the face of a healthy diet, metabolic function is largely preserved following early-life stress induced by LN, with some metabolic protection in LN rats consuming chow only as evidenced by enhanced insulin sensitivity. Further, LN exposure combined with post-weaning sucrose consumption had no further impact on glucose intolerance induced by sucrose consumption in controls. Moreover, sucrose induced increases in triglycerides in plasma and liver were not affected by LN exposure and this was in line with the activation of markers of both lipid oxidation and synthesis in the liver. We propose that this hepatic lipid profile in LN rats is associated with marked increases in liver 11βHSD-1 expression. While most metabolic outcomes were preserved or improved by LN exposure depending on the diet that the rats consumed, LN exposure led to increased adiposity when the rats were consuming sucrose. Taken together, we demonstrate for the first time that LN exposure produces minimal adverse metabolic consequences when rats are subsequently challenged with a high sucrose diet.
In terms of lipid profile, despite there being no significant effect of LN exposure on plasma and liver triglycerides in those consuming sucrose, marked increases in hepatic expression at the gene (mRNA) and protein level of mediators involved in fat oxidation and synthesis were observed in LN rats consuming sucrose. This was associated with differential diet effects following LN exposure on hepatic glucocorticoid metabolism mediators, particularly 11βHSD-1 levels.
LN exposed rats experienced “catch-up growth” and greater adiposity if they consumed sucrose
Little work has examined the metabolic consequences of the LN model (Machado et al., Citation2013). Here, LN exposure of pups and dams from PND 2–9 produced a combination of infrequent feeding and psychological stress, resulting in a lower pup body weight at weaning. However, the rats appeared to show catch-up growth, as their body weight was similar to the controls at the end of the study regardless of the diet consumed. This observation is in line with the thrifty hypothesis of Hales and Barker, where nutrient deprivation during early development programs the organism to adapt to similar conditions in later life; this programming increases risk for metabolic disorders when the environment changes and macronutrients are no longer scarce (Hales & Barker, Citation2001). Here, the LN model has been consistently reported to produce lighter animals, hence we suggest that this phenotype is a form of “postnatal” thrifty phenotype. Consistent with previous studies (Kendig et al., Citation2014; Sugimoto et al., Citation2005; Thompson et al., Citation2015), chronic sucrose consumption led to an increased adipose tissue mass relative to control rats consuming chow alone. Our findings indicate that the combination of early-life stress and chronic sucrose consumption led to an imbalance between energy production and utilization. Despite having a similar body weight and energy intake, sucrose consumption led to more than double the fat mass in LN rats relative to their chow alone-fed counterparts. In control rats, sucrose consumption led to a more modest increase (70%) in fat mass versus control rats consuming chow. Recently, gestational stress in combination with a later high energy diet was shown to result in increased fat mass relative to nonstressed control rats consuming the same diet, an effect that was only observed in females (Paternain et al., Citation2013). Hence, early-life stress in the form of gestation stress affects adiposity in a sex specific manner. Increased fat mass is reflective of reduced lipolysis. Lipid stored in adipose depots is mainly derived from circulating free fatty acids and triglycerides which are either sourced from the diet or liver (Peckett et al., Citation2011).
LN exposure did not modify glucose/insulin tolerance but improved insulin sensitivity in those only consuming chow
In contrast to our original hypothesis, the data show in rats consuming chow that LN exposure had no impact on glucose and insulin tolerance. While insulin secretion during glucose tolerance was unaltered by LN exposure in chow fed rats, insulin sensitivity as measured by QUICKI showed LN rats consuming chow to have improved insulin sensitivity relative to unstressed controls. This is likely explained through increases in total insulin receptor and increased Akt-3 mRNA (main effect of LN) in skeletal muscle, which is involved in insulin homeostasis. Further, increases in glucose transporter 4 as evidenced by main effect of LN is supportive of the improved insulin sensitivity in LN rats consuming only chow. However, future work should address activation of these markers in response to insulin stimulation, by examination of phosphorylated insulin receptor, Akt 3 and glucose-transporter 4 proteins. In this regard, a limitation of this study in understanding the mechanisms of improved insulin sensitivity in LN rats fed chow is that rats were not stimulated with insulin before they were killed. However, our study provides targets of mediators of insulin signaling that are modulated by LN exposure, which should be the focus of future studies.
Hence, these data reveal that early-life stress in the form of LN affords some metabolic protection in glucose and insulin homeostasis at the time of measurement in those consuming only chow. In line with this, other models of early-life stress have previously demonstrated similar beneficial effects. For example, female offspring exposed to gestational stress and maintained on a chow diet have been shown to have an improved insulin AUC during an oral glucose tolerance test (Tamashiro et al., Citation2009), reduced plasma insulin and improvements in homeostatic model assessment of insulin resistance (HOMA-IR) (Paternain et al., Citation2013) compared to nonstressed offspring. Moreover, these observations were absent in the males which is suggestive of sex-specific effects of early-life stress on metabolic consequences (Paternain et al., Citation2013; Tamashiro et al., Citation2009). However, in nonhuman primates, early-life stress induced by variable foraging demand led to impaired insulin resistance in offspring as measured by hyperglycemic-insulin clamp, but this was observed in the males (Kaufman et al., Citation2007). Taken together, the type and severity of stress exposure during development, species, age of testing and gender account for the variability in the effects of early-life stress on insulin sensitivity.
While sucrose consumption has been regularly shown to impair glucose and insulin tolerance (Elliott et al., Citation2002; Kawasaki et al., Citation2005; La Fleur et al., Citation2011), in this study, LN exposure showed no further effects on sucrose-induced glucose and insulin intolerance. Further, sucrose consumption impaired insulin sensitivity, with greater impairment in LN versus control rats, which can be related to the markedly increased requirement for insulin secretion during a glucose challenge in LN versus LN rats given the sucrose supplement. There has been limited work examining the impact of early-life stress and later high-energy diet on glucose and insulin tolerance. Gestational stress combined with later high-energy diet increased the insulin required to clear a glucose load compared to nonstressed controls in male but not female rats (Tamashiro et al., Citation2009), suggestive of sex-dependent impairment of insulin sensitivity. Using a postnatal model of prolonged maternal separation, we previously showed an exaggerated diet-induced increase in plasma insulin concentration in the male, but not in female rat offspring chronically fed a high-fat/high-sugar (HFHS) diet (Maniam & Morris, Citation2010b). This earlier study suggests that females are protected, relative to males, from diet-induced metabolic deficits when exposed to maternal separation. In another study, maternally separated male rats later exposed to an omega-3-deficient diet had marked elevations in plasma insulin and impaired insulin sensitivity, as assessed by HOMA-IR, relative to unstressed controls (Bernardi et al., Citation2013). Whether females are affected similarly is not known. These contrasting findings emphasize that the type of early-life stress, later diet and sex can have clear differential impacts on offspring metabolic outcomes.
In our study, the choice of diet (chow or sucrose diet) impacted insulin sensitivity in rats exposed to LN early in life a finding which builds on previous studies. For example, there is evidence supporting a programmed resilience to later life metabolic deficit following early-life stress if consuming chow (Paternain et al., Citation2013; Tamashiro et al., Citation2009); a concept which we refer to as the “pendulum of vulnerability”, whereby early-life stress shifts the risk for metabolic disease depending on the diet consumed later in life (Maniam et al., Citation2014).
LN exposure increased hepatic fat oxidation and fat synthesis markers in rats, with no impact on plasma and hepatic lipid accumulation
While LN exposure in chow-fed rats showed improvement insulin sensitivity, there were no changes in lipid profile, for both plasma and hepatic lipid accumulation. Lipid accumulation occurs as a result of increased fat synthesis or delivery, decreased fat export, and/or decreased fat oxidation (Postic & Girard, Citation2008). Hence, we further examined markers involved in lipid synthesis including (Acaca, FAS) oxidation (Pgc-1α) and transportation (Cd36) in the liver. Interestingly, while LN rats consuming only chow showed reduced liver FAS protein and Cd36 mRNA, but increased Cpt1a mRNA expression relative to control rats consuming chow, suggestive of increased fatty acid oxidation and reduced lipogenesis, we observed no changes in liver triglycerides. Further, as reflected by a main effect of LN exposure, Cd36 mRNA expression was reduced in LN rats consuming chow, suggestive of reduced uptake of free fatty acids. Cd36 plays an important role in facilitating uptake and intracellular trafficking of free fatty acid as well as esterification into triglycerides (Nassir et al., Citation2007). Cd36 mRNA expression is increased in rodents with raised liver triglyceride levels (Buque et al., Citation2010; Inoue et al., Citation2005; Koonen et al., Citation2007). The reasons for mismatch of the gene and protein expression between lipid metabolism and hepatic lipid profile induced by LN exposure in those given chow are unclear.
Dietary sugar is a known risk factor for hepatic lipid accumulation (Moore et al., Citation2014). However, here, in contrast to our hypothesis, LN exposure had no further impact on sucrose-induced increases in plasma and hepatic lipid accumulation. Both lipogenesis and lipid oxidation appear to be concomitantly activated in the liver of LN rats consuming sucrose after 16 hours fasting, as evidenced by increased markers of lipid synthesis (FAS and Acaca) and lipid oxidation (Pgc-1α levels). Fasting produces a dramatic increase in liver Pgc-1α expression, which, in turn, promotes liver fatty acid oxidation (Yoon et al., Citation2001), and here Pgc-1α protein level in liver was increased in LN rats consuming sucrose relative to control rats consuming the same diet. The increased lipid transportation as indicated by increases in Cd36 mRNA levels in LN rats consuming sucrose, together with increases in both lipid synthesis and oxidation markers in the liver, likely explains why there were no further effects of LN exposure on liver triglyceride accumulation. We propose this physiological and cellular response as a “metabolic adaptation” induced by LN exposure in response to high-sucrose diet. What remains unknown is whether this adaptation could be sustained as animals age and continue to consume this sucrose diet.
Glucocorticoids are essential regulators of lipid homeostasis in different physiological states and chronic glucocorticoid exposure can lead to lipid disorders including dyslipidemia and fatty liver (Arnaldi et al., Citation2010; Macfarlane et al., Citation2008). While circulating glucocorticoid concentrations are tightly controlled by the HPA axis (Chung et al., Citation2011), the tissue glucocorticoid levels are enhanced by the enzyme 11-beta HSD1 (Chung et al., Citation2011). As discussed previously, the liver is a major site of glucocorticoid metabolism (Tomlinson et al., Citation2004). Glucocorticoids are metabolized primarily by 5α/β reductase, an enzyme involved in converting active cortisol to its inactive tetrahydrometabolites. We found that LN exposure differentially affected liver glucocorticoid metabolism depending on the diet consumed postweaning. Chow diet markedly reduced liver 5-α reductase mRNA level with no difference in liver 11βHSD-1 mRNA expression, whereas sucrose consumption markedly increased liver 11βHSD-1 in LN rats relative to control rats consuming the same diet.
There is some evidence demonstrating differential effects of high-sugar diet on liver 11βHSD-1 levels and its association with hepatic lipid accumulation. For example, acute exposure of rats to fructose increased 11βHSD-1 mRNA in liver (London & Castonguay, Citation2011), while chronic consumption of both 16% and 32% sucrose solutions decreased hepatic 11βHSD-1 expression in male Sprague–Dawley rats (London et al., Citation2007). In contrast, we demonstrated a marked elevation in hepatic 11βHSD-1 expression in female rats consuming 25% sucrose solution relative to chow-fed counterparts. Moreover, rats previously exposed to LN showed a differential response to diet with a further 50% elevation in 11βHSD-1 mRNA expression relative to unstressed controls consuming sucrose. The contribution of liver 11βHSD-1 to hepatic lipid accumulation has been studied in transgenic models. For example, independent of obesity, liver-specific over-expression of 11βHSD-1 in mice resulted in increased fatty acid synthesis/flux leading to increased hepatic fat content as assessed by Oil Red O, and increased liver triglycerides (Paterson et al., Citation2004). While we observed a marked increase in liver 11βHSD-1 in LN-Sucrose relative to Con-Sucrose rats, liver triglyceride concentrations were not affected, although gene and protein expression levels of Acaca and FAS were higher in LN-Sucrose versus Con-Sucrose. There are several potential reasons as to why increases in liver 11βHSD-1 did not affect liver triglyceride concentrations in LN-Sucrose versus Con-Sucrose rats. First, despite the increase in mRNA levels of 11βHSD-1 in LN-Sucrose rats, whether this is transcribed to protein is unknown and the impact on fatty acid synthesis over fatty acid oxidation is unclear. This needs to be systematically examined in future studies using models of liver specific 11βHSD-1 overexpression. However, the increase in 11βHSD-1 mRNA observed here suggests an increased availability of corticosterone, and given the role of glucocorticoids in promoting very-low-density lipoprotein (VLDL) production and secretion and the induction of key lipogenic enzymes such as Acaca and FAS (Vegiopoulos & Herzig, Citation2007), this may explain the increases we observed in these enzymes.
LN exposure had no impact on hepatic glucose production regardless of the type of diet consumed
In the fasted condition, stimulation of glucose output and fatty acid oxidation in the liver is essential to sustain energy balance. The liver is involved in glucose homeostasis and is a major contributor to impaired glucose tolerance and insulin resistance, particularly that arising due to an impaired suppression of glucose output (Qi & Rodrigues, Citation2007). Liver glucose production is regulated by several substrate cycles and G6pc and PEPCK are the substrate cycle enzymes which act as rate-limiting enzymes for gluconeogenesis and glucose release (Nordlie et al., Citation1999). Here, we found neither chronic sucrose consumption nor LN altered expression of G6pc and Pepck mNA expression. This may be due to the 16-h fast prior to tissue harvesting as metabolic genes induced in the liver vary between the fed and fasted state (Zhang et al., Citation2011). Under conditions of nutrient deprivation, the balance of glycogenolysis and gluconeogenesis drives ongoing supply of glucose to dependent tissues. In order to preserve glucose, there is a shift in fuel usage from glucose utilization to fat oxidation. Moreover, changes in the hepatic gene profile between the fed and fasted state are differentially regulated by diet (Koo et al., Citation2008; Ryu et al., Citation2005). For instance, rats consuming sucrose showed a marked increase in mRNA expression of two key gluconeogenic enzymes, G6pc and fructose 2,6-bisphosphate compared to their glucose-fed counterparts in the fed, but not fasted state (Koo et al., Citation2008), which may be relevant to our observations.
Conclusion
Importantly, here we show that in rats consuming only chow, LN exposure did not alter glucose and insulin tolerance; however, rats exposed to LN exhibited improved insulin sensitivity. Sucrose exposure impaired glucose tolerance in both control and LN rats, with no worsening induced by LN. However, the sucrose-induced impairment in insulin sensitivity was greater in rats exposed to LN versus control rats. These opposite shifts in glucose and insulin homeostasis in LN rats consuming chow or sucrose relative to unstressed rats clearly demonstrate that LN exposure shifts metabolic disease vulnerability in a diet-dependent manner. Here, we also demonstrated for the first time that early-life stress in the form of LN derails lipid metabolism in those consuming sucrose, but does not result in higher triglyceride levels in either plasma or liver, and this is probably due to an increase in both synthesis and utilization which may be related to significant increases in 11βHSD-1 mRNA expression observed in the liver.
We propose that early-life stress induced by LN produces some physiological adaptation and resilience to metabolic deficits in later life depending on the diet consumed. Our novel finding of increased adiposity when LN exposure was combined with sucrose ingestion is of concern and should drive further studies of the interaction of diet and early-life stress exposures in the risk of metabolic disease. Moreover, we speculate that a different outcome may have been observed if our rats had consumed a high-fat and high-sugar diet. This is an important question given the known impact of early-life adversity on metabolic risk in humans (Maniam et al., Citation2014).
Declaration of interest
The authors declare that there is no conflict of interest.
References
- Adam TC, Epel ES. (2007). Stress, eating and the reward system. Physiol Behav 91:449–58
- Andrew R, Gale CR, Walker BR, Seckl JR, Martyn CN. (2002). Glucocorticoid metabolism and the metabolic syndrome: associations in an elderly cohort. Exp Clin Endocrinol Diabetes 110:284–90
- Arnaldi G, Scandali VM, Trementino L, Cardinaletti M, Appolloni G, Boscaro M. (2010). Pathophysiology of dyslipidemia in Cushing’s Syndrome. Neuroendocrinology 92(Suppl 1):86–90
- Aschbacher K, Kornfeld S, Picard M, Puterman E, Havel PJ, Stanhope K, Lustig RH, Epel E. (2014). Chronic stress increases vulnerability to diet-related abdominal fat, oxidative stress, and metabolic risk. Psychoneuroendocrinology 46:14–22
- Beesdo K, Knappe S, Pine DS. (2009). Anxiety and anxiety disorders in children and adolescents: developmental issues and implications for DSM-V. Psychiatr Clin North Am 32:483–524
- Bernardi JR, Ferreira CF, Senter G, Krolow R, De Aguiar BW, Portella AK, Kauer-Sant'anna M, et al. (2013). Early life stress interacts with the diet deficiency of omega-3 fatty acids during the life course increasing the metabolic vulnerability in adult rats. PLoS One 8:e62031
- Bray GA. (2013). Energy and fructose from beverages sweetened with sugar or high-fructose corn syrup pose a health risk for some people. Adv Nutr 4:220–5
- Buque X, Martinez MJ, Cano A, Miquilena-Colina ME, Garcia-Monzon C, Aspichueta P, Ochoa B. (2010). A subset of dysregulated metabolic and survival genes is associated with severity of hepatic steatosis in obese Zucker rats. J Lipid Res 51:500–13
- Calabrese F, Molteni R, Racagni G, Riva MA. (2009). Neuronal plasticity: a link between stress and mood disorders. Psychoneuroendocrinology 34(Suppl 1):S208–16
- Chung S, Son GH, Kim K. (2011). Circadian rhythm of adrenal glucocorticoid: its regulation and clinical implications. Biochim Biophys Acta 1812:581–91
- Elliott SS, Keim NL, Stern JS, Teff K, Havel PJ. (2002). Fructose, weight gain, and the insulin resistance syndrome. Am J Clin Nutr 76:911–22
- Ferramosca A, Conte A, Damiano F, Siculella L, Zara V. (2014). Differential effects of high-carbohydrate and high-fat diets on hepatic lipogenesis in rats. Eur J Nutr 53:1103–14
- Folch J, Lees M, Sloane Stanley GH. (1957). A simple method for the isolation and purification of total lipides from animal tissues. J Biol Chem 226:497–509
- Grucza RA, Przybeck TR, Cloninger CR. (2007). Prevalence and correlates of binge eating disorder in a community sample. Compr Psychiatry 48:124–31
- Hales CN, Barker DJ. (2001). The thrifty phenotype hypothesis. Br Med Bull 60:5–20
- Heim C, Nemeroff CB. (2001). The role of childhood trauma in the neurobiology of mood and anxiety disorders: preclinical and clinical studies. Biol Psychiatry 49:1023–39
- Hoy AJ, Bruce CR, Cederberg A, Turner N, James DE, Cooney GJ, Kraegen EW. (2007). Glucose infusion causes insulin resistance in skeletal muscle of rats without changes in Akt and AS160 phosphorylation
- Inoue M, Ohtake T, Motomura W, Takahashi N, Hosoki Y, Miyoshi S, Suzuki Y, et al. (2005). Increased expression of PPARgamma in high fat diet-induced liver steatosis in mice. Biochem Biophys Res Commun 336:215–22
- Johnson RJ, Nakagawa T, Sanchez-Lozada LG, Shafiu M, Sundaram S, Le M, Ishimoto T, et al. (2013). Sugar, uric acid, and the etiology of diabetes and obesity. Diabetes 62:3307–15
- Katz A, Nambi SS, Mather K, Baron AD, Follmann DA, Sullivan G, Quon MJ. (2000). Quantitative insulin sensitivity check index: a simple, accurate method for assessing insulin sensitivity in humans. J Clin Endocrinol Metab 85:2402–10
- Kaufman D, Banerji MA, Shorman I, Smith EL, Coplan JD, Rosenblum LA, Kral JG. (2007). Early-life stress and the development of obesity and insulin resistance in juvenile bonnet macaques. Diabetes 56:1382–6
- Kawasaki T, Kashiwabara A, Sakai T, Igarashi K, Ogata N, Watanabe H, Ichiyanagi K, Yamanouchi T. (2005). Long-term sucrose-drinking causes increased body weight and glucose intolerance in normal male rats. Br J Nutr 93:613–18
- Kendig MD, Rooney KB, Corbit LH, Boakes RA. (2014). Persisting adiposity following chronic consumption of 10% sucrose solution: strain differences and behavioural effects. Physiol Behav 130:54–65
- Koo HY, Wallig MA, Chung BH, Nara TY, Cho BH, Nakamura MT. (2008). Dietary fructose induces a wide range of genes with distinct shift in carbohydrate and lipid metabolism in fed and fasted rat liver. Biochim Biophys Acta 1782:341–8
- Koonen DPY, Jacobs RL, Febbraio M, Young ME, Soltys C-LM, Ong H, Vance DE, Dyck JRB. (2007). Increased hepatic CD36 expression contributes to dyslipidemia associated with diet-induced obesity. Diabetes 56:2863–71
- La Fleur SE, Luijendijk MC, Van Rozen AJ, Kalsbeek A, Adan RA. (2011). A free-choice high-fat high-sugar diet induces glucose intolerance and insulin unresponsiveness to a glucose load not explained by obesity. Int J Obes (Lond) 35:595–604
- Laugero KD, Bell ME, Bhatnagar S, Soriano L, Dallman MF. (2001). Sucrose ingestion normalizes central expression of corticotropin-releasing-factor messenger ribonucleic acid and energy balance in adrenalectomized rats: a glucocorticoid-metabolic-brain axis? Endocrinology 142:2796–804
- London E, Castonguay TW. (2011). High fructose diets increase 11beta-hydroxysteroid dehydrogenase type 1 in liver and visceral adipose in rats within 24-h exposure. Obesity (Silver Spring) 19:925–32
- London E, Lala G, Berger R, Panzenbeck A, Kohli AA, Renner M, Jackson A, et al. (2007). Sucrose access differentially modifies 11beta-hydroxysteroid dehydrogenase-1 and hexose-6-phosphate dehydrogenase message in liver and adipose tissue in rats. J Nutr 137:2616–21
- Macfarlane DP, Forbes S, Walker BR. (2008). Glucocorticoids and fatty acid metabolism in humans: fuelling fat redistribution in the metabolic syndrome. J Endocrinol 197:189–204
- Machado TD, Dalle Molle R, Laureano DP, Portella AK, Werlang IC, Benetti Cda S, Noschang C, Silveira PP. (2013). Early life stress is associated with anxiety, increased stress responsivity and preference for “comfort foods” in adult female rats. Stress 16:549–56
- Maniam J, Antoniadis C, Morris MJ. (2014). Early-life stress, HPA axis adaptation, and mechanisms contributing to later health outcomes. Front Endocrinol (Lausanne) 5:73
- Maniam J, Morris MJ. (2010a). Palatable cafeteria diet ameliorates anxiety and depression-like symptoms following an adverse early environment. Psychoneuroendocrinology 35:717–28
- Maniam J, Morris MJ. (2010b). Voluntary exercise and palatable high-fat diet both improve behavioural profile and stress responses in male rats exposed to early life stress: role of hippocampus. Psychoneuroendocrinology 35:1553–64
- Maniam J, Morris MJ. (2012). The link between stress and feeding behaviour. Neuropharmacology 63:97–110
- Mason SM, Flint AJ, Field AE, Austin SB, Rich-Edwards JW. (2013). Abuse victimization in childhood or adolescence and risk of food addiction in adult women. Obesity (Silver Spring) 21:E775–81
- Moore JB, Gunn PJ, Fielding BA. (2014). The role of dietary sugars and de novo lipogenesis in non-alcoholic fatty liver disease. Nutrients 6:5679–703
- Nassir F, Wilson B, Han X, Gross RW, Abumrad NA. (2007). CD36 is important for fatty acid and cholesterol uptake by the proximal but not distal intestine. J Biol Chem 282:19493–501
- Nordlie RC, Foster JD, Lange AJ. (1999). Regulation of glucose production by the liver. Annu Rev Nutr 19:379–406
- Paternain L, De La Garza AL, Batlle MA, Milagro FI, Martinez JA, Campion J. (2013). Prenatal stress increases the obesogenic effects of a high-fat-sucrose diet in adult rats in a sex-specific manner. Stress 16:220–32
- Paterson JM, Morton NM, Fievet C, Kenyon CJ, Holmes MC, Staels B, Seckl JR, Mullins JJ. (2004). Metabolic syndrome without obesity: Hepatic overexpression of 11beta-hydroxysteroid dehydrogenase type 1 in transgenic mice. Proc Natl Acad Sci U S A 101:7088–93
- Peckett AJ, Wright DC, Riddell MC. (2011). The effects of glucocorticoids on adipose tissue lipid metabolism. Metabolism 60:1500–10
- Polivy J, Herman CP, Mcfarlane T. (1994). Effects of anxiety on eating: does palatability moderate distress-induced overeating in dieters? J Abnorm Psychol 103:505–10
- POSTic C, Girard J. (2008). Contribution of de novo fatty acid synthesis to hepatic steatosis and insulin resistance: lessons from genetically engineered mice. J Clin Invest 118:829–38
- Qi D, Rodrigues B. (2007). Glucocorticoids produce whole body insulin resistance with changes in cardiac metabolism. Am J Physiol Endocrinol Metab 292:E654–67
- Ryu MH, Sohn HS, Heo YR, Moustaid-Moussa N, Cha YS. (2005). Differential regulation of hepatic gene expression by starvation versus refeeding following a high-sucrose or high-fat diet. Nutrition 21:543–52
- Sadeghimahalli F, Karbaschi R, Zardooz H, Khodagholi F, Rostamkhani F. (2015). Effect of early life stress on pancreatic isolated islets' insulin secretion in young adult male rats subjected to chronic stress. Endocrine 48:493–503
- Sheludiakova A, Rooney K, Boakes RA. (2012). Metabolic and behavioural effects of sucrose and fructose/glucose drinks in the rat. Eur J Nutr 51:445–54
- Sugimoto K, Suzuki J, Nakagawa K, Hayashi S, Enomoto T, Fujita T, Yamaji R, et al. (2005). Eucalyptus leaf extract inhibits intestinal fructose absorption, and suppresses adiposity due to dietary sucrose in rats. Br J Nutr 93:957–63
- Tamashiro KL, Terrillion CE, Hyun J, Koenig JI, Moran TH. (2009). Prenatal stress or high-fat diet increases susceptibility to diet-induced obesity in rat offspring. Diabetes 58:1116–25
- Thompson AK, Fourman S, Packard AE, Egan AE, Ryan KK, Ulrich-Lai YM. (2015). Metabolic consequences of chronic intermittent mild stress exposure. Physiol Behav 150:24–30
- Tomiyama AJ, Dallman MF, Epel ES. (2011). Comfort food is comforting to those most stressed: evidence of the chronic stress response network in high stress women. Psychoneuroendocrinology 36:1513–19
- Tomlinson JW, Walker EA, Bujalska IJ, Draper N, Lavery GG, Cooper MS, Hewison M, Stewart PM. (2004). 11beta-hydroxysteroid dehydrogenase type 1: a tissue-specific regulator of glucocorticoid response. Endocr Rev 25:831–66
- Uchida Y, Takeshita K, Yamamoto K, Kikuchi R, Nakayama T, Nomura M, Cheng XW, et al. (2012). Stress augments insulin resistance and prothrombotic state: role of visceral adipose-derived monocyte chemoattractant protein-1. Diabetes 61:1552–61
- Vegiopoulos A, Herzig S. (2007). Glucocorticoids, metabolism and metabolic diseases. Mol Cell Endocrinol 275:43–61
- Yoon JC, Puigserver P, Chen G, Donovan J, Wu Z, Rhee J, Adelmant G, et al. (2001). Control of hepatic gluconeogenesis through the transcriptional coactivator PGC-1. Nature 413:131–8
- Zhang F, Xu X, Zhou B, He Z, Zhai Q. (2011). Gene expression profile change and associated physiological and pathological effects in mouse liver induced by fasting and refeeding. PLoS One 6:e27553
- Zheng X, Wang Y, Ren W, Luo R, Zhang S, Zhang JH, Zeng Q. (2012). Risk of metabolic syndrome in adults exposed to the great Chinese famine during the fetal life and early childhood. Eur J Clin Nutr 66:231–6