
Abstract
Background: Asthmatic individuals constitute a large sub-population that is often considered particularly susceptible to the deleterious effects of inhalation of airborne chemicals. However, for most such chemicals information on asthmatics is lacking and inter-individual assessment factors (AFs) of 3–25 have been proposed for use in the derivation of health-based guideline values.
Objective: To evaluate available information in attempt to determine whether a general difference in airway response during short-term exposure between healthy and asthmatic individuals can be identified, and whether current AFs for inter-individual variability provide sufficient protection for asthmatics.
Methods: After performing systematic review of relevant documents and the scientific literature estimated differential response factors (EDRF) were derived as the ratio between the lowest observed adverse effect levels for healthy and asthmatic subjects based on studies in which both groups were tested under the same conditions. Thereafter, the concentration–response relationships for healthy and asthmatic subjects exposed separately to four extensively tested chemicals (nitrogen dioxide, ozone, sulfuric acid, sulfur dioxide) were compared on the basis of combined data. Finally, a Benchmark Concentration (BMC) analysis was performed for sulfur dioxide.
Results: We found evidence of higher sensitivity among asthmatics (EDRF > 1) to 8 of 19 tested chemicals, and to 3 of 11 mixtures. Thereafter, we confirmed the higher sensitivity of asthmatics to sulfuric acid and sulfur dioxide. No difference was observed in the case of ozone and nitrogen dioxide. Finally, our BMC analysis of sulfur dioxide indicated a ninefold higher sensitivity among asthmatics.
Conclusion: Although experimental data are often inconclusive, our analyses suggest that an AF of 10 is adequate to protect asthmatics from the deleterious respiratory effects of airborne chemicals.
Introduction
Health-based guidelines provide important and widely used tools for the management of acute risks related to chemical exposure. These values are intended, among other things, to help protect the general population, as well as occupationally exposed individuals from acute exposure to airborne chemicals. They are used, for example, by governmental agencies, community planners, industrial safety engineers and industrial hygienists.
Examples of guideline values for emergency planning and response include the Acute Exposure Guideline Levels (AEGL) and the Emergency Response Planning Guidelines (ERPG). The AEGL values are developed by the AEGL Program and reviewed and published in Final form by the National Academy of Sciences (NAS) and Environmental Protection Agency (EPA) in the USA. These threshold values cover exposure for five different durations (10 min, 30 min, 1 h, 4 h and 8 h) at three levels (tiers) of severity, namely: AEGL-1: notable discomfort, irritation or certain asymptomatic non-sensory effects. AEGL-2: irreversible and/or other serious, long-lasting adverse health effects or an impaired ability to escape. AEGL-3: life-threatening effects or death. The ERPG values, developed by the American Industrial Hygiene Association (AIHA), cover exposure for 1 h only and three tiers similar to those of the AEGL, below which it is assumed that nearly all individuals can be exposed without undue effects on health.
Occupational exposure limits (OEL), including short-term and ceiling limits (STEL, CLV), are developed by committees serving under, for example, the American Conference of Governmental Industrial Hygienists (ACGIH) and the European Commissions’ Scientific Committee on Occupational Exposure Limit Values (SCOEL). These OELs are utilized to establish safe levels of exposure and for implementation of adequate controls for the protection of workers, in most cases, being intended to safeguard healthy adult workers. Previously, we demonstrated that only occasionally are key findings concerning asthmatics taken into consideration when deciding on OELs (Johansson et al. Citation2012). It is therefore questionable whether OELs protect subjects with mild asthma, or indeed, other pre-existing, common health problems.
Two important aspects of deciding on guideline values are inter-individual variability in susceptibility and the identification of particularly sensitive sub-populations. Typically, children, the elderly and individuals with pre-existing diseases, such as asthma, are considered to be more sensitive (NRC Citation2001). Here, we summarize the experimental evidence concerning the sensitivity of asthmatics. Asthma is a common, life-long, chronic inflammatory disease of the airways that afflicts adults and children of all ages. The World Health Organization (WHO) estimates that there are 235 million asthmatics worldwide (WHO Citation2013). Others estimate that 1–18% of the populations of different countries are currently affected (GINA Citation2014) and the prevalence has increased in several countries during the last few decades (Eder et al. Citation2006).
Health-based guidelines are intented to establish a threshold level of exposure below which adverse effects are unlikely. The health risk assessment process consists of four parts: hazard identification, hazard characterization, exposure assessment and risk characterization (IPCS Citation2004). Assessment factors (AFs; also referred to as safety factors or uncertainty factors) are incorporated in order to account for both biological variability and uncertainty. There is a considerable inter-individual variability in the relationship between exposure dose and target dose (toxicokinetics), as well as that between target dose and adverse effect (toxicodynamics). Extrapolation of experimental data from, for example, laboratory animals and routes of exposure other than inhalation to real-life human situations involves a number of uncertainties (for reviews of AFs, see e.g. ECHA Citation2010; Falk-Filipsson et al. Citation2007).
Different expert committees and authorities often arrive at divergent guideline values for one and the same substance, frequently because of differences in the selection of key studies, consideration of sensitive groups, use of AFs and consideration of adverse health outcomes (Öberg et al. Citation2010). Earlier, we observed that experimental data or statements concerning asthmatics are lacking in 70% of the AEGL technical support documents, used as basis for short-term guideline values (Johansson et al. Citation2012), even though most of the 250 chemicals considered by the AEGL committee (in connection with the “Interim” or “Final” stage in 2012) are classified as respiratory irritants and employed in large amounts. Thus, experimental findings on asthmatics were provided for only 15 chemicals. Furthermore, analysis of the support documents for the same 15 chemicals used to develop nine sets of guideline values developed by other committees/authorities revealed that experimental studies on asthmatics, although available at the time of the evaluation, were frequently not included.
When no chemical-specific information is available, risk assessors typically apply a default AF of 10 to account for inter-individual variability (Renwick Citation1991, Citation1993, US EPA Citation1988, Citation1993). However, for the working and general populations European REACH legislation proposes default AF values of 5 and 10 (ECHA Citation2010), the Dutch TNO (Netherlands Organization for Applied Scientific Research) 3 and 10 (Hakkert et al. Citation1996) and the European Centre for Ecotoxicology and Toxicology of Chemicals 3 and 5 (ECETOC Citation2003). An AF for the general population of 25 was suggested in a report by the German Federal Institute for Occupational Safety and Health and the German Federal Environmental Agency (Kalberlah & Schneider Citation1998).
To account for variabilities in toxicokinetics and toxicodynamics the inter-individual factor can be sub-divided into two equal parts (100.5 * 100.5). This subdivision facilitates later replacement of the default AF with a chemical-specific adjustment factor, as proposed, for example, by IPCS (Citation1994). AFs specific for a mode of action or pathway have also been proposed to allow, e.g. human variability in Phase I metabolism. They constitute an intermediate between the chemical specific and the default AFs (Dorne & Renwick Citation2005).
Our objective here was to evaluate the experimental basis for AFs intended to take inter-individual variability in susceptibility to irritant chemicals into account. A similar analysis of the variability in response of susceptible groups exposed to a few irritant gases has been investigated by Young et al. (Citation2009). First, we attempted to identify any general differences between healthy and asthmatic individuals with respect to airway response to short-term exposure and, thereafter, using the information available on four chemicals that have been examined extensively, to determine whether the AFs currently employed for inter-individual variability are adequate for asthmatics.
Methods
Part 1: Estimation of differential response factors on the basis of tests on healthy and asthmatic subjects under the same conditions: strategy for searching the literature
Controlled exposure studies including both healthy and asthmatic subjects exposed under the same conditions to airborne substances via a mouthpiece, head dome, face mask or in chamber with or without nose clip were identified. This literature search was based on the references in the supporting documents for five sets of short-term guideline values for the general population: the AEGL, ERPG, Minimal Risk Levels (US Agency for Toxic Substances and Disease Registry, ATSDR), Reference Exposure Levels (California Office of Environmental Health Hazard Assessment, OEHHA) and French Acute Toxicity Threshold Values (French National Institute for Industrial Environment and Risks, INERIS): and five sets of short-term exposure limits and similar occupational short-term values: the Dutch Expert Committee on Occupational Standards (Health Council of the Netherlands), Maximum Concentration at the Workplace (German Research Foundation, DFG), SCOEL, Swedish Occupational Exposure Limits (Swedish Work Environment Authority, SWEA) and ACGIH Threshold Limit Values (this database is described in detail by Johansson et al. Citation2012). These references were then supplemented with searches in PubMed and Toxnet databases of the US National Library of Medicine, as well as the Elsevier database EMBASE and Google scholar.
The search profile was “asthma”, “human”, “exposure”, “chamber” and “effect”, and this search was expanded by including the following frequently occurring names of authors as search terms: Koenig, Utell, Linn, Gong and Bethel, as well as by searching for specific chemicals thus identified. No temporal or other restrictions were employed. The latest search was performed on 19 February 2015. The approach to the identification of human exposure studies relevant to Part 1 is presented in and characterization of the different parts of the present study and the criteria for quality employed are shown in and , respectively.
Figure 1. Approach to the identification of studies relevant to Part 1: Estimation of differential response factors on the basis of tests on healthy and asthmatic subjects under the same conditions. Relevant studies were identified from risk assessment documents and a computerized search of the peer-reviewed literature. All studies found were characterized () and found to fulfill our criteria for quality (). Data concerning the total number of chemicals, mixtures and studies were then used as basis to estimate differential response factors.
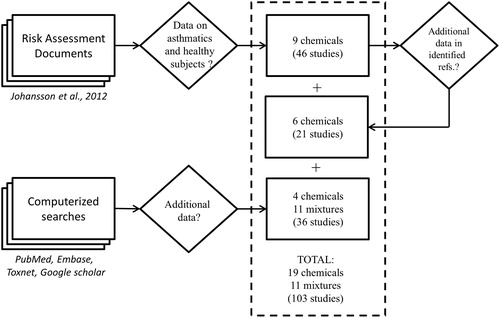
Table 1. Characterization of the three parts of the present study.
Table 2. The criteria for quality applied.
Statistically significant changes in pulmonary function, levels of inflammatory markers and symptom scores were used to identify the lowest observed adverse effect levels (LOAEL). For each endpoint and study an estimated differential response factor (EDRF) was calculated as the ratio between the LOAELs for the healthy and the asthmatic subjects. In cases where a LOAEL could not be identified in healthy subjects the ratio between the no observed adverse effects level (NOAEL) in healthy subjects and the LOAEL in asthmatics were calculated and noted with a greater-than sign.
There is a certain amount of subjectivity involved in combining all studies on a chemical to derive an overall EDRF. We applied a weight of evidence approach, considering factors such as the number of studies, duration of exposure (very short exposures were considered to be inconclusive), type of outcome [forced expiratory volume in one second (FEV1) and specific airway resistance (SRaw) were considered to be more relevant if the EDRFs from different studies were in disagreement] and the number of subjects (higher weight was given to studies involving more subjects). In addition, the definition of asthma and documentation of asthma therapy was considered. Effects induced by exercise were controlled for by considering the response of asthmatics to exposure to filtered air exposures. Overall EDRFs were considered to be inconclusive if the study did not meet our criteria or if LOAELs were not determined for either asthmatic or healthy subjects.
It should be noted that the studies retrieved employed endpoints of varying severity, i.e. sensory irritation (e.g. eye, nose or throat irritation and frequency of eye blinking), impairment of pulmonary function (spirometry) or hyperreactivity (bronchial challenge test). Sensory irritation, i.e. unpleasant sensation from the eyes and/or upper airways caused by stimulation of the trigeminal nerve endings by airborne substances (Damgård Nielsen et al. Citation2007), is often utilized as the critical effect for setting AEGL-1 values. Impairment of pulmonary function is considered more severe and serves as a basis for AEGL-2 values. Here, endpoints related to sensory irritation and impairment of pulmonary function were most important for our determination of overall EDRFs.
Part 2: Comparative analysis of concentration–response relationships
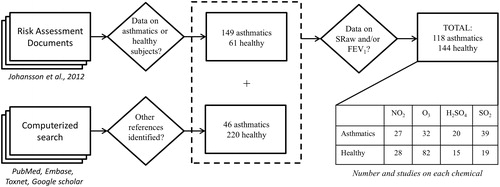
Four chemicals (nitrogen dioxide, ozone, sulfuric acid and sulfur dioxide) were selected for a meta-analysis of concentration–response relationships based on studies in which healthy and asthmatic subjects were tested under either the same conditions or in separate studies. These chemicals were chosen because of the large number of human studies that have been performed with them. In addition to the studies on healthy and asthmatic subjects under the same experimental conditions identified in Part 1, literature searches were designed to find studies involving only healthy or asthmatic groups. The latest was performed on 19 February 2015 and the approach involved is presented in . Again, the characterization and quality criteria are shown in and , respectively. In total, 476 separate sets of data on these four chemicals were retrieved and the comparative analysis was based on the data sets that included FEV1 and/or SRaw (n=262).
Figure 2. Approach to the identification of studies for Part 2: Comparative analysis of concentration–response relationships. Studies on healthy or asthmatic subjects exposed to nitrogen dioxide, ozone, sulfuric acid or sulfur dioxide were extracted from risk assessment documents and a computerized search of the peer-reviewed literature. All of these studies were characterized () and found to fulfill our criteria for quality (). The studies concerning data on SRaw or FEV1 were selected for this analysis.
Group-wise data on FEV1 and SRaw were extracted from these studies since individual details were usually lacking. The percentage change in FEV1 and SRaw was determined by deriving the values after-exposure by the baseline values. The responses of subjects to control exposure to filtered air are considered to reflect exposure levels of 0 mg/m3. The US EPA has, based on judgments from medical experts in the Clean Air Scientific Advisory Committee and commenters from the public, used four levels to characterize the severity of the airway responses from short-term exposure to oxides of nitrogen, ozone and sulfur dioxide (US EPA Citation2007, Citation2008, Citation2009): decrements in FEV1 were rated as “no response” (<3%), “small response” (3–10%), “moderate response” (10–20%) or “large response” (≥20%), while the change in SRaw was graded as “no response” (<20%), “small response” (20–100%), “moderate response” (100–200%) or “large response” (>200%). According to the Global Initiative for Asthma (GINA Citation2014), the minimal important difference for improvement and worsening in FEV1 based on asthmatic patient perception of change is about 10%.
Part 3: BMC analysis of sulfur dioxide
Among the 262 studies containing data on FEV1 and/or SRaw identified in Part 2, we searched in Part 3 for studies with data on each individual subject. A benchmark concentration (BMC) analysis was performed on SRaw data from five studies involving exposure to sulfur dioxide (breathing at rest from the mouth only). Curve-fitting was carried out with a nested set of exponential and Hill models (Slob Citation2002) using the R package PROAST version 32.2 (Slob & Cotton Citation2012) in R version 2.15.2 (R Core Team Citation2012). The concentration–response curves were fitted to the data employing subject status (asthmatic or healthy) as a covariant. A critical effect size of 20% SRaw was used, according to the definition of a “small”, but clear response above. A more detailed description of this procedure is given in the Supplementary material (Appendix E: “The BMC analysis”).
Criteria for study selection, data extraction and characteristics of the studies included
For all studies identified in Parts 1–3 of the present review, the definition of asthma, experimental design and exercise conditions were recorded, along with the chemical involved, its concentration and duration of exposure. The number of subjects, their age, gender, smoking habits and eventual use of corticosteroids were also noted. In most cases, the asthmatic subjects were diagnosed by a physician, according to the criteria for mild asthma of the American Thoracic Society (American Thoracic Society Citation1987) and were not allowed to undergo asthma therapy before or during the exposure. Although the severity of asthma and/or diagnostic criteria was not clearly stated in some studies, these subjects were also assumed to have mild asthma.
All experimental data utilized here originated from controlled chamber experiments at rest or during exercise (on a bicycle or treadmill) while breathing oronasally or through the mouth only. The intensity of exercise varied between light, moderate and heavy with a ventilation rate of 20–70 L/min.
Except for five studies involving 135–786 healthy individuals, the number of subjects varied from 4 to 66 including mostly adult men and women between 18 and 54 years of age (although some involved 8–17-year-old children or the elderly aged 60–89). Most of the studies were published between 1982 and 1999, the entire range being 1960–2014 (Seven studies from the 1950s considered in Part 2 did not present data on SRaw or FEV1). The duration of exposure varied from minutes to almost 8 h. The complete lists of the studies included in the analyses are presented in the Supplementary material (Appendices C and D).
Results
Part 1: Estimation of differential response factors on the basis of tests on healthy and asthmatic subjects under the same conditions
In total, 103 studies involving exposures of healthy and asthmatic subjects under the same conditions, including 19 chemicals and 11 mixtures/combined exposures (), fulfilled our quality criteria (), and were used to estimate EDRF values.
Table 3. Relative response by asthmatic versus healthy subjects to inhalation exposure, expressed as an overall EDRFTable Footnotea.
Sixteen of the 30 chemicals/mixtures were each investigated in one study only (). In contrast, nitrogen dioxide, ozone, sulfuric acid and sulfur dioxide were included in 61 of the 103 studies, and these four chemicals were therefore selected for comparative analysis of concentration–response relationships (Part 2).
The overall EDRFs are summarized in and a more detailed table with all of the studies, EDRFs and rationales is given in the Supplemental material, Appendix A. Asthmatics appear to be highly sensitive (respiratory effects and/or symptoms) to acute exposure of acetaldehyde, ammonium bisulfate, chlorine, nitrogen dioxide, ozone, sulfur dioxide, sulfuric acid, toluenediisocyanate, environmental tobacco smoke, ozone in ambient air and combined exposure to ozone and sulfur dioxide. The highest EDRF was derived from an experiment involving exposure to sulfur dioxide, where the concentration at which SRaw was increased significantly was five times lower for asthmatics, than healthy subjects (Sheppard et al. Citation1980). Based on eight studies, the overall EDRF for sulfur dioxide was estimated to be >2. EDRF values of 2 and 3 were estimated for chlorine and acetaldehyde, respectively.
The studies with ammonium bisulfate, nitrogen dioxide, ozone, sulfuric acid, toluenediisocyanate, environmental tobacco smoke, ozone in ambient air and combined exposure to ozone and sulfur dioxide resulted in EDRF values >1. There was no evidence for higher sensitivity among the asthmatics (EDRF = 1) to formaldehyde, zinc ammonium sulfate, diesel particles in ambient air and combined exposure to ozone and sulfuric acid. The remaining 15 chemicals/mixtures did not cause respiratory effects at the concentrations tested, therefore no conclusion regarding the sensitivity of asthmatics could be drawn.
Part 2: Comparative analysis of concentration–response relationships
Experimental studies involving exposure of healthy (220), asthmatic (134) subjects or both (61), to nitrogen dioxide, ozone, sulfuric acid and sulfur dioxide were identified. A complete reference list is available in the Supplementary material (Appendix D). These studies involved both oronasal and mouth-only breathing performed during exercise or at rest. Comparative evaluation of the concentration–response relationships, after exposures compared to baseline values, was based on two commonly employed outcomes, FEV1 and SRaw. Data from experiments involving oronasal breathing (FEV1, SRaw) or mouth-only breathing (FEV1) during exercise (FEV1) were included, but the data from the chamber experiments, with or without noseclip, performed under resting conditions (SRaw or FEV1) or with a noseclip during exercise (SRaw) were too few for analysis.
Part 2: Comparative analysis of concentration–response relationships for nitrogen dioxide
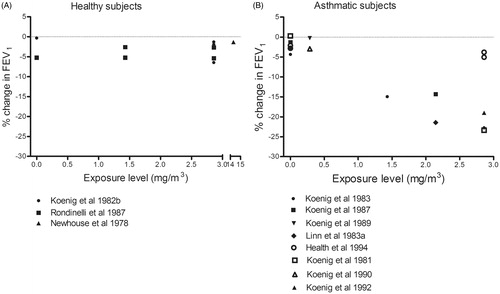
Asthmatics, but not healthy subjects, exhibited a moderate reduction in FEV1 (−10% to −20%) and moderate elevation of SRaw (100–200%) in response to oronasal inhalation of nitrogen dioxide at all concentrations while exercising and even after exposure to filtered air (). A single incidence of severe reduction in FEV1 (−34%) after mouth-only inhalation of nitrogen dioxide was seen in one group of asthmatics (Koenig et al. Citation1988), but not in any other groups of either asthmatics or healthy subjects (). No concentration–response relationship was observed in the concentration range explored (0–5.64 mg/m3).
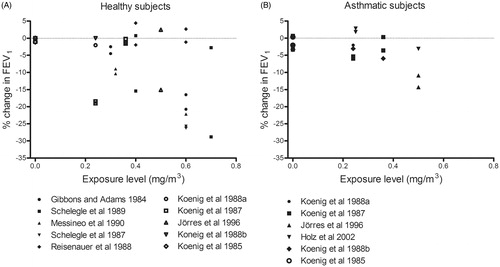
Figure 3. Percentage change (after/before exposure × 100) in FEV1 and SRaw in healthy and asthmatic subjects following exposure by inhalation (oronasal breathing) to nitrogen dioxide during exercise. Each dot represents the mean response of all subjects in a particular experiment or level of exposure.
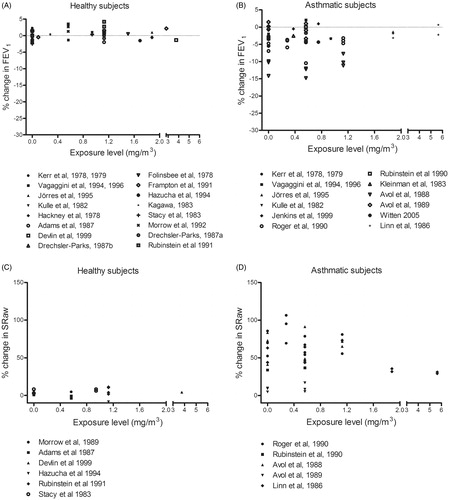
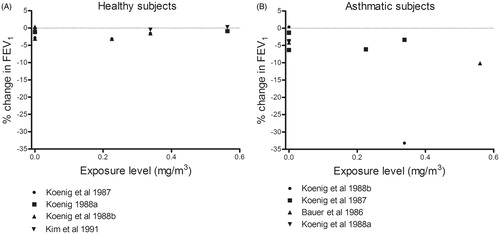
Figure 4. Percentage change (after/before exposure × 100) in FEV1 in healthy and asthmatic subjects following inhalation exposure (mouth-only breathing) to nitrogen dioxide during exercise. Each dot represents the mean response of all subjects in a particular experiment or level of exposure.
Part 2: Comparative analysis of concentration–response relationships for ozone
Both healthy and asthmatic subjects demonstrated moderate to severe airway responses to oronasal inhalation of ozone at concentrations >0.24 mg/m3 during exercise (). Small airway responses were also seen in both groups after exposure to filtered air (0 mg/m3 ozone), probably induced by the exercise. Both healthy and asthmatic subjects also showed moderate responses when exposed to similar concentrations of ozone by mouth-only breathing (). The concentration–response relationships for healthy and asthmatic subjects were similar within the concentration range examined (0–1.5 mg/m3).
Figure 5. Percentage change (after/before exposure × 100) in FEV1 and SRaw in healthy and asthmatic subjects following exposure by inhalation (oronasal breathing) to ozone during exercise. Each dot represents the mean response of all subjects in a particular experiment or level of exposure.
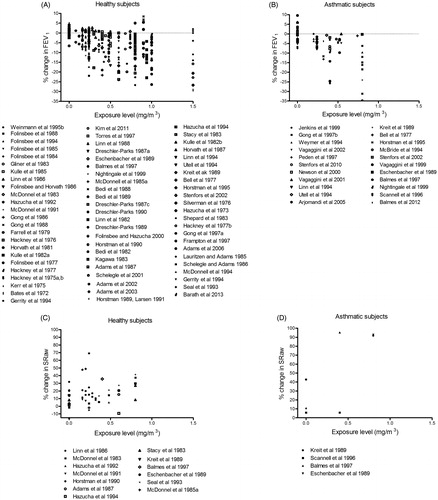
Figure 6. Percentage change (after/before exposure × 100) in FEV1 in healthy and asthmatic subjects following inhalation exposure (mouth-only breathing) to ozone during exercise. Each dot represents the mean response of all subjects in a particular experiment or level of exposure.
Part 2: Comparative analysis of concentration–response relationships for sulfuric acid
Asthmatics, but not healthy subjects, exhibited a moderate decrease in FEV1 and moderate enhancement of SRaw in response to oronasal inhalation of sulfuric acid at all concentrations and to filtered air (0 mg/m3) during exercise (). Avol et al. (Citation1988b) observed effects on FEV1 after exposure to sulfuric acid, but not after filtered air. In this case, the effects of sulfuric acid and filtered air on SRaw were not statistically different, suggesting that they were exercise-induced. Similarly, another study by this same group (Avol et al., Citation1988a) found that the effects of filtered air and sulfuric acid on FEV1 and SRaw did not differ significantly. In comparison to both baseline values (before exercise and the exposure) and after exposure to filtered air during exercise, one group of asthmatics did show a statistically significant moderate reduction in FEV1 following mouth-only inhalation exposure of 0.35 mg/m3 sulfuric acid (Utell et al., Citation1989) (). No concentration–response relationships were detected in the range of concentrations explored (0–2 mg/m3).
Figure 7. Percentage change (after/before exposure × 100) in FEV1 and SRaw in healthy and asthmatic subjects following exposure by inhalation (oronasal breathing) to sulfuric acid during exercise. Each dot represents the mean response of all subjects in a particular experiment or level of exposure.
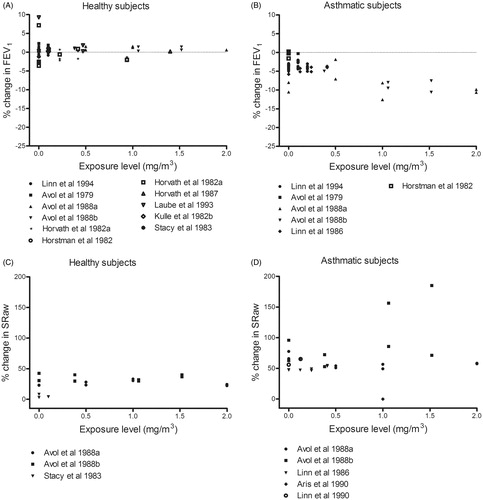
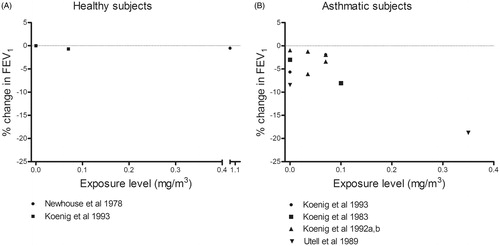
Figure 8. Percentage change (after/before exposure × 100) in FEV1 in healthy and asthmatic subjects following inhalation exposure (mouth-only breathing) to sulfuric acid during exercise. Each dot represents the mean response of all subjects in a particular experiment or level of exposure.
Part 2: Comparative analysis of concentration–response relationships for sulfur dioxide
During exercise with oronasal inhalation of sulfur dioxide, moderate and severe responses occurred in asthmatics, but not healthy subjects (). The effects in asthmatics were observed at concentrations >1 mg/m3 (highest concentration tested = 2.88 mg/m3), whereas healthy individuals showed no response even at 15 mg/m3. Small responses in FEV1 and SRaw were seen in asthmatics following control exposure to filtered air, probably induced by exercise (). Furthermore, mouth-only inhalation of sulfur dioxide at similar concentrations resulted in a severe reduction of FEV1 in the asthmatics, but not the healthy subjects. Both groups exhibited small airway responses after control exposure to filtered air ().
Figure 9. Percentage change (after/before exposure × 100) in FEV1 and SRaw in healthy and asthmatic subjects following exposure by inhalation (oronasal breathing) to sulfur dioxide during exercise. Each dot represents the mean response of all subjects in a particular experiment or level of exposure.
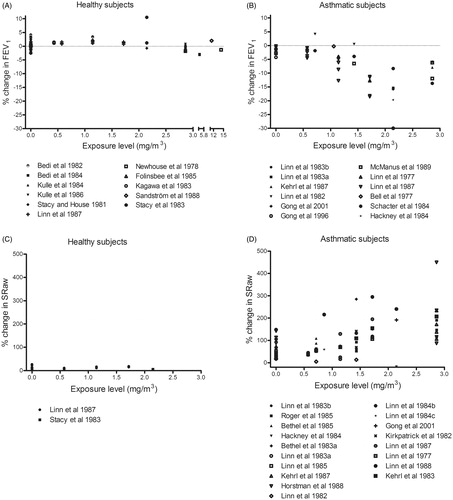
Figure 10. Percentage change (after/before exposure × 100) in FEV1 in healthy and asthmatic subjects following inhalation exposure (mouth-only breathing) to sulfur dioxide during exercise. Each dot represents the mean response of all subjects in a particular experiment or level of exposure.
Part 3: BMC analysis of sulfur dioxide
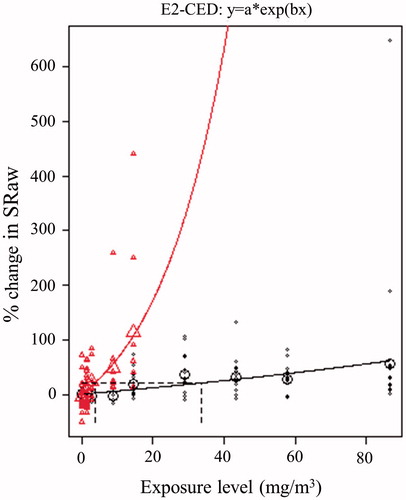
In addition to analyzing concentration–response relationships at the group level, we retrieved data on individual pulmonary function able for BMC analysis (healthy subjects: Lawther et al. Citation1975; Sheppard et al. Citation1980, asthmatics: Bethel et al. Citation1984; Jörres & Magnussen Citation1990; Sheppard et al. Citation1980). These were the only sets of comparable individual data available for all chemicals included in the present study. In total, these studies document SRaw responses following exposure to various levels of sulfur dioxide at rest in 21 healthy and 28 asthmatic subjects (). The highest concentrations tested in healthy and asthmatic subjects were 85.8 and 14.3 mg/m3, respectively. At these concentrations, members of both groups experienced severe impairment of lung function (SRaw >200%). Using 20% change in SRaw as the critical effect size, the BMC values were 33.7 and 3.7 mg/m3 in healthy and asthmatic subjects, respectively, resulting in an EDRF value of 9.
Figure 11. Benchmark concentration analysis of the increase in SRaw following exposure by inhalation to various levels of sulfur dioxide (in a chamber with a noseclip at rest). The upper and lower curves represent the best fits to the experimental data for asthmatics (Δ), and healthy subjects (o), respectively. The larger symbols depict mean values.
Discussion
Selection of the studies for consideration
The incomplete incorporation of experimental data on asthmatics associated with many regulatory programs for acute exposure may lower the trust for and efficiency of actions designed to protect human health (Johansson et al. Citation2012). Our own experience here shows that the use of technical support documents and the names of specific authors as search terms are good complements to the use of MeSH terms and key words when searching for experimental data on humans. In attempt to identify such studies available, we combined references from technical support documents with references obtained from standard computerized literature databases, an approach with characteristics similar to those of work flow and standard reporting items for systematic reviews (e.g. Moher et al. Citation2009). Employing a systematic flow, we assessed the data beginning with broad identification, followed by text screening and transparent evaluation of eligibility. This process identified a higher number of studies involving more chemicals than the previous report by Young et al. (Citation2009).
Factors that influence the sensitivity of asthmatics to airborne chemicals
Several factors, including temperature, the severity and phenotype of asthma, other pre-existing diseases, smoking and occupational exposure to chemicals might influence the sensitivity of persons with asthma and thereby confound the results of the present study. To reduce the variability between studies, we therefore applied a set of quality criteria ().
Bethel et al. (Citation1984) compared the airway responses of the same group of asthmatics to 1.43 mg/m3 sulfur dioxide at different temperature and found a severe elevation in SRaw (+222%) at −10.6 °C, but a smaller response (+38%) at 22.8 °C. Since temperature is likely to influence the result, all of the exposure studies included here were performed at temperatures between 18 and 25 °C or, as stated, “within room temperature”.
In one experimental comparison of the airway responses of mild and moderate/severe asthmatics to 0.57–1.7 mg/m3 (0.2–0.6 ppm) sulfur dioxide, those with moderate/severe asthma showed the largest impairments in SRaw and FEV1, but these differences were not statistically significant (Linn et al. Citation1987). The AF is not intended to protect hypersensitive sub-populations and studies on individuals with severe asthma were therefore excluded from the present analysis.
The asthma phenotype indicated, diagnosis of the disease and use of therapy varied between the studies and contribute to uncertainty in the EDRF calculations and concentration–response analysis (see Supplementary material, Appendix A for definitions of asthma and medical treatment in the studies considered in Part 1). We reduced the uncertainty related to asthma phenotype by excluding studies involving subjects who were described as having ongoing allergic symptoms. In addition, most of the studies specified that they were performed outside of pollen season and that their asthmatic subjects were not allowed to use inhalators during the period immediately preceding the study. In most studies, but not all, asthmatics were not allowed to use corticosteroid therapy for weeks or months prior to the experimental exposure. Corticosteroid therapy might underestimate the sensitivity among asthmatics due to its long-term effects.
In attempt to avoid effects on pulmonary function caused by factors other than the chemical/mixture of interest, only studies involving non-smokers and individuals with no previous known occupational or other extensive exposure to irritating or sensitizing air pollutants were included (). Individuals with other diseases, for example, Chronic Obstructive Pulmonary Disease (COPD), ischemic heart disease or allergy without asthma, were also excluded. In addition, studies on ozone-sensitive, otherwise healthy subjects, and smoke-sensitive atopic asthmatics were excluded.
Work load is an important consideration in the present analysis and studies performed either at rest or while exercising were included in Part 1. We adjusted for exercise-induced effects in the estimation of differential response factors by using exposure to filtered air as a control. Exercise was involved in all exposures in Part 2 () and the workload varied between light, moderate and heavy with ventilation rates of 20–70 L/min. The response in subjects after control exposures to filtered air are presented as exposure levels of 0 mg/m3 for each chemical. Exercise can impair pulmonary function in asthmatics. Hazucha et al. (Citation1987) found that such impairment by ozone was more pronounced at higher workloads. The exercise-induced effects on SRaw and FEV1 were adjusted for in a separate analysis presented in the Supplemental material (Appendix F: ).
Most adults (80–90%) utilize nasal breathing at rest, but shift to oronasal breathing during exercise when the minute ventilation rises to between 30 and 40 L/min (Kleinman Citation1984). Asthmatics are more likely, than healthy subjects, to perform oronasal breathing even at rest (Chadha et al. Citation1987). Mouth-only inhalation is somewhat artificial, by-passing the natural human scrubbing system in the nasal airways (Proctor Citation1981). In the present case, however, the results for exercising subjects breathing freely (oronasal) and through the mouth only did not differ significantly ().
Age might also influence our interpretations. Children, adolescents and young adults (<18 years of age) appear to demonstrate equivalent spirometric responses to short-term exposure to ozone, but their airway responses are slightly greater and they experience more symptoms than middle-aged and older adults exposed to comparable concentrations of ozone (US EPA Citation2007). A few studies with 8–17- and 60–89-year-olds were included here since their pattern of effects did not differ from available experimental findings on younger and middle-aged adults. Similar responses among all age groups were also supported by de Pee et al. (Citation1991). They observed no difference in the responses of children and adults, healthy or asthmatic, to a methacholine challenge. However, children and infants are two of the sub-populations often considered as more susceptible to the chronic exposure of many air pollutants, including ozone (Kim Citation2004). Mortimer et al. (Citation2000) examined 846 asthmatic children from urban areas for changes in peak expiratory flow (PEF) related to air pollution. Among all pollutants tested (sulfur dioxide, PM10, ozone and nitrogen dioxide) only ozone was associated with a change in morning PEF (Mortimer et al. Citation2000). Eighty percent of the alveoli develop postnatally and additional changes occur during adolescence (Dietert et al. Citation2000). Indeed, the effects from ambient air pollutants are most pronounced during the first year of life (Götschi et al. Citation2008).
Part 1: Estimation of differential response factors on the basis of tests on healthy and asthmatic subjects under the same conditions
Eleven of the 30 chemicals and mixtures examined produced a more pronounced response in asthmatics than healthy subjects (). Although it was possible to estimate differential response factors for acetaldehyde (3) and chlorine (2), in certain studies the LOAEL for healthy subjects was not determined for the concentrations selected for exposure resulting in EDRF values of >2 or >1. However, there was no difference in the responses of the groups to four chemicals/mixtures (EDRF = 1), i.e. formaldehyde, zinc ammonium sulfate, diesel particles in ambient air, and ozone and sulfuric acid in combination.
No EDRFs could be estimated for the 15 chemicals and mixtures that evoked no response at any concentration tested. Furthermore, there is substantial uncertainty involved in the estimation of EDRFs on the basis of LOAEL, which are strongly influenced by both the number of subjects and test concentrations. Moreover, the number of available studies varied: for 16 chemicals/mixtures our EDRFs were based on a single study, 11 were based on 2–8 studies and 14–25 studies were available for three of the chemicals. The overall EDRFs that were based on a single study were often estimated to be “inconclusive”. However, if judged to be of high quality, a single study on a chemical or mixture could be used as basis for the overall EDRF.
A similar analysis of the EDRFs for six chemicals was carried out by Young et al. (Citation2009) and in general, their estimates of 1–5 are similar to those arrived at here (). In their comparison of decrements in pulmonary function and symptoms of respiratory distress in healthy subjects and asthmatics, these investigators selected a single key study (or two) for each chemical, involving healthy and/or asthmatic individuals, as the basis for their calculations.
Part 2: Comparative analysis of concentration–response relationships for nitrogen dioxide
Pulmonary function appears to be more severely impaired in asthmatic than healthy subjects by exposure to nitrogen dioxide ( and ). However, there were no signs of a concentration–response relationship within the range of concentrations tested (up to 6 mg/m3). Furthermore, impairment in FEV1 and SRaw were even seen when breathing filtered air containing no nitrogen dioxide, suggesting that these effects may be exercise-induced. Here, we were unable to confirm the higher sensitivity of asthmatics observed in Part 1, where healthy and asthmatic subjects were tested under the same experimental conditions ().
Several thresholds for the respiratory effects of nitrogen dioxide have been proposed. A review of more than 50 articles involving chamber studies conducted by Hesterberg et al. (Citation2009) indicates that a guideline level for nitrogen dioxide in the range of 0.38–1.13 mg/m3 (0.2–0.6 ppm) is adequate to protect the health of both asthmatics and patients with COPD. Another analysis of 28 studies suggests that concentrations up to 1.13 mg/m3 do not exert a clinically relevant effect on airway hyper-responsiveness in asthmatics (Goodman et al. Citation2009). At the same time, an analysis of several other studies reveals inflammatory responses at 1.9 mg/m3 (2–3 h) and 0.49 mg/m3 (30 min) in healthy subjects and asthmatics, respectively (US EPA Citation2008). Moreover, non-specific airway responsiveness was observed at 2.9–3.8 mg/m3 (3 h) in a study involving only healthy subjects and at 0.38–0.56 mg/m3 (30 min) in another study with only asthmatics (US EPA Citation2008). Overall, the differences between the relevant LOAELs for healthy and asthmatic subjects in these other studies appear to be approximately four- to eightfold. Here, an EDRF > 1 was estimated in Part 1 supported by the studies above. However, we were not able to find a concentration–response relationship for either healthy or asthmatics in Part 2.
Part 2: Comparative analysis of concentration–response relationships for ozone
In contrast to the EDRF > 1 reported previously for ozone in Part 1 (), we found no difference in the response of asthmatic and healthy subjects to ozone (oronasal inhalation during exercise up to 1.5 mg/m3) ( and ). Small airway responses were seen in both these groups after breathing filtered air (0 mg/m3). From our figures the threshold for effects on pulmonary function can be estimated to be 0.24 mg/m3 for both groups.
In an early review, Folinsbee (Citation1981) concluded that, in general asthmatics are not overly sensitive to ozone, but that certain asthmatic individuals might be. However, only three experimental studies involving low levels of exposure were covered in that review. Five other reviews on healthy subjects exposed to ozone document statistically significant decrements in FEV1 (Brown et al. Citation2008; Goodman et al. Citation2013; Hazucha Citation1987; Mcdonnell et al. Citation2012; US EPA Citation2007). In the review by the US EPA (Citation2007), covering six studies with exposure levels of 0.08–0.24 mg/m3 (0.04–-0.48 ppm), adverse effects on FEV1 began at 0.12 mg/m3 and became statistically significant at 0.16 mg/m3. No studies involving controlled exposures of asthmatics were included in that report, but it was stated that “new data on airway responsiveness, inflammation, and various molecular markers of inflammation and bronchoconstriction indicate that people with asthma and allergic rhinitis (with or without asthma) comprise susceptible groups for O3-induced adverse effects”. In their review, Brown et al. (Citation2008) include a paired comparison of 30 healthy subjects exposed to 0.12–0.16 mg/m3 (0.06–0.08 ppm) ozone, where the effect levels are without clinical significance (i.e. <3% decrease). The earliest review by Hazucha (Citation1987) compares data from 24 studies on healthy subjects to ranges of 0.22–1.54 mg/m3 (0.11–0.77 ppm) during physical exercise at four different levels of intensity (ventilation rates of ≤23, 24–43, 43–63 and ≥64 L/min during light, moderate, heavy and very heavy exercise, respectively). Regression analysis of the FEV1 values revealed that statistical significance was reached above 0.4 mg/m3 during light exercise and above 0.1 mg/m3 during very heavy exercise. The review by Mcdonnell et al. (Citation2012) fits data from 23 studies into a human exposure-response model. The most recent review by Goodman et al. (Citation2013) evaluates pulmonary function in four controlled chamber studies where healthy subjects were exposed to ozone at levels relevant to the National Ambient Air Quality Standard of 0.15 mg/m3 (0.075 ppm) and the authors conclude that no adverse effects occur below this level (Goodman et al. Citation2013). These findings on healthy subjects agree with our observation that no effects were seen here below 0.24 mg/m3. Overall, the previous review by Folinsbee (Citation1981) suggests that asthmatics are more sensitive to ozone than healthy subjects. This supports our EDRF of >1 in Part 1 but we were not able to confirm this difference in Part 2.
Part 2: Comparative analysis of concentration–response relationships for sulfuric acid
Similar to what was observed for nitrogen dioxide, upon exposure to sulfuric acid by oronasal () as well as mouth-only breathing (), asthmatics, but not healthy subjects, exhibited moderate or severe responses in SRaw and/or FEV1. At the same time, small responses were apparent in asthmatics following exposure to filtered air (0 mg/m3 sulfuric acid), implying the existence of an exercise-induced effect. Overall, the findings with oronasal breathing indicate that pulmonary function is impaired by about 1 mg/m3 in asthmatics, but remains normal in healthy subjects up to 2 mg/m3. Similarly, with mouth-only breathing the FEV1 was reduced by 0.35 mg/m3 in asthmatics, but unaffected in healthy subjects at levels as high as 1.1 mg/m3. These findings indicate an ERDF above 2 or 3, in support of the EDRF > 1 previously identified in Part 1 (). No earlier reviews covering experimental data concerning the effects of sulfuric acid on individuals with asthma could be found in the literature.
Part 2: Comparative analysis of concentration–response relationships for sulfur dioxide
Our compilation of studies concerning exposure to sulfur dioxide indicates a reduction in FEV1 at around 1 mg/m3 in asthmatics, but no effect in healthy subjects up to 15 mg/m3. These results argue for an AF of at least 10. These effects were similar with both oronasal () and mouth-only () inhalation. Regarding SRaw (), a concentration–response relationship is apparent for asthmatics, although a small response, probably induced by exercise, seen when asthmatics are exposed to filtered air.
Fifty-five controlled short-term exposure studies of respiratory health-effects in asthmatic subjects are covered in a review that has played an integral role in the integrated assessment of sulfur oxides by the US EPA (Johns & Linn Citation2011). These same authors analyzed the concentration–response relationships for sulfur dioxide presented in five articles on asthmatic subjects and showed enhanced bronchoconstrictive responsiveness between 0.57 and 2.86 mg/m3 (0.2 and 1 ppm) (Johns et al. Citation2010). A report by the US EPA (Citation2009) concluded that “It has been clearly established that subjects with asthma are more sensitive to the respiratory effects of SO2 exposure than healthy individuals without asthma”.
Ten controlled exposure studies on asthmatics described in that report reveal moderate or greater impairment of pulmonary function (SRaw ≥100% and a ≥15% reduction in FEV1) in exercising asthmatics exposed to concentrations as low as 0.57–0.86 mg/m3 (0.2–0.3 ppm) for as little as 5–10 min (Bethel et al. Citation1983; Gong et al. Citation1995; Linn et al. Citation1983,Citation1984,Citation1987,Citation1988,Citation1990; Magnussen et al. Citation1990; Roger et al. Citation1985; Trenga et al. Citation1999). In addition, the severity of impairment and proportions of individuals affected rose with increasing concentrations of sulfur dioxide, with severe impairment (SRaw ≥200%, and/or a ≥20% decrease in FEV1) and respiratory symptoms being observed at levels of ≥1.1 mg/m3. Our present compilation confirms these previous findings.
Part 2: Duration of exposures associated with these concentration–response analyses
In general, both the concentration and duration of exposure may influence the risk of deleterious health effects from chemicals. In the present evaluation, the duration of exposure was not taken into consideration neither when estimating the EDRF, nor when analyzing concentration–response relationships. For the experimental studies included in , this duration varied between 5 min and 8 h. However, replacement of the factor concentration by concentration × time in the response graphs () did not result in any change (see in Appendix B). Mild sensory effects are generally not cumulative over a range of exposures of 10 min to 8 h. Individuals may adapt or become inured to sensory irritation developed from exposure to irritant chemicals such that the warning properties are reduced (NRC Citation2001, p. 108). Consequently the derived AEGL-1 values for nitrogen dioxide, sulfuric acid and sulfur dioxide are identical for all durations up to 8 h, suggesting that the mild effects of which these values are based are not time-dependent. In addition, it is stated that most of bronchoconstriction caused by sulfur dioxide occurs within 10 min and therefore the AEGL-2 values are also held constant across the exposure durations (NRC Citation2010).
Part 3: BMC analysis of sulfur dioxide
As mentioned earlier, LOAEL-based EDRFs are often uncertain or inconclusive, mainly due to lack of data, the inclusion of few subjects in available studies and extensive inter-individual variability. LOAEL values are highly sensitive to the concentrations tested and, moreover, pronounced inter-individual variability at any concentration will result in higher LOAEL values, since these are based on pairwise comparison with control data. Thus, the BMC approach to comparative analysis of concentration–response relationships is to be preferred. No such analysis of experimental findings on healthy and asthmatic subjects has, to our knowledge, been reported previously. A BMC analysis combines all available data to obtain a mathematical description of the concentration–response relationship for comparison of pre-defined levels of response.
Here, we considered observations on the pulmonary function of each individual subject exposed to sulfur dioxide (at rest while wearing noseclip) rather than group data. The BMC values for a 20% change in SRaw were 33.7 and 3.7 mg/m3 for healthy and asthmatic subjects, respectively, resulting in an EDRF of 9 (), which is higher than the value of 3–4 suggested by Young et al. (Citation2009) ().
Table 4. Comparison of our findings to a previous assessment of differences in the responses of asthmatic and healthy subjects to irritant gases.
Conclusions
Our current review of 103 studies in Part 1 represents, to our knowledge, the most extensive compilation to date of experimental studies on asthmatic and healthy subjects exposed under the same conditions. The analyses of comparative–response relationships and estimation of EDRF values indicate that asthmatics are more susceptible to the deleterious effects of inhalation exposure to many irritants than healthy subjects. In the case of several of the irritants we included studies providing sufficient LOAEL data on healthy subjects were lacking, so the overall EDRFs for these chemicals were estimated to >1 or >2. The findings on almost half of the chemicals and mixtures were inconclusive, due to a lack of significant effects at the concentrations tested.
In addition, we analyzed the concentration–response relationships of four chemicals to characterize differences between asthmatic and healthy individuals. The effects of exposure to nitrogen dioxide on asthmatics are similar to those observed following control exposure to filtered air, indicating that these effects were induced by exercise rather than the chemical. The concentration–response relationships for ozone showed that healthy and asthmatic subjects are equally susceptible to ozone during exercise. Asthmatics appear to be more susceptible to sulfuric acid and sulfur dioxide than healthy subjects.
Our BMC analysis of individual data concerning sulfur dioxide revealed a differential response factor of 9, indicating that for sulfur dioxide, and maybe also other irritants, the default AF lower than 10 may not be adequate for the protection of asthmatics.
Although available data on individual chemicals are often inconclusive, overall, the experimental findings on inter-individual variation provide support for the use of an AF of 10 to estimate the level of exposure below which respiratory symptoms and impairment of pulmonary function are not likely to occur in the general population including asthmatics. However, further studies on healthy and asthmatic subjects employing state-of-the-art quality standards are required to obtain more precise AFs for asthmatics. Such studies should be designed to determine NOAELs and LOAELs for both healthy and asthmatic subjects and preferably be performed at rest in order to avoid exercise-induced effects.
Supplementary data
Supplementary material available online at http://dx.doi.org/10.3109/10408444.2015.1092498
Johansson_et_al._Supplementary_Material_Appendices.zip
Download Zip (1.3 MB)Acknowledgements
We thank Joakim Ringblom for technical assistance with the BMC analysis. We would also like to thank Professor Joseph W. DePierre for carefully editing the text. The authors gratefully acknowledge the extensive comments offered by two anonymous reviewers selected by the Editor, careful consideration of these comments aided in revising and improving the paper.
Declaration of interest
The authors acknowledge that Professor Gunnar Johanson is a member of the SCOEL and has been a member of the NAS Subcommittee on AEGL. Dr Mattias Öberg has been a member of the AEGL Advisory Committee. The authors’ affiliations are as shown on the cover page. We take sole responsibility for the writing and content of this paper. The project was performed at the National Center for Disaster Toxicology with financial support from the Swedish National Board of Health and Welfare and the Swedish Civil Contingencies Agency [44668/2012 and 15523/2011]
References
- American Thoracic Society. Standards for the diagnosis and care of patients with chronic obstructive pulmonary disease (COPD) and asthma. Am Rev Respir Dis 1987;136:225–243.
- Avol EL, Linn WS, Whiteman JD, Whynot JD, Anderson KR, Hackney JD. Short-term respiratory effects of sulfuric acid in fog: a laboratory study of healthy and asthmatic volunteers. JAPCA 1988a;38:258–263.
- Avol EL, Linn WS, Whynot JD, Anderson KR, Shamoo DA, Valencia LM, Little DE, Hackney JD. Respiratory dose-response study of normal and asthmatic volunteers exposed to sulfuric acid aerosol in the sub-micrometer size range. Toxicol Ind Health 1988b;4:173–184.
- Bethel RA, Epstein J, Sheppard D, Nadel JA, Boushey HA. Sulfur dioxide-induced bronchoconstriction in freely breathing, exercising, asthmatic subjects. Am Rev Respir Dis 1983;128:987–990.
- Bethel RA, Sheppard D, Epstein J, Tam E, Nadel JA, Boushey HA. Interaction of sulfur dioxide and dry cold air in causing bronchoconstriction in asthmatic subjects. J Appl Physiol Respir Environ Exerc Physiol 1984;57:419–423.
- Brown JS, Bateson TF, Mcdonnell WF. Effects of exposure to 0.06 ppm ozone on FEV1 in humans: a secondary analysis of existing data. Environ Health Perspect 2008;116:1023–1026.
- Chadha TS, Birch S, Sackner MA. Oronasal distribution of ventilation during exercise in normal subjects and patients with asthma and rhinitis. Chest 1987;92:1037–1041.
- Damgård Nielsen G, Wolkoffa P, Alarie Y. Sensory irritation: risk assessment approaches. Regul Toxicol Pharmacol 2007;48:6–18.
- de Pee S, Timmers MC, Hermans J, Duiverman EJ, Sterk PJ. Comparison of maximal airway narrowing to methacholine between children and adults. Eur Respir J 1991;4:421–428.
- Dietert RR, Etzel RA, Chen D, Halonen M, Holladay SD, Jarabek AM, Landreth K, et al. Workshop to identify critical windows of exposure for children's health: immune and respiratory systems work group summary. Environ Health Perspect 2000;108:483–490.
- Dorne JLCM, Renwick AG. The refinement of uncertainty/safety factors in risk assessment by the incorporation of data on toxicokinetic variability in humans. Toxicol Sci 2005;86:20–26.
- ECETOC (European Centre for Ecotoxicology and Toxicology of Chemicals). Derivation of assessment factors for human health risk assessment. Technical Report No. 86. Brussels: European Centre for Ecotoxicology and Toxicology of Chemicals; 2003.
- ECHA (European Chemicals Agency). (2010). Chapter R.8: characterisation of dose [concentration]–response for human health. Available from: http://echa.europa.eu/documents/10162/13632/information_requirements_r8_en.pdf [last accessed 1 Nov 2012].
- Eder W, Ege MJ, von Mutius E. The asthma epidemic. N Engl J Med 2006;355:2226–2235.
- Falk-Filipsson A, Hanberg A, Victorin K, Warholm M, Wallen M. Assessment factors – applications in health risk assessment of chemicals. . Environ Res 2007;104:108–127.
- Folinsbee LJ. Effects of ozone exposure on lung function in man: a review. Rev Environ Health 1981;3:211–240.
- GINA GIFA. (2014). The global strategy for asthma management and prevention. Available from: http://www.ginasthma.org/ [last accessed 28 Jan 2015].
- Gong H, Jr, Lachenbruch PA, Harber P, Linn WS. Comparative short-term health responses to sulfur dioxide exposure and other common stresses in a panel of asthmatics. Toxicol Ind Health 1995;11:467–487.
- Goodman JE, Chandalia JK, Thakali S, Seeley M. Meta-analysis of nitrogen dioxide exposure and airway hyper-responsiveness in asthmatics. Crit Rev Toxicol 2009;39:719–742.
- Goodman JE, Prueitt RL, Chandalia J, Sax SN. Evaluation of adverse human lung function effects in controlled ozone exposure studies. J Appl Toxicol 2013;34:516–524.
- Götschi T, Heinrich J, Sunyer J, Künzli N. Long-term effects of ambient air pollution on lung function: a review. Epidemiology 2008;19:690–701.
- Hakkert BC, Stevenson H, Bos PM, van Hemmen JJ. Methods for establishment of health based recommended occupational limits for existing substances. TNO Report 1996:V96.463. Zeist: TNO, Nutrition and Food Research; 1996.
- Hazucha MJ. Relationship between ozone exposure and pulmonary function changes. J Appl Physiol 1987;62:1671–1680.
- Hesterberg TW, Bunn WB, Mcclellan RO, Hamade AK, Long CM, Valberg PA. Critical review of the human data on short-term nitrogen dioxide (NO2) exposures: evidence for NO2 no-effect levels. Crit Rev Toxicol 2009;39:743–781.
- IPCS (International Panel on Chemical Safety). Environmental Health Criteria No. 170: assessing human health risks of chemicals: derivation of guidance values for health-based exposure limits. Geneva: World Health Organization; 1994.
- IPCS (International Panel on Chemical Safety). PCS risk assessment terminology. Part 1: IPCS/OECD key generic terms used in chemical hazard/risk assessment. Part 2: IPCS glossary of key exposure assessment terminology. Geneva: World Health Organization, International Programme of Chemical Safety; 2004.
- IPCS (International Panel on Chemical Safety). Chemical-specific adjustment factors (CSAFs) for interspecies differences and human variability: guidance document for the use of data in dose/concentration–response assessment. WHO/IPCS/01.4. Geneva: International Panel on Chemical Safety, World Health Organization; 2005. pp 1–96.
- Johansson MK, Johanson G, Öberg M. How are asthmatics included in the derivation of guideline values for emergency planning and response? Regul Toxicol Pharmacol 2012;63:461–470.
- Johns DO, Linn WS. A review of controlled human SO2 exposure studies contributing to the US EPA integrated science assessment for sulfur oxides. Inhal Toxicol 2011;23:33–43.
- Johns DO, Svendsgaard D, Linn WS. Analysis of the concentration–respiratory response among asthmatics following controlled short-term exposures to sulfur dioxide. Inhal Toxicol 2010;22:1184–1193.
- Jörres R, Magnussen H. Airways response of asthmatics after a 30 min exposure, at resting ventilation, to 0.25 ppm NO2 or 0.5 ppm SO2. Eur Respir J 1990;3:132–137.
- Kalberlah F, Schneider K. Quantification of extrapolation factors. Final Report of the Research Project No. 116 06 113 of the Federal Environmental Agency. Wirtschaftsverl, NW: Verlag für Neue Wiss; 1998.
- Kim JJ. Ambient air pollution: health hazards to children. Pediatrics 2004;114:1699–1707.
- Kleinman MT. Sulfur dioxide and exercise: relationships between response and absorption in upper airways. J Air Pollut Control Assoc 1984;34:32–37.
- Koenig JQ, Pierson WE, Covert DS, Marshall SG, Morgan MS, van Belle G. The effects of ozone and nitrogen dioxide on lung function in healthy and asthmatic adolescents. Res Rep Health Eff Inst 1988;5–24.
- Lawther PJ, Macfarlane AJ, Waller RE, Brooks AG. Pulmonary function and sulphur dioxide, some preliminary findings. Environ Res 1975;10:355–367.
- Linn WS, Avol EL, Peng R, Shamoo DA, Hackney JD. Replicated dose–response study of sulfur dioxide effects in normal, atopic, and asthmatic volunteers. Am Rev Respir Dis 1987;136:1127–1134.
- Linn WS, Avol EL, Shamoo DA, Peng RC, Spier CE, Smith MN, Hackney JD. Effect of metaproterenol sulfate on mild asthmatics' response to sulfur dioxide exposure and exercise. Arch Environ Health 1988;43:399–406.
- Linn WS, Avol EL, Shamoo DA, Venet TG, Anderson KR, Whynot JD, Hackney JD. Asthmatics' responses to 6-hr sulfur dioxide exposures on two successive days. Arch Environ Health 1984;39:313–319.
- Linn WS, Shamoo DA, Peng RC, Clark KW, Avol EL, Hackney JD. Responses to sulfur dioxide and exercise by medication-dependent asthmatics: effect of varying medication levels. Arch Environ Health 1990;45:24–30.
- Linn WS, Venet TG, Shamoo DA, Valencia LM, Anzar UT, Spier CE, Hackney JD. Respiratory effects of sulfur dioxide in heavily exercising asthmatics. A dose–response study. Am Rev Respir Dis 1983;127:278–283.
- Magnussen H, Jorres R, Wagner HM, von Nieding G. Relationship between the airway response to inhaled sulfur dioxide, isocapnic hyperventilation, and histamine in asthmatic subjects. Int Arch Occup Environ Health 1990;62:485–491.
- Mcdonnell WF, Stewart PW, Smith MV, Kim CS, Schelegle ES. Prediction of lung function response for populations exposed to a wide range of ozone conditions. Inhal Toxicol 2012;24:619–633.
- Moher D, Liberati A, Tetzlaff J, Altman DG, The PRISMA Group. Preferred reporting items for systematic reviews and meta-analyses: the PRISMA statement. PLoS Med 2009;6:e1000097
- Mortimer KM, Tager IB, Dockery DW, Neas LM, Redline S. The effect of ozone on inner-city children with asthma: identification of susceptible subgroups. Am J Respir Crit Care Med 2000;162:1838–1845.
- NRC (US National Research Council). Standing operating procedures for developing acute guideline levels for hazardous chemicals. Washington (DC): NRC; 2001.
- NRC (US National Research Council). Acute exposure guideline levels for selected airborne chemicals. Vol. 8: Committee on acute exposure guideline level;. Committee on Toxicology; National Research Council; 2010. p. 464. ISBN: 0-309-14516-3. Available from: http://www.epa.gov/oppt/aegl/pubs/sulfurdioxide_final_volume8_2010.pdf [last accessed 11 Mar 2015].
- Öberg M, Palmen N, Johanson G. Discrepancy among acute guideline levels for emergency response. J Hazard Mater 2010;184:439–447.
- Proctor DF. Oronasal breathing and studies of effects of air pollutants on the lungs. Am Rev Respir Dis 1981;123:242–243.
- R Core Team. R: A language and environment for statistical computing.Vienna: R Foundation for Statistical Computing; 2012. Available from: http://www.R-project.org/ [last accessed 28 Jan 2015].
- Renwick AG. Safety factors and establishment of acceptable daily intakes. Food Addit Contam 1991;8:135–149.
- Renwick AG. Data-derived safety factors for the evaluation of food additives and environmental contaminants. Food Addit Contam 1993;10:275–305.
- Roger LJ, Kehrl HR, Hazucha M, Horstman DH. Bronchoconstriction in asthmatics exposed to sulfur dioxide during repeated exercise. J Appl Physiol 1985;59:784–791.
- Sheppard D, Wong WS, Uehara CF, Nadel JA, Boushey HA. Lower threshold and greater bronchomotor responsiveness of asthmatic subjects to sulfur dioxide. Am Rev Respir Dis 1980;122:873–878.
- Slob W. Dose–response modeling of continuous endpoints. Toxicol Sci 2002;66:298–312.
- Slob W, Cotton R. Proast: benchmark dose modelling. R package, version 32.2. National Institute for Public Health and the Environment (RIVM); 2012. Available from: http://www.rivm.nl/en/Documents_and_publications/Scientific/Models/PROAST [last assessed 10 Oct 2012].
- Trenga CA, Koenig JQ, Williams PV. Sulphur dioxide sensitivity and plasma antioxidants in adult subjects with asthma. Occup Environ Med 1999;56:544–547.
- US EPA (U.S. Environmental Protection Agency). Recommendations for and documentation of biological values for use in risk assessment. Washington, DC: U.S. Environmental Protection Agency; PB-179874: EPA 600/6-87/008. 1988. p 395. Available from: http://cfpub.epa.gov/ncea/cfm/recordisplay.cfm?deid=34855#Download [last assessed 1 Nov 2013].
- US EPA (U.S. Environmental Protection Agency). IRIS referense dose (RfD): description and use in health risk assessments. 1993. p 19. Available from: http://www.epa.gov/iris/rfd.htm [last accessed 1 Nov 2013].
- US EPA (U.S. Environmental Protection Agency). Review of the national ambient air quality standards for ozone: policy assessment of scientific and technical information (QAQPS Staff Paper). Research Triangle Park (NC): Office of Air Quality Planning and Standards; 2007.
- US EPA (U.S. Environmental Protection Agency). Final Report: Integrated science assessment for oxides of nitrogen health criteria. Washington, DC: U.S. Environmental Protection Agency. EPA/600/R-08/071; 2008. 260 pp. Available from: http://cfpub.epa.gov/ncea/isa/recordisplay.cfm?deid=194645 [last assessed 1 Nov 2013]..
- US EPA (U.S. Environmental Protection Agency). Risk and exposure assessment to support the review of the SO2 primary national ambient air quality standard: final report. Research Triangle Park (NC): Office of Air Quality Planning and Standards; 2009.
- Utell M, Mariglio JA, Morrow PE, Gibb FR, Speers DM. Effects of inhaled acid aerosols on respiratory function: the role of endogenous ammonia. J. Aerosol Med 1989;2:141–147.
- WHO (World Health Organization). Asthma. 2013. Available from: http://www.who.int/mediacentre/factsheets/fs307/en/index.html. [last accessed 31 Oct 2013].
- Young RA, Bast CB, Wood CS, Adeshina F. Overview of the standing operating procedure (SOP) for the development of Provisional Advisory Levels (PALs). Inhal Toxicol 2009;21:1–11.