
Abstract
Enhancers are short regulatory sequences bound by sequence-specific transcription factors and play a major role in the spatiotemporal specificity of gene expression patterns in development and disease. While it is now possible to identify enhancer regions genomewide in both cultured cells and primary tissues using epigenomic approaches, it has been more challenging to develop methods to understand the function of individual enhancers because enhancers are located far from the gene(s) that they regulate. However, it is essential to identify target genes of enhancers not only so that we can understand the role of enhancers in disease but also because this information will assist in the development of future therapeutic options. After reviewing models of enhancer function, we discuss recent methods for identifying target genes of enhancers. First, we describe chromatin structure-based approaches for directly mapping interactions between enhancers and promoters. Second, we describe the use of correlation-based approaches to link enhancer state with the activity of nearby promoters and/or gene expression. Third, we describe how to test the function of specific enhancers experimentally by perturbing enhancer–target relationships using high-throughput reporter assays and genome editing. Finally, we conclude by discussing as yet unanswered questions concerning how enhancers function, how target genes can be identified, and how to distinguish direct from indirect changes in gene expression mediated by individual enhancers.
Introduction
There are two main types of regulatory elements involved in transcriptional activation, promoters, and enhancers. Whereas promoters are easy to identify, usually defined as a distance that spans a few kilobasepair (kB) on either side of a transcription start site (TSS) of a coding or noncoding gene, enhancers are more elusive. Enhancers, first identified in viral genomes more than 30 years ago (Banerji et al., Citation1981), were initially defined simply as DNA fragments that are located outside of core promoter regions and that can increase transcription from a particular gene. Early studies in which enhancers were removed from their normal genomic location and analyzed in reporter assays indicated that their enhancing activities can be independent from their exact location or orientation relative to the activated promoter [reviewed in (Bulger & Groudine, Citation2011; Plank & Dean, Citation2014)], suggesting that enhancers can be located at long distances upstream or downstream of target genes. Although the early reporter assays did not identify the natural target(s) of the tested enhancers, the hypothesis that most enhancers work at a distance has been adopted as a general consensus in the field. Multiple models have been proposed to explain how enhancers regulate transcription of a target gene from a distance (Blackwood & Kadonaga, Citation1998; Bulger & Groudine, Citation2011). The two most common models are “scanning or tracking”, in which TF-containing protein complexes bind at an enhancer and diffuse (perhaps via rapid on/off events) along the genome to search for a target promoter (Blackwood & Kadonaga, Citation1998) and “looping”, in which an enhancer directly interacts with a target promoter by forming a physical interaction mediated by protein–protein contact (Blackwood & Kadonaga, Citation1998; Bulger & Groudine, Citation1999) (). The “scanning” model is consistent with a proposed mechanism by which insulator proteins such as CTCF function (i.e. by creating distinct chromatin domains on either side of the bound protein). One study in support of this model detected short RNAs transcribed from the DNA between an enhancer and the nearest promoter (Zhu et al., Citation2007) and the second study observed that TF-containing protein complexes, which include RNA polymerase II, bind at the DNA between an enhancer and nearby gene promoter (Hatzis & Talianidis, Citation2002). The “scanning” model implies that an enhancer should regulate the nearest active promoter and thus would not be consistent with long-range interactions in which an enhancer bypasses multiple promoters to regulate a more distally located gene (Wang et al., Citation2005). Although it is possible that some enhancers function via the “scanning” model and some function via the “looping” model, recent evidence provided by multiple nuclear architecture studies (Krivega et al., Citation2014; Tolhuis et al., Citation2002) has tipped the balance in support of the “looping” model.
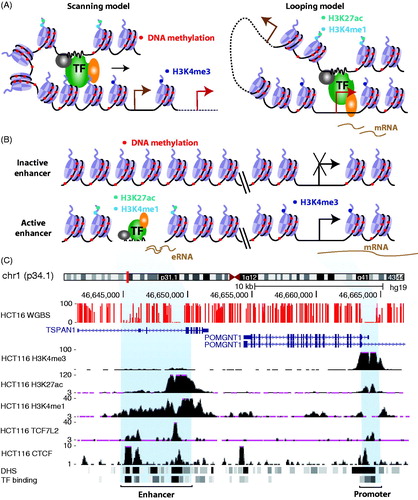
Figure 1. Enhancer-mediated gene regulation. (A) Shown are two models for gene regulation by enhancers. The left panel illustrates the “scanning or tracking” model in which a transcription factor (TF)-containing protein complex binds at an enhancer and moves along the genome, searching for a target promoter (the nearest promoters are labeled in brown and distal promoters are labeled in red). The right panel illustrates the “looping” model in which an enhancer directly interacts with a target promoter by forming a DNA loop mediated by protein–protein contacts. (B) Shown is an illustration of the distinctive chromatin signatures at active versus inactive enhancers and promoters. Active enhancers provide nucleosome-free regions for the binding of clusters of TFs and are flanked by nucleosomes marked by H3K4me1 (cyan dots) and H3K27ac (green dots); active promoters have flanking nucleosomes marked by H3K4me3 (blue dots). CpG sites throughout the human genome have high levels of DNA methylation (red dots) except at active enhancers and promoters. (C) DNA methylation (WGBS), ENCODE ChIP-seq data (labeled according to the antibody used in each experiment), and the location of DHSs and TF binding data for HCT116 cells from the University of California, Santa Cruz genome browser are shown for an enhancer and a promoter region. (See the color version of this figure at www.informahealthcare.com/bmg).
In the looping model, two genomic regions separated by a distance are brought together via protein–protein interactions mediated by transcription factors bound at a distal element and at a promoter. One ramification of this model is that it should be possible to identify distal enhancers by the location of transcription factor (TF) binding motifs. Unfortunately, TF-binding motifs are usually less than 10 nts in length (Stewart et al., Citation2012) and thus are found throughout the genome, making it difficult to identify an enhancer using only bioinformatics approaches. However, recent improvements in genomewide technologies, such as ChIP-seq and DNase-seq (ENCODE_Project_Consortium, Citation2012; Thurman et al., Citation2012), now allow what is thought to be a comprehensive identification of distal regulatory regions within a given cell type. The most common distal regulatory elements are DNase I hypersensitive sites (DHSs), which are regions of nucleosome-free chromatin that harbor clusters of transcription factor (TF)-binding sites (ENCODE_Project_Consortium, Citation2012; Roadmap Epigenomics Consortium, Citation2015). There are estimated to be ∼3 million DHSs in the human genome, although not all DHSs are present in a given cell type (Thurman et al., Citation2012) and different subsets of DHSs have flanking regions marked by specifically modified histones that are thought to distinguish enhancers from promoters. For example, potentially active enhancers have flanking regions with well-positioned nucleosomes in which histone H3 is marked by monomethylation (H3K4me1) (Heintzman et al., Citation2007) and fully active enhancers have flanking regions with well-positioned nucleosomes in which histone H3 is marked not only by the monomethylation of lysine 4 but also by acetylation of lysine 27 (H3K27Ac) (Heintzman et al., Citation2009; Rada-Iglesias et al., Citation2011); (). Enhancers also have low levels of histone H3 trimethylated on lysine 4 (H3K4me3). In contrast, promoters are marked by high levels of H3K4me3, low levels of H3K4me1, and variable levels of H3K27Ac. In addition to modified histones and site-specific DNA-binding TFs, such as TCF7L2, transcriptional coactivators, such as EP300 and CBP, also localize at enhancer regions (Blow et al., Citation2010; Visel et al., Citation2009a). The combination of DHSs, modified histones, and TFs has allowed the identification of putative enhancer elements throughout the genome in more than 100 cell types (Roadmap Epigenomics Consortium, Citation2015; Whitaker et al., Citation2015). Recent studies have also shown that enhancers can be identified as distal regions that have low levels of DNA methylation (ENCODE_Project_Consortium, Citation2012; Roadmap Epigenomics Consortium, Citation2015; Stadler et al., Citation2011; Thurman et al., Citation2012).
Reporter assays using model organisms have revealed a high degree of spatiotemporal cell-type specificity of enhancers. An early genomewide ChIP-seq study in human cells compared undifferentiated embryonic stem cells (hESCs) to induced early mesendoderm or neuroepithelium cells, finding that the enhancer marks showed cell-type-specific patterns but that the promoter mark H3K4me3 was largely invariant across cell types (Hawkins et al., Citation2011). A large ChIP-seq study across seven developmental time points and three developmental lineages showed a very high degree of lineage and temporal specificity at enhancer regions, but very few differences in promoter regions (Nord et al., Citation2013). In addition, a recent study comparing enhancers in many different types of human cells has shown that different cell lineages can be revealed using enhancer marks (Roadmap Epigenomics Consortium, Citation2015). It is thought that cell-type-specific enhancers bound by critical lineage-specifying transcription factors help to orchestrate the precise order of expression of both protein-coding genes (e.g. SHH (Petit et al., Citation2015)) and noncoding RNAs (e.g. let-7 family microRNAs (Cohen et al., Citation2015)), to ensure proper development and differentiation (Boland et al., Citation2014; Buecker & Wysocka, Citation2012; Rada-Iglesias et al., Citation2012).
Considering the important role of enhancers in orchestrating development and differentiation, it is not surprising that many diseases are associated with changes in enhancer activity. Mutations in sequence-specific enhancer-binding TFs (e.g. GATA factors (Zheng & Blobel, Citation2010) and Hox factors (Quinonez & Innis, Citation2014)) and transcriptional coregulators (e.g. CBP and RB (Iyer et al., Citation2004; Janknecht, Citation2002; Vile & Winterbourn, Citation1989)) have long been associated with disease. However, such mutations are likely to affect all genes regulated by these enhancer-binding factors. In contrast, abnormal sequence variants that alter the activity of individual enhancers can lead to disease by altering expression of specific genes. Early examples showed that inherited deletions of enhancers in the β-globin locus led to the decreased β-globin expression underlying β-thalassemia (Kioussis et al., Citation1983; Kulozik et al., Citation1988). Genomewide association studies (GWAS) have identified thousands of single-nucleotide polymorphisms (SNPs), defined as germline nucleotide variations that occur within a population at a frequency above 1%, that are associated with particular diseases [reviewed in (Freedman et al., Citation2011; Hindorff et al., Citation2009)]. Interestingly, most SNPs identified by GWAS are located in noncoding regions (Freedman et al., Citation2011; Yao et al., Citation2014) and recent studies from the ENCODE Project, the Roadmap Epigenome Mapping Consortium, and other groups, have found that many disease-associated SNPs fall within enhancer regions, suggesting that these SNPs cause changes in gene expression that lead to an increased risk of that disease (Akhtar-Zaidi et al., Citation2012; Farh et al., Citation2015; Gjoneska et al., Citation2015; Roadmap Epigenomics Consortium, Citation2015; Yao et al., Citation2014). In support of this hypothesis, multiple studies have shown that SNPs at disease-relevant enhancers are likely to impact the binding of transcription factors (Hazelett et al., Citation2014; Herz et al., Citation2014).
Certain rare somatic mutations (nucleotide changes that occur after birth in the genome of specific tissues and thus are not inherited) at enhancers have been associated with various diseases. For example, a mutation that disrupts an enhancer for the RET gene (located 15 kB away from the TSS) results in a 20-fold greater contribution to the risk of Hirschsprung’s disease than other known RET mutations (Emison et al., Citation2005). Large-scale chromosomal changes that affect enhancers can also lead to disease, such as the translocation of the active IgH enhancer to the MYC locus in Burkitt’s lymphoma (Siebenlist et al., Citation1984). Also, chromosomal rearrangements can relocate an enhancer that regulates GATA2 expression, leading to aberrant expression of the proto-oncogene EVL1 and causing acute myeloid leukemia (Groschel et al., Citation2014). This type of oncogene “enhancer hijacking” appears to be common in nonhematopoietic cancers as well. For example, large deletions between the TMPRSS2 enhancer and various E-twenty-six (ETS)-family oncogenes (such as ERG) are common in prostate cancer (Tomlins et al., Citation2005) and translocations between various active enhancers and the glioma-associated (GLI) oncogenes appear to underlie ∼10% of pediatric medulloblastoma cases (Northcott et al., Citation2014). More complex structural changes involving enhancers can also underlie disease. For example, a large genomic deletion (660 kB) results in the loss of a topological domain boundary that normally prevents interaction between forebrain-specific enhancers and the LMNB1 promoter. This deletion is responsible for the acquisition of autosomal dominant adult-onset demyelinating leukodystrophy in some patients because of the overexpression of LMNB1 (Giorgio et al., Citation2015).
Most sequencing of disease tissues has thus far been limited to exonic sequences. With the addition of whole-genome sequencing of patients to the toolkit of personalized medicine, it is certain that many more enhancers harboring germ line variants, somatic nucleotide mutations, or located within or nearby chromosomal alterations will be identified. In fact, a recent analysis of 436 complete cancer genomes (Melton et al., Citation2015) generated by the TCGA Consortium identified recurrent mutations in distal regulatory elements. Mutated or variant enhancers, when associated with a particular disease, may become potential therapeutic targets. Importantly, the cell-type-specific activity of enhancers may enable more precise therapy, as compared to agents that inhibit entire signaling networks. A good example of an enhancer that may be appropriate for such targeted therapy is one that regulates BCL11A, a transcription factor that represses expression of fetal hemoglobin (Sebastiani et al., Citation2015). There are different types of hemoglobin that show specificity of expression in adult versus fetal cells. Patients with sickle cell disease (SCD) have mutations in the HbA hemoglobin proteins that are normally expressed in adult cells. Clinical observations have shown that SCD patients with higher levels of the fetal-specific type of hemoglobin (HbF) have a better prognosis (Dong et al., Citation2013; Peterson et al., Citation2014). Therefore, it has been suggested that reducing levels of BCL11A (which would allow reactivation of fetal hemoglobin) might be an appropriate therapy for patients with SCD. However, although BCL11A would seem to be an attractive therapeutic target for SCD, there are concerns about directly inactivating this transcriptional repressor because it plays important roles in other cell types (Yu et al., Citation2012; Wakabayashi et al., Citation2003). The discovery of a red blood cell-specific enhancer for BCL11A located ∼65 kB away from TSS (Sebastiani et al., Citation2015) suggests an alternative approach. That is, to specifically downregulate BCL11A expression only in blood cells by disabling the blood cell-specific enhancer using chromatin editing or genomic nucleases, alleviating off-target effects in other cell types.
Due to their cell-type-specific roles in specifying gene expression patterns that regulate both normal development and human diseases, it is clearly important to fully understand the function of enhancers. However, very few enhancers have been studied in the same detail as those described above. In addition, there is still an unsolved fundamental question: what are the target genes of the hundreds of thousands of enhancers that have been identified in the human genome? The most recent Gencode release has identified ∼60 000 coding and noncoding genes (http://www.gencodegenes.org/stats/current.html) that are expressed from ∼200 000 promoters (http://fantom.gsc.riken.jp/5/datafiles/latest/extra/CAGE_peaks/). Current estimates are that 10 000–15 000 genes are expressed in a given cell type (Bengtsson et al., Citation2005) and that each cell type has 44 000–294 000 active enhancers (resulting in a total of 389 967 nonoverlapping enhancer regions across 98 tissue and cell lines) (Roadmap Epigenomics Consortium, Citation2015; Yao et al., Citation2015). Thus, at both the global level and within a given cell type, there are many more enhancers than expressed genes. Also, as discussed earlier, enhancers tend to be cell-type specific, suggesting that a gene can be regulated by different enhancers in different cell types. In addition, an enhancer can regulate different promoters in different cells, as observed at the β globin locus (Holwerda & de Laat, Citation2013). Thus, enhancer targets must be identified in a cell-type-specific manner. Although these numbers suggest that in a particular cell type, an enhancer may, on average, regulate only one or a small number of genes, the flexibility of the distances between enhancers and target genes makes it very complicated to predict which gene is regulated by a specific enhancer.
To date, very few experiments have been performed in mammalian cells with the goal of linking an enhancer to a specific target gene. In model organisms such as fruitfly and mouse, linkages have been established using in vivo reporter constructs followed by in situ imaging of developmental expression patterns. When an enhancer reporter construct has a highly specific spatiotemporal pattern that matches that of a neighboring gene, it is taken as strong functional evidence that an enhancer–gene target pair has been identified. An analysis of thousands of candidate enhancers in Drosophila suggests that even in a relatively compact genome enhancers operate at large distances from the gene they regulate and that significant numbers do not regulate the nearest annotated gene (Kvon et al., Citation2014). Such developmental approaches to study enhancers are impractical in mammals. However, recent advances in experimental techniques that allow the investigation of the 3D architecture of chromatin, as well as analytical approaches that take advantage of large multidimensional epigenomic datasets, provide methods by which investigators can predict which genes are regulated by specific enhancers. We review (1) methods based on physical interactions, including chromosome conformation capture (3C) (Dekker et al., Citation2002; Hagege et al., Citation2007), circular chromosome conformation capture (4C) (Simonis et al., Citation2006; Zhao et al., Citation2006), chromosome conformation capture carbon copy (5C) (Dostie & Dekker, Citation2007), Hi-C (Lieberman-Aiden et al., Citation2009; van Berkum et al., Citation2010), tethered conformation capture (TCC) (Kalhor et al., Citation2011), capture Hi-C (Chi-C) (Jager et al., Citation2015), capture-C (Hughes et al., Citation2014), DNase I Hi-C (Ma et al., Citation2015), and chromatin interaction analysis by paired-end tag sequencing (ChIA-PET) (Fullwood & Ruan, Citation2009) and (2) methods based on gene expression associations using SNPs (Westra & Franke, Citation2014), DHSs (Sheffield et al., Citation2013; Thurman et al., Citation2012), histone modifications (Ernst et al., Citation2011; Shen et al., Citation2012), and DNA methylation (Aran et al., Citation2013; Aran & Hellman, Citation2013; Yao et al., Citation2015) at enhancer regions. Of course, each of these methods produces predictions of cell-type-specific enhancer–gene linkages that should be verified by follow-up experiments. Therefore, we also describe methods, such as genomic deletion or epigenetic inactivation of an enhancer, which can be employed in such experiments. By combining results from these computational and experimental methods, an encyclopedia of enhancer–gene linkages can be developed to help guide future biological studies or clinical therapeutic treatments.
Identifying target genes of enhancers using methods based on physical interactions between separated regions of chromatin
Methods used to identify enhancer–promoter linkages
Many methods that study chromatin interactions are based on a technique termed 3C. The principle of 3C technology relies on formaldehyde crosslinking of interacting chromatin fragments, restriction enzyme digestion, ligation of the interacting fragments, and finally polymerase chain reaction (PCR) analysis using primers specific for the fragments of interest (Dekker et al., Citation2002; Hagege et al., Citation2007; Tolhuis et al., Citation2002). Multiple variations of 3C (4C, 5C, Hi-C, and TCC) have been developed, the most recent ones being adapted for genome-wide analyses; see previous reviews for methodological details (Dekker et al., Citation2013; de Wit & de Laat, Citation2012; Lan et al., Citation2012). In brief, 3C and 4C-seq methods can produce interaction profiles for individual genomic loci of interest, such as promoters and enhancers; see plus for a list of software associated with 3C-based methods. 3C investigates possible long-distance interactions between two loci based on prior knowledge of a potential interaction in a “one-to-one” manner (Dekker et al., Citation2002). In contrast, 4C-seq identifies all chromosomal regions interacting with a single specific genomic locus (described as a “viewpoint” or “bait”), in a “one-to-all” manner (Simonis et al., Citation2006; Zhao et al., Citation2006). The 5C, Hi-C, and TCC methods use distinct approaches to overcome the limitation of choosing an individual locus for study, potentially allowing the investigation of all chromatin interactions throughout the genome. For example, 5C detects ligation products in a 3C library using ligation-mediated amplification (LMA) (Dostie & Dekker, Citation2007; Dostie et al., Citation2006). Hi-C labels ligation products in a 3C library using biotin so that all ligated fragments can be enriched for sequencing (Lieberman-Aiden et al., Citation2009). Finally, TCC uses a similar biotin-based enrichment strategy as in Hi-C except that the ligation is performed on a solid substrate rather than in solution to improve the signal-to-noise ratio (Kalhor et al., Citation2011). As expected, 5C provides less comprehensive interaction profiles than the other two methods because genomic coverage of 5C is limited by the requirement for large numbers of primers. For example, a 5C study using primers designed to identify interactions between 628 TSS-containing restriction fragments and 4535 distal restriction fragments identified less than 2000 promoter–distal interactions (Sanyal et al., Citation2012), whereas ∼60 000 promoter–distal interactions were identified using Hi-C (Jin et al., Citation2013). The resolution for detecting interactions by the three genomewide technologies is limited by sequencing depth and the frequency of restriction enzyme (RE) cutting sites. In a typical Hi-C experiment, 3.4–8.4 billion reads can produce interaction profiles at a 5 kB –1 MB resolution, depending on bin size (Jin et al., Citation2013; Lieberman-Aiden et al., Citation2009). A recent study of 3D nuclear architecture using a method called in situ Hi-C, which uses the original Hi-C protocol but performs the digestion and ligation steps in intact nuclei, produced over 25 billion reads for nine human cell types, and improved the resolution of chromatin interactions to 1 kB to detect over 15 billion distinct interactions across the nine cell types (Rao et al., Citation2014).
Figure 2. 3C-based technologies used to identify enhancer–promoter loops. All 3C-based technologies begin with formaldehyde treatment, leading to crosslinking of DNA fragments in close proximity. The 3C, 4C, and 5C methods begin with restriction enzyme (RE) digestion of the chromatin into small pieces (digestion sites represented by black bars). Crosslinked fragments are ligated to form unique hybrid DNA molecules, and then, the DNA is purified. In 3C, a predicted ligation product can be analyzed by PCR using a pair of primers; this is termed a one-to-one approach. In 4C, the 3C ligation library is digested with a second RE to digest the DNA to smaller sizes (second digestion sites are labeled as green ovals), and then, the fragments are ligated to form a circle. Inverse PCR is utilized to generate a genomewide interaction profile for a single locus (analyzed by high-throughput sequencing); this is termed a one-to-all approach. 5C detects ligation products from a 3C library using ligation-mediated amplification (LMA) followed by high-throughput sequencing; this is termed a many-to-many approach. Starting from 3C fragmentation products, Hi-C includes a unique step in which sticky ends resulting from the RE digestion are filled in with biotinylated nucleotides (shown as red dots). This facilitates a streptavidin-based enrichment of the ligation products for sequencing. The difference between TCC and Hi-C is that TCC adds an initial protein biotinylation and tethering step, such that the fragmentation and ligation are performed on a solid substrate; TCC and Hi-C are termed all-to-all approaches. Specific subsets of TCC and HCC products can be selected prior to sequencing using oligonucleotides or arrays in CHI-C and Capture-C, allowing an all-to-all analysis of selected genomic regions. DNase Hi-C uses the conventional Hi-C protocol but replaces the RE fragmentation step with DNase I digestion and thus is an all-to-all approach. ChIA-PET, which is quite different from the other 3C-based methods, begins with sonication of the chromatin, which is followed by a conventional chromatin immunoprecipitation step. Then, A (purple) and B (orange) linkers are added to two groups of materials that are mixed together for the ligation step, the ligation products are digested with MmeI, and the DNA is sequenced. The frequency of random ligations between the two different linkers (AB) is used to estimate the frequency of nonspecific ligation. ChIA-PET is termed an all-to-all approach for interactions involving a specific protein. (see the color version of this figure at www.informahealthcare.com/bmg).
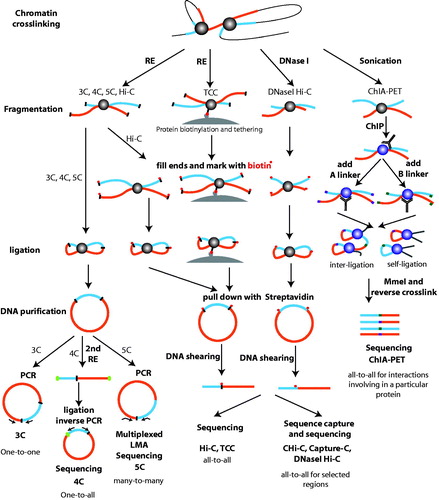
Table 1. Summary of available software for chromatin interaction data.
Although the above-mentioned studies suggest that deep sequencing of Hi-C data can improve resolution of a chromosome interaction map, it is monetarily and computationally expensive to obtain and analyze the number of reads necessary to reach 1 kB resolution. Also, among the more than 1 million interactions detected in IMR90 fetal lung cells using Hi-C, only 57 585 were linkages between a known promoter and a distal region (Jin et al., Citation2013). Thus, the interactions of major interest in the investigation of enhancer–gene regulatory networks constitute a minority of all chromosomal interactions identified using Hi-C-based methods. One way to increase resolution is to focus only on a subset of interactions of interest, using methods such as ChIA-PET and Capture Hi-C (CHi-C) methods. ChIA-PET is a ChIP-based method that employs 3C principles but uses antibodies to a specific protein to collect the interacting fragments. This method can be used to map all interactions at a subset of enhancers bound by a specific TF (e.g. using an antibody to CTCF (Handoko et al., Citation2011) or estrogen receptor α (Fullwood et al., Citation2009)) or at all active promoters (using an antibody to RNA polymerase II (Li et al., Citation2012)). CHi-C is a new approach that uses sequence capture technology to enrich a Hi-C library for annotated promoters. This technique resulted in a 10-fold enrichment of reads involving promoters, allowing more promoter coverage at a fraction of the cost; sequencing of 754 million uniquely mapped paired-end reads identified approximately 1 million promoter-based interactions. In addition to increasing sequencing depth at regulatory regions, another way to fundamentally improve resolution in identifying interaction loci is to replace the typically used REs having a six nt recognition sequence (e.g. HindIII) with REs having more frequent recognition sites in the genome or to change to DNase I-based digestion or chromatin fragmentation by sonication. The capture-C method, which combines a 3C method using a RE that has a four nucleotide recognition sequence (DpnII) with a hybridization-based capture of targeted regions and high-throughput sequencing, can provide an unbiased, high-resolution profile of cis interactions for hundreds of genes in a single experiment (Hughes et al., Citation2014). DNase I Hi-C replaces the RE digestion step in the conventional Hi-C protocol with digestion by DNase I and performs slightly better than RE-based Hi-C in terms of biases in G+C content and mappability (Ma et al., Citation2015).
3D enhancer–promoter interaction patterns
A decade of 3D chromatin conformation studies has resulted in highly ordered and complicated long-range chromosomal interaction maps for human and mouse cells; these studies have challenged a common assumption that enhancers regulate the nearest genes. Instead, the complicated long-range enhancer–promoter interactions identified from chromosome interaction studies strongly suggest that enhancers frequently skip the nearest promoter to regulate a more distal gene. For example, a 5C study of GM12878, K562 and HeLa-S3 cells found that only 27% of the distal elements interact with the nearest TSS, with the number increasing to 47% when only expressed genes were used in the analysis (Sanyal et al., Citation2012). Another study using ChIA-PET and an antibody to RNA polymerase II found that ∼40% of the enhancer elements did not interact with the nearest promoter (Li et al., Citation2012). Studies have also shown that the distances between interacting enhancers and promoters can be quite large. For example, only 25% of the enhancer–promoter interacting fragments were within 50 kB and about 57% of the contacts spanned more than 100 kB, as reported from Hi-C experiments in IMR90 cells (Jin et al., Citation2013). In addition, enhancer–promoter interactions are not limited to one-to-one relationships. Rather, an enhancer can contact multiple promoters and a promoter can contact multiple enhancers (Li et al., Citation2012; Sanyal et al., Citation2012; Schoenfelder et al., Citation2015). The different types of chromatin interactions have been classified into two categories of higher-order interaction clusters: “single-gene” complexes, which consist of interactions between a single gene and one or more enhancers and “multigene” complexes, in which multiple genes are involved in interactions with one or more enhancers. Interestingly, the genes in the “single-gene” interaction complexes tend to be cell-type-specific (Li et al., Citation2012). Surprisingly, some promoter sequences in the multigene interaction complexes show enhancer capacity affecting the expression of other linked genes (Li et al., Citation2012).
As described earlier, the high-resolution analyses of chromatin interactions by 5C, Hi-C, and ChIA-PET have identified thousands of enhancer–promoter interactions. Although the rules governing enhancer–promoter specificity are still not clear, some experiments have suggested that enhancers are restricted to regulating promoters within specified chromatin boundaries. For example, low-resolution analyses of 3D chromatin data have introduced two new concepts: “genome spatial compartmentalization” and “topologically associated domains” (TADs) (). The first concept, based on chromatin interactions at low resolution (1 MB) and histone modifications, divides the genome into two compartments. Compartment A is characterized by gene dense regions and has active chromatin marks and compartment B is associated with repressive chromatin (Dekker et al., Citation2013; Lieberman-Aiden et al., Citation2009; van Berkum et al., Citation2010;); analyses suggest that most interactions occur within the same compartments. A recent deeply sequenced in situ Hi-C experiment with 25 kB resolution suggested that there are also subcompartments (∼300 kB in size) with distinct patterns of histone modifications, with compartment A consisting of two subcompartments and compartment B consisting of four subcompartments (Rao et al., Citation2014). The second concept, based on TADs (∼1 MB in size), comes from the observation that regions are bounded by segments where the chromatin interactions end abruptly. Although TADs are defined independently from compartments (Dekker et al., Citation2013; Jin et al., Citation2013; Pope et al., Citation2014), several adjacent TADs can organize to create a compartment (Rao et al., Citation2014). Studies suggest that most chromatin interactions occur between elements within a TAD, with many fewer interactions occurring between elements from different TADs. TADs are highly conserved among species (Dixon et al., Citation2012) and most TADs are invariable across cell types and developmental stages. Interestingly, although the boundaries of the TADs are relatively constant, a TAD can switch between the active compartment A and the repressive compartment B in different cell types (Dekker et al., Citation2013; Phillips-Cremins et al., Citation2013; Pope et al., Citation2014; Vietri Rudan et al., Citation2015). If, as proposed, enhancer–promoter interactions are constrained by the boundaries of the TADs, then altering these boundaries should have critical impacts on gene expression. Early work showed that a shift in topological domain boundaries accompanied expression changes of homeotic genes during mouse development (Noordermeer et al., Citation2011) and deletion of a TAD boundary on the X-chromosome has been shown to result in novel chromatin interactions and alteration of gene expression (Nora et al., Citation2012). It is also important to note that the invariability of TADs across cell types does not conflict with the concept of cell-type-specific enhancer–promoter interactions. This is because the specific enhancer–promoter interactions within a TAD can vary from cell type to cell type (Dixon et al., Citation2012; Li et al., Citation2012).
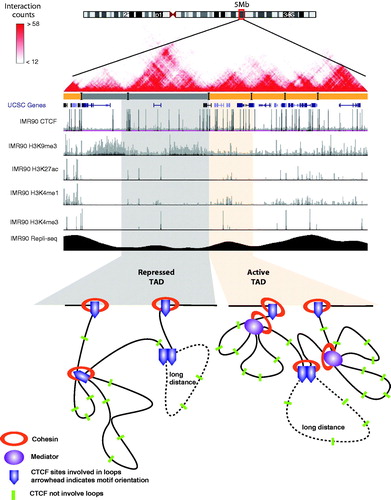
Figure 3. Chromatin 3D structures. Shown is a two-dimensional heatmap of Hi-C interaction frequencies in IMR90 cells from a 5 MB region of Chr2 generated using the website: http://www.3dgenome.org and the color key represents the interaction counts between two loci. Highlighted in gray is a repressed compartment and highlighted in orange is an active compartment. Also shown is ChIP-seq data for CTCF and histone modifications, as well as a wavelet-smoothed Repli-seq track representing DNA replication timing; all datasets were taken from the University of California, Santa Cruz genome browser. For each compartment, a model of chromatin interactions is shown (which are more frequent within a TAD than between TADs) facilitated by CTCF, Cohesin, and Mediator. Long-distance constitutive interactions require a pair of CTCF sites with convergently orientated motifs as anchors; any combination of CTCF, cohesin, and mediator can facilitate median distance interactions. Many other CTCF-binding sites (green bars) are not involved in chromatin interactions and occur within loops. (see the color version of this figure at www.informahealthcare.com/bmg).
Three major components have been shown to contribute to the formation of the 3D chromatin architecture: CCCTC-binding factor (CTCF), cohesin, and mediator (Handoko et al., Citation2011; Parelho et al., Citation2008; Phillips-Cremins et al., Citation2013; Rao et al., Citation2014; Sanyal et al., Citation2012; Zuin et al., Citation2014; Wendt et al., Citation2008) (). CTCF is a site-specific DNA-binding protein that has insulator capacity that can interfere with enhancer–promoter communications and block heterochromatin spreading (Ong & Corces, Citation2014); cohesin is a protein complex important for the separation of sister chromatids during mitosis and meiosis (Brooker & Berkowitz, Citation2014) and is also involved in gene regulation (Losada, Citation2014); and mediator is a large, multiprotein complex that functions as a transcriptional coactivator. CTCF, cohesin, and mediator were shown to anchor >80% of the interactions identified in ES cells (Phillips-Cremins et al., Citation2013) and another study showed that these three components are located at 86% of ∼10 000 constitutive chromatin interactions in nine cell lines (Rao et al., Citation2014). These complexes appear to have overlapping, but not equivalent, roles in defining chromatin looping. For example, CTCF alone or CTCF plus cohesin is highly associated with constitutive long-range interactions, whereas mediator plus cohesin complexes are more associated with proximal enhancer–promoter interactions (Dowen et al., Citation2014; Ing-Simmons et al., Citation2015; Phillips-Cremins et al., Citation2013; Vietri Rudan et al., Citation2015). Also, CTCF and components of the cohesin complex are present at most of the TAD boundaries (Dixon et al., Citation2012; Nora et al., Citation2012) and the CTCF motifs at these sites are conserved across species (which may explain the invariance of TADs (Vietri Rudan et al., Citation2015). Pairs of CTCF motifs, which have an orientation because of the nonpalindromic motif sequence (5′CCACNAGGTGGCAG-3′), involved in constitutive long-range interactions on the same chromosome are positioned in a convergent manner on opposite strands of the DNA (Rao et al., Citation2014; Vietri Rudan et al., Citation2015). Other evidence that suggests non-equivalent functions of CTCF versus cohesin comes from depletion studies. For example, in HEK293 cells, the depletion of CTCF results in a higher frequency of inter-TAD interactions and fewer intra-TAD interactions, whereas reduction in cohesin has no impact on TAD structure but leads to a global loss of intra-TAD interactions (Zuin et al., Citation2014). Also, a conditional deletion of a component of cohesin in thymocytes weakens enhancer–promoter interactions, without affecting the location or strength of the histone marks H3K27ac and H3K4me1 (Ing-Simmons et al., Citation2015). Moreover, CTCF tends to bind to the boundaries of large enhancer regions, restraining the cohesin-anchored interactions within the regions (Dowen et al., Citation2014; Ing-Simmons et al., Citation2015). The deletion of a CTCF site at one side of a large enhancer region caused alteration of expression of genes within and nearby the enhancer region (Dowen et al., Citation2014). These results indicate that CTCF plays an important role in maintaining chromosomal structure. However, it is important to note that only a small portion of CTCF-binding sites reside at the boundaries of TADs or enhancer regions; rather, most CTCF sites are located within TADs (Cuddapah et al., Citation2009; Handoko et al., Citation2011). Although there is evidence that CTCF sites located at enhancer or promoter regions can facilitate enhancer–promoter interactions (Handoko et al., Citation2011; Jager et al., Citation2015; Pena-Hernandez et al., Citation2015), 79% of long-distance interactions between distal elements and promoters actually bypass one or more CTCF sites (Sanyal et al., Citation2012), suggesting a situation more complex than a simple “insulator” or “bridge” model. Perhaps the bypassed CTCF sites are involved in enhancer–promoter interactions that occur in other cell types or poise cells for changes in physical interactions in response to developmental progression or external cues. Taken together, these recent studies support a critical role of CTCF, cohesin, and mediator in organizing chromatin interactions and gene regulation, but the details of the mechanisms by which they govern the 3D architecture of the genome are still unsolved.
The chromatin interactions identified by the 3C-based technologies described previously provide evidence that distal elements can physically interact with specific promoter regions, allowing the prediction of potential target genes. However, an interaction between a distal element and a promoter does not guarantee that the distal element is actually involved in regulating expression of the linked gene. For example, chromatin interactions in IMR90 cells show very few changes upon treatment with TCF-α, even though large changes in gene expression occur (Jin et al., Citation2013). This suggests that either enhancers are looped to the target promoters even before the genes are activated or many chromatin interactions are not related to gene expression. Other potential nonfunctional interactions identified by 3C-based methods, such as random collision in the nucleus or within a defined topologically associated domain, have been recently discussed (Dekker et al., Citation2013). It is likely that the chromatin interaction profile in a given cell type is composed of several different types of interactions, some involved in maintaining overall nuclear structure, some involved in gene regulation, and some representing stable, but nonfunctional, loops. Importantly, it is also possible that some enhancers regulate their target gene via a mechanism distinct from looping. Thus, 3D studies may not provide a definitive identification of the set of target genes of an enhancer. However, computation tools have been developed to predict enhancer–gene linkages based on the association of target gene expression with dynamic enhancer activities (as defined by sequence changes in the population or differences in epigenetic marks); some of these tools integrate multiple layers of genetic and epigenetic information to improve the accuracy of prediction. These computational tools, which provide alternative methods for understanding enhancer function, are described in the next section.
Identifying target genes of enhancers using computational analyses to link altered enhancer structure or activity to specific gene expression patterns
Predicting target genes based on changes in enhancer sequence
Expression quantitative trait loci (eQTL) refers to the method of using the correlation between genetic polymorphism and variation of gene expression across many different individuals to identify genomic loci that influence gene expression (Westra & Franke, Citation2014). This method requires matched SNP information and gene expression patterns from multiple individuals (). To date, eQTL studies have been performed for multiple cell types and tissues, such as fibroblasts, liver, lung, brain, muscle, adipose tissue, skin, whole blood, specific blood cell types (B cells, monocytes, and T cells), and lymphoblastoid cell-lines (Castaldi et al., Citation2015; GTExConsortium, Citation2015; Nica et al., Citation2011; Ramasamy et al., Citation2014; Yang et al., Citation2010); see for a list of eQTL databases. A comparison of eQTL results using different cell or tissue types suggests that SNPs can influence the expression of different genes in different cell types and can even have opposite effects on a given gene in different cell types (Fairfax et al., Citation2012; Francesconi & Lehner, Citation2014; Fu et al., Citation2012). Approximately, 14 million validated SNPs have been identified in human populations. Although modern genotyping arrays only contain features for ∼1 million or so SNPs, they capture most of the common SNPs through linkage disequilibrium-based SNP imputation (Howie et al., Citation2012; Porcu et al., Citation2013).
Figure 4. Computational methods to link enhancers to putative target genes. (A) The eQTL method uses the association between genotypes of a SNP within an enhancer and gene expression levels across multiple individuals to predict target genes. (B) A correlation between dynamic enhancer activity and gene expression across multiple cell lines or tissues can be used to predict enhancer–gene linkages. Levels of H3K4me1, H3K27ac, and DHS show positive correlations with enhancer activities; each color represents data from an individual cell line or tissue. (C) Similar to panel B, DNA methylation data can also be used to predict target genes; in this case, one expects a negative correlation between DNA methylation at enhancers and gene expression. (D) Integrating multiple layers of information can help to predict a target gene; e.g. the gene with a higher score for phylogenetic proximity and similar GO terms with the TF (indicating that the TF and target gene are in a same pathway) is predicted to be the putative target gene. (see the color version of this figure at www.informahealthcare.com/bmg).
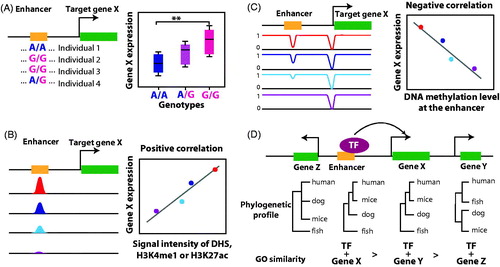
Table 2. Available databases for eQTL.
While some eQTL studies analyzed SNP-expression associations genomewide, this approach requires expression profiles from a large number of individuals in order to attain statistical significance after adjusting for the large number of hypotheses tested. A popular approach has been to constrain eQTL analyses to genetic loci that have already been implicated in human diseases or traits in genomewide association studies (GWAS). Within the last decade, it has become clear that the majority of disease-linked SNPs are outside of gene coding regions and likely represent variation within regulatory elements (Freedman et al., Citation2011), suggesting that the SNP allele should covary with expression of a nearby target gene. In support of this theory, enhancers and other regulatory elements mapped experimentally by the ENCODE and Roadmap Consortia have consistently been found to be enriched for disease-associated SNPs identified in GWAS studies (ENCODE_Project_Consortium, Citation2012; Roadmap Epigenomics Consortium, Citation2015). Therefore, after identifying an “index” SNP associated with a particular disease, investigators have analyzed the expression of all genes within a certain region to try to identify a gene whose expression covaries with the SNP allele across multiple individuals. To gain insights into risk of breast cancer, Li et al. conducted an eQTL-based analysis of 15 breast cancer risk SNPs, integrating multilevel information, such as copy number variation, promoter methylation, and enhancer annotations from TCGA and ENCODE (Li et al., Citation2013). Using a similar method, expression of the TMED6 gene was linked to an enhancer, located 600 kB away, which harbors three colon cancer-associated SNPs (Yao et al., Citation2014). Similar studies have combined epigenomic enhancer data with eQTL mapping to link particular enhancers to other diseases, such as chronic obstructive disease (Castaldi et al., Citation2015), asthma (Sharma et al., Citation2014), prostate cancer (Hazelett et al., Citation2014), and schizophrenia (Roussos et al., Citation2014).
A working model in the field is that the disease-associated SNPs located within enhancers affect enhancer function by disrupting or improving TF-binding motifs, thus causing changes in the expression of target genes. This model has been investigated for certain important risk alleles, such as the risk variant for both colon and prostate cancer rs6983267 that affects expression of the MYC oncogene via altered transcription factor binding (Pomerantz et al., Citation2009; Yeager et al., Citation2008). Other studies (Gjoneska et al., Citation2015; Hazelett et al., Citation2014; Li et al., Citation2013;Yao et al., Citation2014) have used TF-binding motif prediction within eQTL-linked enhancers to generate hypotheses that can be tested experimentally. Li et al. combined eQTL mapping, epigenomic enhancer maps, and TF motif prediction in an innovative way to understand how risk variants might affect entire transcriptional networks. In addition to predicting direct cis-interactions, eQTL can predict putative indirect trans-interactions between a risk locus and distant loci in the genome. For example, Li et al. identified a breast cancer risk SNP within 1 MB of the gene for the ESR1 transcription factor that affected expression of 476 different genes having nearby putative enhancers containing an ESR1-binding motif. This approach represents an integrated method for correlating genomewide enhancer analyses with modifications in the expression of upstream transcription factors to understand the role of transcriptional networks in disease.
Although eQTL mapping has produced lists of putative target genes for specific enhancers, the results should be interpreted with caution. First, although a large sample size is required to generate robust linkage predictions, many studies have been performed using small sample sizes and thus may include false positives. Second, associations between genomic loci and gene expression predicted by eQTL represent a mixture of direct (i.e. cis) and indirect (i.e. trans) regulation, and these are often not easy to distinguish due to the large distances that can separate enhancers and their gene targets. However, allele-specific expression linked to a heterozygous SNP can help to identify direct targets (Crowley et al., Citation2015; Dixon et al., Citation2015). Third, because most enhancers are cell-type-specific, eQTL mapping should be performed using the cell type or tissue most relevant for a particular disease. Finally, it is important to note that the SNPs identified by array-based GWAS studies may not be the causal SNP; all SNPs in LD with the GWAS-linked SNP should be considered, along with fine mapping or a whole-genome sequencing-based approach.
Predicting target genes based on changes in enhancer activity
Epigenomic-mapping techniques make it possible to correlate enhancer activity, via changes in DNA hypersensitivity, histone modifications, or DNA methylation levels, with target gene expression across different tissues or cellular conditions; see for a summary of the computational tools used for these correlative analyses. A change in the nuclear level of a TF is perhaps the most straightforward mechanism by which an enhancer activity can change. For example, upon hormone stimulation, estrogen receptors (ERs) can translocate to the nucleus, bind to their motifs in enhancer regions, cause changes in histone modifications, and stimulate expression of target genes (Levin, Citation2005; Vrtacnik et al., Citation2014). Several methods have been developed to link target genes to regulatory TFs using dynamic binding patterns of TFs; in general, TF binding is measured by ChIP-chip or ChIP-seq and gene expression profiles are measured using microarrays or RNA-seq under conditions of differential expression of the relevant TF. Although yeast are not considered to have distal enhancers per se, the regulation of RNA polymerase II initiation by sequence-specific transcription factors is highly conserved, and thus, S. cerevisiae has been an important model system for developing these approaches. For example, Gao et al. used a multivariate regression model to identify correlations between TF activity and gene expression across various conditions in S. cerevisiae to produce lists of putative target genes of TFs (Gao et al., Citation2004). Over the last decade, a number of different approaches have been developed to correlate model organism or human TF ChIP-chip and ChIP-seq data with gene expression; such methods include partial least squares (PLS) regression (Boulesteix & Strimmer, Citation2005), a genetic regulatory modules (GRAM) algorithm (Bar-Joseph et al., Citation2003), a probabilistic model termed target identification from profiles (TIP) (Cheng et al., Citation2011), a support vector machine (SVMs) (Qian et al., Citation2003), a linear activation model based (Honkela et al., Citation2010), and an unsupervised machine learning with an expectation maximization algorithm (EMBER) (Maienschein-Cline et al., Citation2012). All of these methods are based on positive correlations of TF activity and target gene expression, ignoring the important fact that TFs can also repress target gene expression. However, one method, called binding and expression target analysis (BETA), does include a step to evaluate if the effects of a given TF are activating or repressing (Wang et al., Citation2013b). Also, BETA considers the distance between TF binding sites and the putative target gene, as well as the location of conserved CTCF-binding sites (which may delineate the boundaries of TADs, as described earlier), when predicting the targets of TFs. Overall, these methods are useful to predict target genes of TFs if one has available ChIP-seq and expression profiles performed in different conditions (such as knockdown or overexpression of a TF or activation of a pathway). However, these methods, which cannot distinguish direct from indirect effects, only produce a list of putative target genes for a particular TF without pinpointing individual enhancer–gene linkages. Comparing the results of these algorithms to direct interaction mapping approaches, such as the 3C methods described above, will likely allow for improvements in predicting direct versus indirect targets; however, this is an emerging area that has not been well explored.
Table 3. Summary of computational methods.
Recent genomewide studies from the ENCODE Project and the Roadmap Epigenome Mapping Consortium have confirmed that DHSs and certain histone modifications are correlated with the binding of transcription factors and the activity state of enhancers (). Ernst et al. developed a method that combines multiple histone marks (including H3K27ac and H3K4me1) into chromatin state signals for nine ENCODE human cell types. Correlation of enhancer activity states from this method and gene expression in the same cell types identified putative target genes within a 5–125 kB range (Ernst et al., Citation2011). Based on a similar principle, Shen et al. used the signal intensity of H3K4me1 and RNA polymerase II ChIP-seq data, representing enhancer activity and gene expression, respectively, across 19 mouse tissues and cell lines to calculate a Spearman correlation coefficiency (SSC) between nearby elements. Enhancers and gene elements were clustered into enhancer–promoter units (EPUs) based on the SSC along each chromosome. On average, 5.6 enhancers were linked to each promoter using this method; multiple Hi-C and 3C experiments have verified the enhancer–gene association linkages identified by the EPU method (Shen et al., Citation2012). To meet the need for publicly available tools to perform similar analyses, a software package called predicting specific tissue interaction of genes and enhancers (PresSTIGE) has been developed which predicts enhancer–gene linkages using H3K4me1 or H3K27ac and RNA-seq data (Corradin et al., Citation2014; Van Bortle & Corces, Citation2014). Several groups have begun to use DNase I signal intensity to represent enhancer activity. For example, Thurman et al. calculated the SSC between the DHS state at each TSS and all distal DHSs located within 500 kB of that TSS and separated from the TSS by at least one other DHS. This analysis, performed with 79 diverse cell types, identified 578 905 DHSs that have intensities that are highly correlated with at least one promoter DHS signal intensity; importantly, these DHS-promoter pairs are significantly overrepresented in interactions identified by 5C and ChIA-PET (Thurman et al., Citation2012). Instead of correlating the DHS signals of TSSs and enhancers, another study used gene expression levels to calculate Pearson correlations with DHSs located within 100 kB of each gene across 72 cell types, identifying 530 000 DHSs that have activities significantly correlated with at least one gene (Sheffield et al., Citation2013). These correlation-based analyses provide approaches to predict individual putative enhancer–gene linkages on a genome-wide scale. As with other correlation-based methods, distinguishing direct versus indirect linkages remains a challenge, and the distance-based rules used to date have been relatively ad hoc.
In addition to specific histone modifications and the presence of DHSs, levels of 5-methylcytosine at CpG dinucleotide sites is another epigenetic mark that can be used to identify enhancers. In the majority of human cell types, 70–80% of all CpG sites are methylated. However, short CpG-rich regions called CpG islands (CGIs), which occur primarily at promoters, remain unmethylated in somatic cells [reviewed in (Jones, Citation2012)]. Early studies of DNA methylation mainly focused on the CGIs located in promoter regions, at which DNA hypermethylation was shown to correlate with transcriptional repression. Studies of individual enhancers reported that active enhancers have low levels of DNA demethylation (Thomassin et al., Citation2001). However, an understanding of the relationship between DNA methylation and enhancer activity was limited until unbiased genomewide DNA methylation analyses using whole-genome bisulfite sequencing (WGBS) technology were performed. The genomewide studies revealed that low levels of DNA methylation in distal regions could be used to identify enhancers. For example, a genomic DNA methylation pattern analysis of mouse ES cell and neuronal progenitors (NP) identified low-methylated regions (LMRs), which are nonpromoter CpG-poor regions that have an average of less than 30% methylation. Integrative analyses strongly suggest that these LMRs are enhancers because they are DNase I hypersensitive, have chromatin marks associated with active enhancers, are occupied by TFs, and are associated with expression of nearby genes (Stadler et al., Citation2011). Another WGBS study showed that 90% of the regions at which the methylation state changed from methylated in normal colon to unmethylated in colon cancer overlapped with known enhancers (Berman et al., Citation2012). Additionally, a comparison of methylomes for 30 distinct human tissues or cell lines showed that over 26% of the regions displaying dynamic changes in DNA methylation are enhancers occupied by cell-type-specific TFs; in contrast, only 3% of the regions correspond to promoters (Ziller et al., Citation2013). This cell-type-specific demethylation at enhancers was confirmed by studies from the ENCODE and REMC projects (Roadmap Epigenomics Consortium, Citation2015; Thurman et al., Citation2012). Taken together, these studies demonstrate that the level of DNA methylation at enhancers negatively correlates with enhancer activity; thus, DNA methylation can be used to predict enhancer–gene linkages ().
Aran et al. used machine learning to study correlations between DNA methylation at enhancers and gene expression across 58 different cell lines. Strikingly, their results showed that the level of DNA methylation at an enhancer closely anticorrelates with putative target gene expression. Importantly, 53% of the enhancer–gene linkage predictions having a high score (>0.85) were validated by 5C experiments in three cell lines (Aran et al., Citation2013). Starting from interactions identified by ChIA-PET in MCF7 breast cancer cells, Aran et al. also employed anticorrelations (evaluated by Pearson correlation coefficients) between the DNA methylation at enhancers and the expression level of genes physically in contact with the enhancers to identify functional enhancer–gene interactions in breast cancer cases from The Cancer Genome Atlas (TCGA). Their results suggested that enhancer regions associated with gene expression are enriched with cancer-associated risk loci from GWAS and that DNA methylation at enhancers can predict gene expression better than can promoter methylation (Aran & Hellman, Citation2013). Recently, another computational tool called ELMER was developed to integrate DNA methylation and gene expression profiles from primary tissues, to systematically infer multilevel cis-regulatory networks (Yao et al., Citation2015). Using ELMER, investigators can identify disease-specific enhancers, which are then linked to putative target genes using a nonparametric statistical model to evaluate the significance of anticorrelation between the DNA methylation at the enhancer and the expression of putative target genes. ELMER also identifies upstream regulatory TFs that drive the changes in enhancer activity using motif analysis and TF expression profiles. Applying ELMER to TCGA data for 10 distinct cancer types, Yao et al. derived a list of 4280 putative enhancer–TF–gene linkages. A comparison of ChIA-PET enhancer–promoter interactions identified using MCF7 cells (Li et al., Citation2012) with the ELMER predictions in breast cancer confirmed that 166 of the 2038 enhancer–target gene pairs had a physical interaction between the enhancer and the predicted target gene promoter. It should be noted that most studies of expression-associated DNA methylation at enhancers have been limited to the small portion of enhancers that are represented on DNA methylation arrays (typically the Illumina Infinium HM450 array) or that can be analyzed using reduced representation bisulfite sequencing (RRBS); both types of assays cover the majority of promoter regions but are limited in the number of enhancer loci that can be analyzed. Early studies using WGBS to study primary disease tissues have been able to predict enhancers corresponding to disease-specific transcription factor motifs (Berman et al., Citation2012; Hovestadt et al., Citation2014), suggesting that the approaches described earlier will be applicable to future normal versus disease tissue studies and will enable the discovery of additional in vivo putative enhancer–gene linkages.
Instead of simply using the correlation between enhancer activity and gene expression, other studies have integrated multiple layers of genetic and epigenetic data to predict regulatory networks (). For example, studies have included information such as P300 ChIP-seq data, gene ontology (GO) similarities between the TFs and putative target genes, phylogenetic similarity, and genomic proximity to predict target genes within 2 MB intervals centered at enhancers (He et al., Citation2014; Rodelsperger et al., Citation2011). Another study started with eQTL-mapping data to predict target genes of enhancers and then integrated the location of insulators as enhancer-blocking elements, TF co-occurrence, DHSs, and GO similarity terms between the TFs binding to enhancers and nearby genes to validate the eQTL results (Wang et al., Citation2013a). Lu et al. (Citation2013) combined chromatin interaction data from Hi-C experiments and phylogenetic correlations across 45 vertebrate species to predict enhancer–gene linkages.
The above-mentioned computational methods all have advantages and disadvantages in terms of understanding enhancer–gene regulatory networks. One obvious advantage is that most of these approaches are relatively inexpensive. Methods based on dynamic TF binding can provide a list of putative target genes for a particular TF using only a few ChIP-seq and RNA-seq experiments. The efforts of big consortia, such as ENCODE, REMC, and TCGA, have generated genetic and epigenetic profiles for various cell lines and normal or diseased tissues (ENCODE_Project_Consortium, Citation2012; Roadmap Epigenomics Consortium, Citation2015; Weinstein et al., Citation2013) and investigators have made public multiple methods using eQTL, DHS, histone modification, eRNA and DNA methylation to predict individual enhancer–gene linkages (Andersson et al., Citation2014; Aran et al., Citation2013; Corradin et al., Citation2014; Ernst et al., Citation2011; Li et al., Citation2013; Sheffield et al., Citation2013; Shen et al., Citation2012; Thurman et al., Citation2012; Yao et al., Citation2015). Because Hi-C experiments are fairly expensive and computationally time-consuming, there is currently a limited number of cell lines for which comprehensive chromatin interaction data are available; however, it is anticipated that these new technologies will be integrated into the collection of datasets by existing consortia and other groups, such as those funded by NIH’s new 4D nucleome project (https://commonfund.nih.gov/4Dnucleome/index) and the proposed International Nucleome Project (Tashiro & Lanctot, Citation2015). One common disadvantage inherent to all of these association methods is that they provide only predictions of putative target genes. More importantly, the predictions from these methods are limited to cis regulation and the distances allowed between enhancers and putative target genes are limited to 100 kB to 2 MB, depending on the method. As these methods are based on statistical associations, the limitations are largely due to the limited number of samples available in current datasets and can in principle be overcome by profiling large numbers of samples from diverse tissues and individuals. Nevertheless, experimental validation of enhancer–gene pairs is essential to evaluate and improve the accuracy of the various prediction methods. To date, relatively few enhancer–gene pairs have been experimentally validated, but this is changing as new technologies transform our ability to test enhancer activity and predictions of enhancer–gene pairs using high-throughput and efficient techniques.
Identifying target genes of enhancers using experimental validation
Using reporter assays to monitor enhancer activity
A common tool to study gene regulation is the reporter assay, which is based on the expression of certain genes whose activity (monitored as either RNA or protein) is easily identified and measured. Examples of such reporters include luciferase, which is an enzyme catalyzing a reaction with luciferin to produce light; green fluorescent protein (GFP); LacZ which is an enzyme-turning X-gal to blue, and antibiotic-resistant genes, such as neomycin and chloramphenicol acetyltransferase (CAT). In a reporter assay, a regulatory sequence (such as an enhancer of interest) is cloned adjacent to the reporter gene in a plasmid that will be transfected either transiently or stably into cell lines, animals, bacteria, or plants with the function of the regulatory element being monitored as changes in levels or activity of the reporter RNA or protein; transient transfection is often used for human cell lines whereas stable integration is used to create transgenic model organisms such as fruitflies or mice ().
Figure 5. Experimental strategies to study enhancer activity. (A) In transient transfection assays, the enhancer (orange) is placed upstream of reporter gene (green) driven by a heterologous promoter (brown) in a plasmid backbone, and then, the plasmid is transiently transfected into cells. The activity of the enhancer is monitored by the level of reporter RNA or protein. (B) In a transgenic assay, a plasmid containing the enhancer and reporter gene is microinjected into a mouse egg and then integrated into the mouse genome. Enhancer activity is monitored in the embryo using LacZ staining. (C) High-throughput enhancer assays can be used to test enhancer activity. In STARR-seq, potential regulatory elements are inserted between an ORF and a polyA tail and plasmids are transfected into cells; elements that can be detected in the RNA-seq data are functional enhancers. In the massively parallel reporter assay (MPRA), sequence synthesis technology is used to link each potential regulatory element to a unique tag sequence. Then, an ORF is inserted between the element and tag sequence to form plasmids that are transfected into cells. After performing RNA-seq, the enrichment ratio between tag counts in the starting library and in the RNA-seq data is used to identify functional enhancers. In the enhancer-FACS-seq (eFS) method, a pool of potential regulatory elements is cloned upstream of the GFP reporter gene. The plasmids are injected into fly embryos and GFP fly lines are created which are crossed with a fly line that expresses CD2 under control of the tissue-specific enhancer Twi. Embryos from the cross are dissociated and fluorescent-activated cell sorting (FACS) is used to select two group of cells: CD2+GFP+ and CD2+GFP−/+(input). Through sequence enrichment analysis between the two groups, the elements that are functional enhancers can be identified. (see the color version of this figure at www.informahealthcare.com/bmg).
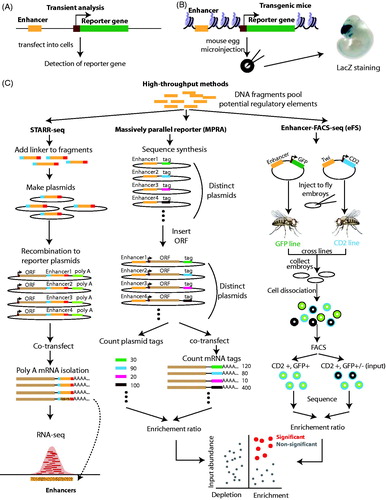
Reporter constructs have classically been used to validate enhancers on a one-by-one basis, but the simplicity of transient transfection, combined with the massive throughput of current sequencing techniques, has recently allowed adaption of the method for high-throughput multiplexed reporter readout (). These methods begin with a plasmid reporter library containing thousands of different putative regulatory elements, with different methods employing different designs for the reporter construct. In the self-transcribing active regulatory regions sequencing (STARR-seq) method, genomic fragments are cloned downstream of a TSS driving an open reading frame (ORF) such that activity of the enhancer results in increased levels of RNAs encoding the enhancer, as detected by RNA-seq (Arnold et al., Citation2013, Citation2014; Shlyueva et al., Citation2014). CapStarr-seq couples the standard STARR-seq protocol with a method by which enhancers of interest are captured by array (Vanhille et al., Citation2015). In the massively parallel reporter assay (MPRA), each reporter construct has a putative enhancer followed by a reporter gene such as GFP with an identifying sequence tag added downstream of the ORF of the reporter gene. Deep sequencing of the mRNA produced from each reporter plasmid in cells transfected with the construct library is then performed to infer corresponding enhancer activity (Kheradpour et al., Citation2013; Melnikov et al., Citation2014; Patwardhan et al., Citation2012; Smith et al., Citation2013). While these high-throughput methods make valuable contributions to validating putative enhancers, they still suffer from the fact that (a) the reporter plasmids do not represent in vivo chromatin conditions, (b) the reporter genes have characteristics that may influence the results (Arnone et al., Citation2004), (c) they do not take into consideration the possibility that enhancers may only regulate promoters with specific characteristics not represented in the minimal promoter used in the reporter plasmid, and (d) the cell line used for the study may lack certain characteristics (e.g. specific TFs) required for activity of a particular enhancer.
As noted previously, studying enhancers identified by chromatin structure using a transient reporter assay may not reproduce the normal in vivo activity of the enhancer because the plasmid lacks chromatin structure and modifications. Thus, stable transfection assays or in vivo transgenic enhancer assays are better models because the enhancer is in a chromatinized state. In addition, transgenic assays allow one to study cell-type-specific and development stage-specific enhancer activity (Attanasio et al., Citation2013; Visel et al., Citation2009a, Citation2009c). Importantly, the spatiotemporal embryonic patterns of enhancer reporter constructs allow high-confidence pairing of enhancers with target genes (Kvon et al., Citation2014; Pfeiffer et al., Citation2008) The VISTA Enhancer Browser is a central repository of experimental validations analyzing human and mouse putative enhancers in transgenic mice; to date, approximately half of the tested elements have shown enhancer activity. Unfortunately, transgenic mice assays are not high throughput. However, highly multiplexed libraries of enhancer reporter constructs have been combined with FACS flow-sorting and next-generation sequencing in a fly transgenic reporter assay called enhancer-FACS-seq (eFS). For eFS, the reporter construct contains a putative enhancer followed by a reporter gene such as GFP (). Cell sorting is used to select cells expressing the reporter gene (GFP) in a specific tissue (identified using a separate tissue-specific reporter gene). Then, the enhancer elements that are active in the selected cells are identified by sequencing (Gisselbrecht et al., Citation2013). In vivo reporter constructs do have fewer caveats than transient assays and have been instrumental in understanding the function of enhancers. However, they still have several drawbacks. As noted earlier, the endogenous function of enhancers often involves looping at long distances between chromosomal domains in the 3D space of the nucleus and this situation is not well reproduced by stably integrated reporter constructs in which the enhancer and promoter are colocated within a very short genomic distance. Reporter constructs can also not reproduce other interactions present in the native chromosomal context, such as the location of the enhancer within a particular TAD.
Analyzing enhancers in their natural chromosomal context
Attempts to alleviate the problems associated with reporter assays lead to the development of new methods by which enhancer function is disrupted within a normal chromosomal context. The underlying rationale for these approaches is that loss or reduction in the activity of a specific enhancer can reveal its natural target genes through consequent changes in gene expression. To delete or disrupt an enhancer, a genomic nuclease must be brought to the enhancer using a sequence-specific DNA-targeting method. The first DNA-targeting method used in genomic technologies consisted of tandem zinc finger DNA-binding domains (based on natural mammalian zinc finger TFs), each of which recognizes three nucleotides. For example, an array of four to six zinc fingers is able to recognize a specific 12–18 nucleotides sequence (Urnov et al., Citation2010), which should theoretically provide genomic specificity (). However, years of efforts in engineering artificial zinc finger proteins suggest that the recognition of DNA by the zinc finger domains is more complex than originally thought. For example, the order of the zinc finger domains within an array may impact on the specificity. Although new strategies for screening and assembling an array of zinc finger modules have been developed (Maeder et al., Citation2008; Sander et al., Citation2011), these strategies are still labor-intensive and not user-friendly. Additionally, a recent study of the genomewide binding pattern of an artificial zinc finger protein suggests that zinc finger proteins have thousands of off-target binding sites (Grimmer et al., Citation2014). Fortunately, zinc finger proteins are not the only platform by which sequence-specific DNA-binding domains can be used for genomic targeting. Transcription activator-like effectors (TALEs) are derived from the bacterial plant pathogen Xanthomona and contain DNA-binding tandem repeats, each of which consists of 33–35 amino acids and can specifically bind to a single nucleotide in a modular fashion (). TALEs have several advantages over zinc finger DNA-binding domains: they are easier to design because each module only recognizes a single nucleotide, easier to construct, and have higher DNA-binding specificity than do zinc fingers (Cermak et al., Citation2011; Gaj et al., Citation2013; Ochiai et al., Citation2014). For both artificial zinc fingers and TALEs, a nonspecific nuclease, such as Fok I, can be fused to the DNA-binding array, creating sequence-specific genomic scissors termed zinc finger nucleases (ZFNs) or TALEs nucleases (TALENs) that can introduce a double-strand break (DSB) at a specific genomic locus. A complication is that the TALE and zinc finger platforms are most commonly used as heterodimers, which means that 2 DNA-targeting constructs must be created for each targeted site and four constructs must be created to delete an enhancer, making these techniques laborious and time-consuming. The most recent DNA-targeting platform is termed clustered regularly interspaced short palindromic repeats (CRISPR). This is an efficient and versatile genomic-targeting tool that utilizes guide RNAs (gRNA) to bring a Cas9 bacterial nuclease to a complementary DNA target (). The CRISPR/Cas9 method, which does not involve a complex assembly process, does not require heterodimerization, and has high targeting specificity, is rapidly becoming the preferred genomic-targeting platform (Cho et al., Citation2014; Sander & Joung, Citation2014).
Figure 6. Experimental strategies to identify target genes. (A) DNA-targeting tools can consist of tandem zinc finger DNA-binding domains, each of which binds to three nucleotides of DNA. Top: fusion of the nonsequence-specific nuclease FokI to zinc finger arrays creates genomic scissors called zinc finger nucleases (ZNFs); dimerization of two ZFNs targeting a specific sequence from opposite sides is required for DNA cleavage. Bottom: effector domains can also be fused to zinc finger arrays; the ZNF-effector proteins do not require heterodimerization to function. (B) DNA-targeting tools can consist of tandem TALE DNA-binding domains, each of which binds to one nucleotide of DNA. Top: fusion of the nonsequence-specific nuclease FokI to the DNA-binding array creates TALENs. Bottom: effector domains can be fused to TALE domains. Similar to ZNFs, two TALENs are necessary to perform a site-specific DNA cleavage, but only one TALE-effector is needed for modify the genome. (C) The CRISPR/Cas9 system utilizes guide RNAs (gRNAs) to bring a Cas9 nuclease to a complementary DNA target to perform site-specific genomic editing. Effector domains can also be fused to a nuclease-deficient Cas9 (dCas9). (D) Genomic-editing tools can be used to create a single DNA cleavage event that disrupts a TF motif. (E) Two sets of heterodimeric ZFNs or TALENs or one pair of guide RNAs can be used to create two DSBs flanking the target enhancer region. The enhancer will be deleted, and the gap will be repaired by nonhomologous end joining (NHEJ). (F) Enhancer activity can be repressed using chromatin-editing tools if an effector domain, such as a DNA methyltransferase (DNMT) that can methylate an enhancer or a histone demethylase (LSD1), that can remove methylation from H3K4me1, is fused to the zinc finger or TALE arrays or to a nuclease-deficient Cas9 (dCas9). (see the color version of this figure at www.informahealthcare.com/bmg).
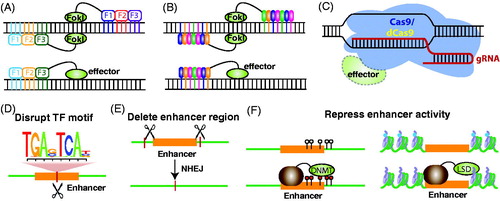
Using genomic-editing tools, multiple studies have successfully inactivated enhancers by introducing a DSB (with consequent alteration of the nucleotides proximal to the cut site) precisely at a critical TF-binding site (). One such study showed that loss of CTCF sites at the boundary of large enhancer regions caused expression changes of genes within the large enhancer domain (Dowen et al., Citation2014). Another study demonstrated that an enhancer located 30 kB upstream of the Mmp13 promoter regulates Mmp13 expression through RUNX2 binding and an enhancer located 10 kB upstream of the promoter represses Mmp13 expression through binding of 1α,25-dihydroxyxitmin D3 (Meyer et al., Citation2015). However, introducing a DSB at a single motif may not totally inactivate an enhancer because enhancers usually consist of a cluster of TF motifs; removing one motif may not substantially affect overall activity of the enhancer. To achieve a total loss of enhancer activity, one can use genomic-editing tools to create two DSBs flanking the target enhancer region; the enhancer will be deleted and the gap will be automatically repaired by nonhomologous end joining (NHEJ) (). Alternatively, one can replace the enhancer by coupling a single DSB with homologous recombination, using a plasmid-containing sequences having homology to the regions flanking the enhancer. One study deleted an allele-specific sequence of a large enhancer located 100 kB downstream of Sox2 in a mouse ESC line and, using allele information, showed that the enhancer is responsible for 90% of Sox2 expression (Li et al., Citation2014); these results were supported by an independent CRISPR/Cas9-mediated enhancer deletion study (Zhou et al., Citation2014). Also, the deletion of enhancers that harbor colorectal cancer-associated SNPs showed dramatic impacts on expression of MYC, even though the enhancer is ∼350 kB away [(Yao et al., Citation2014) and unpublished data]. Another study successfully validated enhancer–gene linkages identified by ChIA-PET or 5C using a TALEN-mediated homologous recombination knockout system (Kieffer-Kwon et al., Citation2013).
Deletion and disruption are not the only in vivo approaches for targeting an enhancer. As described earlier, enhancers are characterized by distinct histone modification and DNA methylation patterns, and thus, artificial modification of these epigenetic marks should be able to influence enhancer activity. Fusing chromatin-modifying domains, such as histone acetylases, histone methylases, DNA methylases, or DNA demethylases, to artificial zinc finger proteins and TALEs can create tools that can enhance or repress enhancer activity (Grimmer et al., Citation2014). Also, fusion of a chromatin-modifying domain to a catalytically deactivated Cas9 (dCas9) can be used to alter the activity of the enhancer at a target sequence (Hilton et al., Citation2015; Kearns et al., Citation2015). A chromatin-modifying tool created by fusion of TALE domains and the lysine-specific demethylase 1 (LSD1) that can demethylate H3K4 showed that four of the nine tested TALE-LSD1 fusions can reduce the level of H3K4me1 or H3K27ac at enhancers and cause downregulation of nearby genes by at least 1.5-fold (Mendenhall et al., Citation2013). Finally, both dCas9-LSD and dCas9-KRAB fusion proteins have been shown to decrease Oct4 and Tbx3 expression upon targeting their distal enhancers in mouse embryonic stem cells. However, the LSD and KRAB effectors appear to use different mechanisms to repress gene expression when tethered to an enhancer (Kearns et al., Citation2015) (). Instead of repressing enhancer activity, another study used a fusion of dCas9 and the p300 histone acetylase transferase domain to increase enhancer activity, upregulating expression of four nearby genes, the farthest of which was 54 kB away (Hilton et al., Citation2015). Although genome-editing and chromatin modification technologies have great potential for the studies of gene regulation networks, these technologies are still in early developmental and low-throughput stages.
Conclusions and future perspectives
Many studies suggest that enhancers are critical regulators of cell-specific phenotypes and that they contribute to the altered transcriptomes of diseased states (Giorgio et al., Citation2015; Groschel et al., Citation2014; Sur et al., Citation2012). However, investigators face many challenges in trying to understand the function of enhancers, including cell-type specificity, flexibility of distances between enhancers and target genes, and multiway interactions between enhancers and target genes. Fortunately, the advent of a plethora of genomewide assays based on next-generation sequencing has revolutionized our ability to interrogate enhancer–gene regulatory networks, enabling a deeper understanding of the roles of enhancers in development and disease. In earlier sections, we described three general approaches to study enhancer–gene regulatory networks: chromosome interaction maps, computational predictions, and experimental validations. However, there are still unanswered questions to consider and additional datasets that must be collected to further our understanding of the mechanisms by which enhancers work.
Are all H3K27Ac-marked enhancers functional?
It is a common assumption in the field that all DHSs that are flanked by nucleosomes having H3K27Ac are active in that cell type. However, recent experiments suggest that this is not necessarily true. For example, reporter studies have shown that only a subset of enhancers predicted by DHS and histone modification are functionally validated using transgenic mouse assays (Nord et al., Citation2013). This may result from limitations of the transgenic mouse model; e.g. only enhancers active in a specific embryonic stage may show functionality or the reporter constructs may lack important higher order chromosomal context as described previously. Alternatively, the relatively low rate of enhancer validation may suggest that DHS and histone modification are not the best way to predict the subset of functional enhancers. For example, in a recent study, enhancers that had lower levels of H3K27Ac were reported to have a higher validation rate in reporter assays than enhancers that had higher levels of that mark (Kwasnieski et al., Citation2014). One can imagine that the level of H3K27Ac at an enhancer is a direct consequence of the efficiency of binding of a TF that can recruit a HAT to that site. However, the most efficient HAT-containing complexes might not include the factors most important for interacting efficiently with promoters via looping. It is possible that all functional enhancers will have some level of H3K27Ac but that not all enhancers with H3K27Ac are functional; clearly, further studies are needed.
Are all enhancer–promoter loops functional?
Three-dimensional nuclear architecture studies clearly show that enhancers physically contact promoters in a cell-type-specific manner and that these interactions are constrained by TADs that are associated with boundary proteins such as CTCF and cohesin. However, the 3D datasets have been collected in relatively few cell types and under a small number of conditions. Fortunately, future improvements in sequencing technologies, further reduction in sequencing costs, and the improvement of computational analysis methods will result in high-resolution chromosome interaction maps becoming available for more and more cell types. At this point, it is not clear if all enhancer–promoter loops can be identified by methods such as Hi-C, or if this method is more amenable for identifying certain classes of structural chromatin interaction loops. More importantly, it is not known if most enhancer–promoter loops are functional. There have been few focused analyses to understand the epigenetic marks that are directly involved in these loops. It is possible that loops mediated by TF–TF interactions between enhancers and promoters could occur prior to the recruitment of critical coactivators needed to stimulate transcription; this could serve as a mechanism for poising genes for proper expression in response to a later developmental or environmental cue. In this sense, the enhancers would be available but not active; perhaps active enhancers are the subset of those distal regulatory elements that loop to promoters and that also recruit a co-activator such as CBP (i.e. the enhancer must be involved in a loop and have H3K27Ac).
How do enhancers choose target genes?
A priori, it would seem reasonable that enhancers would regulate the nearest promoter, and early studies may have propagated this view due to the fact nearby sequences were the easiest to test. However, there is a paucity of data documenting the actual percentage of enhancers that regulate the nearest gene. Most studies that address this question are based on looping assays. For example, a 5C study in K562, GM12878, and Hela cells showed that 73% of the tested distal elements do not link to the nearest gene (Sanyal et al., Citation2012), an RNA polymerase II ChIA-PET study in K562 and MCF7 cells found that ∼40% of the enhancers involved in loops do not interact with the TSS of the nearest gene (Li et al., Citation2012), a CHi-C study in GM12878 cells found that one-third of the distal interactions were not directed to the promoter of the nearest gene (Mifsud et al., Citation2015), and a study using the ELMER computational method found that 85% of tumor-specific enhancers that could be linked to the expression of a nearby gene skipped the nearest gene (Yao et al., Citation2015). The reasons behind this high level of nearest-promoter skipping are not clear. It is possible that the chromatin conformation studies do not have the resolution or read depth to detect looping between closely spaced genomic elements. For example, the CHi-C data, which as noted previously is enriched for reads involving promoters, showed a higher percentage of nearest-gene enhancer loops than did other assays (Mifsud et al., Citation2015). It is also possible that how enhancers choose target genes is affected by genomic or epigenomic context. In support of this hypothesis, multiple studies have shown that a skipped gene is not expressed in that cell type. For instance, the percentage of enhancers interacting with nearest genes in the 5C study in K562, GM12878, and Hela cells increased from 27% to 47% when only expressed genes were used in the analysis (Sanyal et al., Citation2012). Additionally, a study in Drosophila showed that 79% of a set of intragenic enhancers regulates their host gene (Kvon et al., Citation2014) and an ELMER analyses of primary tumors found that 66% of a set of intragenic enhancers were linked to their host gene (Yao et al., Citation2015). This higher percentage of nearest-gene regulation in the set of intragenic enhancers, as compared to the set of all enhancers, may be due to the fact that intragenic enhancers tend to fall within genes that are actively expressed within that cell type; therefore, the nearest promoter to an intragenic enhancer is usually an active promoter. Although these limited studies provide some clues as to how enhancers choose target genes, this important topic still needs further investigation to define the relevant factors ruling target gene selection; e.g., does gene density and/or the presence of a boundary element such as a certain class of CTCF binding sites influence target gene choice? Clearly, it will be important to determine the percentage of “nearest promoter” regulation observed upon enhancer deletion to see whether the same low percentage is observed as in the looping studies. However, this will require large numbers of enhancers to be deleted and, to date, only a handful have been studied in this way (Dowen et al., Citation2014; Kieffer-Kwon et al., Citation2013; Meyer et al., Citation2015; Li et al., Citation2014;Yao et al., Citation2014; Zhou et al., Citation2014).
How do we distinguish direct from indirect actions of enhancers?
In general, predictions for connectivity between genes and enhancers (generated either from chromosome interaction maps or from computational methods) have considered only interactions on the same chromosome and within a defined genomic distance. However, it is theoretically possible that interactions between enhancers and promoters on different chromosomal arms or even on different chromosomes could occur. Genome-editing tools provide the most unbiased method by which to obtain a list of putative target genes. However, even in these cases, assumptions are generally made that the nearest gene that shows a decrease in expression is likely the direct target and that genes located farther away or on other chromosomes are indirectly affected due to changes in cell phenotype caused by a decreased expression of the direct target(s); this is particularly plausible if the nearest gene that shows a change in expression is a TF or a regulator of a signaling pathway. Perhaps one could begin to separate the direct target genes from the indirect target genes in a follow-up experiment by simply providing another copy of the “nearest regulated” target gene at a separate chromosomal location. The consequences of lowered expression of that target gene would then be eliminated and then perhaps only direct targets of the deleted enhancer would show changes in expression.
Acknowledgements
We thank members of the Farnham, Berman, and Coetzee labs at USC for helpful discussions while writing this review.
Declaration of interest
Benjamin P. Berman and Lijang Yao were supported in part by NCI grant 1U01CA184826. Peggy J. Farnham and Lijang Yao were supported in part by NCI grants R01CA136924 and P30CA014089, NHGRI grant U54HG006996, NIEHS grant 1U01ES017154, and NIMH grant RMH103346A. The authors report no declarations of interest.
References
- Akhtar-Zaidi B, Cowper-Sal-lari R, Corradin O, et al. (2012). Epigenomic enhancer profiling defines a signature of colon cancer. Science 336:736–39
- Andersson R, Gebhard C, Miguel-Escalada I, et al. (2014). An atlas of active enhancers across human cell types and tissues. Nature 507:455–61
- Aran D, Hellman A. (2013). DNA methylation of transcriptional enhancers and cancer predisposition. Cell 154:11–13
- Aran D, Sabato S, Hellman A. (2013). DNA methylation of distal regulatory sites characterizes dysregulation of cancer genes. Genome Biol 14:R21
- Arnold CD, Gerlach D, Spies D, et al. (2014). Quantitative genome-wide enhancer activity maps for five Drosophila species show functional enhancer conservation and turnover during cis-regulatory evolution. Nat Genet 46:685–92
- Arnold CD, Gerlach D, Stelzer C, et al. (2013). Genome-wide quantitative enhancer activity maps identified by STARR-seq. Science 339:1074–77
- Arnone MI, Dmochowski IJ, Gache C. (2004). Using reporter genes to study cis-regulatory elements. Methods Cell Biol 74:621–52
- Attanasio C, Nord AS, Zhu Y, et al. (2013). Fine tuning of craniofacial morphology by distant-acting enhancers. Science 342:1241006
- Banerji, J., Rusconi, S. & Schaffner, W. (1981). Expression of a beta-globin gene is enhanced by remote SV40 DNA sequences. Cell 27:299–10
- Bar-Joseph Z, Gerber GK, Lee TI, et al. (2003). Computational discovery of gene modules and regulatory networks. Nat Biotechnol 21:1337–42
- Bengtsson M, Stahlberg A, Rorsman P, et al. (2005). Gene expression profiling in single cells from the pancreatic islets of Langerhans reveals lognormal distribution of mRNA levels. Genome Res 15:1388–92
- Berman BP, Weisenberger DJ, Aman JF, et al. (2012). Regions of focal DNA hypermethylation and long-range hypomethylation in colorectal cancer coincide with nuclear lamina-associated domains. Nat Genet 44:40–6
- Blackwood EM, Kadonaga JT. (1998). Going the distance: a current view of enhancer action. Science 281:60–3
- Blow MJ, McCulley DJ, Li Z, et al. (2010). ChIP-Seq identification of weakly conserved heart enhancers. Nat Genet 42:806–10
- Boland MJ, Nazor KL, Loring JF. (2014). Epigenetic regulation of pluripotency and differentiation. Circ Res 115:311–24
- Boulesteix AL, Strimmer K. (2005). Predicting transcription factor activities from combined analysis of microarray and ChIP data: a partial least squares approach. Theor Biol Med Model 2:23
- Brooker AS, Berkowitz KM. (2014). The roles of cohesins in mitosis, meiosis, and human health and disease. Methods Mol Biol 1170:229–66
- Buecker C, Wysocka J. (2012). Enhancers as information integration hubs in development: lessons from genomics. Trends Genet 28:276–84
- Bulger M, Groudine M. (1999). Looping versus linking: toward a model for long-distance gene activation. Genes Dev 13:2465–77
- Bulger M, Groudine M. (2011). Functional and mechanistic diversity of distal transcription enhancers. Cell 144:327–39
- Castaldi PJ, Cho MH, Zhou X, et al. (2015). Genetic control of gene expression at novel and established chronic obstructive pulmonary disease loci. Hum Mol Genet 24:1200–10
- Cermak T, Doyle EL, Christian M, et al. (2011). Efficient design and assembly of custom TALEN and other TAL effector-based constructs for DNA targeting. Nucleic Acids Res 39:e82
- Cheng C, Min R, Gerstein M. (2011). TIP: a probabilistic method for identifying transcription factor target genes from ChIP-seq binding profiles. Bioinformatics 27:3221–7
- Cho SW, Kim S, Kim Y, et al. (2014). Analysis of off-target effects of CRISPR/Cas-derived RNA-guided endonucleases and nickases. Genome Res 24:132–41
- Cohen ML, Kim S, Morita K, et al. (2015). The GATA factor elt-1 regulates C. elegans developmental timing by promoting expression of the let-7 family microRNAs. PLoS Genet 11:e1005099
- Corradin O, Saiakhova A, Akhtar-Zaidi B, et al. (2014). Combinatorial effects of multiple enhancer variants in linkage disequilibrium dictate levels of gene expression to confer susceptibility to common traits. Genome Res 24:1–13
- Crowley JJ, Zhabotynsky V, Sun W, et al. (2015). Analyses of allele-specific gene expression in highly divergent mouse crosses identifies pervasive allelic imbalance. Nat Genet 47:353–60
- Cuddapah S, Jothi R, Schones DE, et al. (2009). Global analysis of the insulator binding protein CTCF in chromatin barrier regions reveals demarcation of active and repressive domains. Genome Res 19:24–32
- de Wit E, de Laat W. (2012). A decade of 3C technologies: insights into nuclear organization. Genes Dev 26:11–24
- Dekker J, Marti-Renom MA, Mirny LA. (2013). Exploring the three-dimensional organization of genomes: interpreting chromatin interaction data. Nat Rev Genet 14:390–403
- Dekker J, Rippe K, Dekker M, et al. (2002). Capturing chromosome conformation. Science 295:1306–11
- Dixon JR, Jung I, Selvaraj S, et al. (2015). Chromatin architecture reorganization during stem cell differentiation. Nature 518:331–6
- Dixon JR, Selvaraj S, Yue F, et al. (2012). Topological domains in mammalian genomes identified by analysis of chromatin interactions. Nature 485:376–80
- Dong A, Rivella S, Breda L. (2013). Gene therapy for hemoglobinopathies: progress and challenges. Transl Res 161:293–306
- Dostie J, Dekker J. (2007). Mapping networks of physical interactions between genomic elements using 5C technology. Nat Protoc 2:988–1002
- Dostie J, Richmond TA, Arnaout RA, et al. (2006). Chromosome conformation capture carbon copy (5C): a massively parallel solution for mapping interactions between genomic elements. Genome Res 16:1299–309
- Dowen JM, Fan ZP, Hnisz D, et al. (2014). Control of cell identity genes occurs in insulated neighborhoods in mammalian chromosomes. Cell 159:374–87
- Emison ES, McCallion AS, Kashuk CS, et al. (2005). A common sex-dependent mutation in a RET enhancer underlies Hirschsprung disease risk. Nature 434:857–63
- ENCODE_Project_Consortium. (2012). An integrated encyclopedia of DNA elements in the human genome. Nature 489:57–74
- Ernst J, Kheradpour P, Mikkelsen TS, et al. (2011). Mapping and analysis of chromatin state dynamics in nine human cell types. Nature 473:43–9
- Fairfax BP, Makino S, Radhakrishnan J, et al. (2012). Genetics of gene expression in primary immune cells identifies cell type-specific master regulators and roles of HLA alleles. Nat Genet 44:502–10
- Farh KK, Marson A, Zhu J, et al. (2015). Genetic and epigenetic fine mapping of causal autoimmune disease variants. Nature 518:337–43
- Francesconi M, Lehner B. (2014). The effects of genetic variation on gene expression dynamics during development. Nature 505:208–11
- Freedman ML, Monteiro AN, Gayther SA, et al. (2011). Principles for the post-GWAS functional characterization of cancer risk loci. Nat Genet 43:513–18
- Fu J, Wolfs MG, Deelen P, et al. (2012). Unraveling the regulatory mechanisms underlying tissue-dependent genetic variation of gene expression. PLoS Genet 8:e1002431
- Fullwood MJ, Liu MH, Pan YF, et al. (2009). An oestrogen-receptor-alpha-bound human chromatin interactome. Nature 462:58–64
- Fullwood MJ, Ruan Y. (2009). ChIP-based methods for the identification of long-range chromatin interactions. J Cell Biochem 107:30–9
- Gaj T, Gersbach CA, Barbas I., et al. (2013). ZFN, TALEN, and CRISPR/Cas-based methods for genome engineering. Trends Biotechnol 31:397–405
- Gao F, Foat BC, Bussemaker HJ. (2004). Defining transcriptional networks through integrative modeling of mRNA expression and transcription factor binding data. BMC Bioinformatics 5:31
- Giorgio E, Robyr D, Spielmann M, et al. (2015). A large genomic deletion leads to enhancer adoption by the lamin B1 gene: a second path to autosomal dominant adult-onset demyelinating leukodystrophy (ADLD). Hum Mol Genet 24:3143–54
- Gisselbrecht SS, Barrera LA, Porsch M, et al. (2013). Highly parallel assays of tissue-specific enhancers in whole Drosophila embryos. Nat Methods 10:774–80
- Gjoneska E, Pfenning AR, Mathys H, et al. (2015). Conserved epigenomic signals in mice and humans reveal immune basis of Alzheimer's disease. Nature 518:365–9
- Grimmer MR, Stolzenburg S, Ford E, et al. (2014). Analysis of an artificial zinc finger epigenetic modulator: widespread binding but limited regulation. Nucleic Acids Res 42:10856–68
- Groschel S, Sanders MA, Hoogenboezem R, et al. (2014). A single oncogenic enhancer rearrangement causes concomitant EVI1 and GATA2 deregulation in leukemia. Cell 157:369–81
- GTExConsortium. (2015). Human genomics. The genotype-tissue expression (GTEx) pilot analysis: multitissue gene regulation in humans. Science 348:648–60
- Hagege H, Klous P, Braem C, et al. (2007). Quantitative analysis of chromosome conformation capture assays (3C-qPCR). Nat Protoc 2:1722–33
- Handoko L, Xu H, Li G, et al. (2011). CTCF-mediated functional chromatin interactome in pluripotent cells. Nat Genet 43:630–8
- Hatzis P, Talianidis I. (2002). Dynamics of enhancer-promoter communication during differentiation-induced gene activation. Mol Cell 10:1467–77
- Hawkins RD, Hon GC, Yang C, et al. (2011). Dynamic chromatin states in human ES cells reveal potential regulatory sequences and genes involved in pluripotency. Cell Res 21:1393–409
- Hazelett DJ, Rhie SK, Gaddis M, et al. (2014). Comprehensive functional annotation of 77 prostate cancer risk loci. PLoS Genet 10:e1004102
- He B, Chen C, Teng L, et al. (2014). Global view of enhancer-promoter interactome in human cells. Proc Natl Acad Sci U S A 111:E2191–9
- Heintzman ND, Hon GC, Hawkins RD. (2009). Histone modifications at human enhancers reflect global cell-type-specific gene expression. Nature 459:108–12
- Heintzman ND, Stuart RK, Hon G. (2007). Distinct and predictive chromatin signatures of transcriptional promoters and enhancers in the human genome. Nat Genet 39:311–18
- Herz HM, Hu D, Shilatifard A. (2014). Enhancer malfunction in cancer. Mol Cell 53:859–66
- Hilton IB, D'Ippolito AM, Vockley CM, et al. (2015). Epigenome editing by a CRISPR-Cas9-based acetyltransferase activates genes from promoters and enhancers. Nat Biotechnol 33:510–17
- Hindorff LA, Sethupathy P, Junkins HA. (2009). Potential etiologic and functional implications of genome-wide association loci for human diseases and traits. Proc Natl Acad Sci USA 106:9362–7
- Holwerda SJ, de Laat, W. (2013). CTCF: the protein, the binding partners, the binding sites and their chromatin loops. Philos Trans R Soc Lond B Biol Sci 368:20120369
- Honkela A, Girardot C, Gustafson EH, et al. (2010). Model-based method for transcription factor target identification with limited data. Proc Natl Acad Sci USA 107:7793–98
- Hovestadt V, Jones DT, Picelli S, et al. (2014). Decoding the regulatory landscape of medulloblastoma using DNA methylation sequencing. Nature 510:537–41
- Howie B, Fuchsberger C, Stephens M, et al. (2012). Fast and accurate genotype imputation in genome-wide association studies through pre-phasing. Nat Genet 44:955–9
- Hughes JR, Roberts N, McGowan S, et al. (2014). Analysis of hundreds of cis-regulatory landscapes at high resolution in a single, high-throughput experiment. Nat Genet 46:205–12
- Ing-Simmons E, Seitan VC, Faure AJ, et al. (2015). Spatial enhancer clustering and regulation of enhancer-proximal genes by cohesin. Genome Res 25:504–13
- Iyer NG, Ozdag H, Caldas C. (2004). p300/CBP and cancer. Oncogene 23:4225–31
- Jager R, Migliorini G, Henrion M, et al. (2015). Capture Hi-C identifies the chromatin interactome of colorectal cancer risk loci. Nat Commun 6:6178
- Janknecht R. (2002). The versatile functions of the transcriptional coactivators p300 and CBP and their roles in disease. Histol Histopathol 17:657–68
- Jin F, Li Y, Dixon JR, et al. (2013). A high-resolution map of the three-dimensional chromatin interactome in human cells. Nature 503:290–94
- Jones PA. (2012). Functions of DNA methylation: islands, start sites, gene bodies and beyond. Nat Rev Genet 13:484–92
- Kalhor R, Tjong H, Jayathilaka N, et al. (2011). Genome architectures revealed by tethered chromosome conformation capture and population-based modeling. Nat Biotechnol 30:90–8
- Kearns NA, Pham H, Tabak B, et al. (2015). Functional annotation of native enhancers with a Cas9-histone demethylase fusion. Nat Methods 12:401–3
- Kheradpour P, Ernst J, Melnikov A, et al. (2013). Systematic dissection of regulatory motifs in 2000 predicted human enhancers using a massively parallel reporter assay. Genome Res 23:800–11
- Kieffer-Kwon KR, Tang Z, Mathe E, et al. (2013). Interactome maps of mouse gene regulatory domains reveal basic principles of transcriptional regulation. Cell 155:1507–20
- Kioussis D, Vanin E, deLange T, et al. (1983). Beta-globin gene inactivation by DNA translocation in gamma beta-thalassaemia. Nature 306:662–6
- Krivega I, Dale RK, Dean A. (2014). Role of LDB1 in the transition from chromatin looping to transcription activation. Genes Dev 28:1278–90
- Kulozik AE, Kar BC, Serjeant GR, et al. (1988). The molecular basis of alpha thalassemia in India. Its interaction with the sickle cell gene. Blood 71:467–72
- Kvon EZ, Kazmar T, Stampfel G, et al. (2014). Genome-scale functional characterization of Drosophila developmental enhancers in vivo. Nature 512:91–5
- Kwasnieski JC, Fiore C, Chaudhari HG, et al. (2014). High-throughput functional testing of ENCODE segmentation predictions. Genome Res 24:1595–602
- Lan X, Farnham PJ, Jin VX. (2012). Uncovering transcription factor modules using one- and three-dimensional analyses. J Biol Chem 287:30914–21
- Levin ER. (2005). Integration of the extranuclear and nuclear actions of estrogen. Mol Endocrinol 19:1951–9
- Li G, Ruan X, Auerbach RK, et al. (2012). Extensive promoter-centered chromatin interactions provide a topological basis for transcription regulation. Cell 148:84–98
- Li Q, Seo JH, Stranger B, et al. (2013). Integrative eQTL-based analyses reveal the biology of breast cancer risk loci. Cell 152:633–41
- Li Y, Rivera CM, Ishii H, et al. (2014). CRISPR reveals a distal super-enhancer required for Sox2 expression in mouse embryonic stem cells. PLoS One 9:e114485
- Lieberman-Aiden E, van Berkum NL, Williams L, et al. (2009). Comprehensive mapping of long-range interactions reveals folding principles of the human genome. Science 326L:289–93
- Losada A. (2014). Cohesin in cancer: chromosome segregation and beyond. Nat Rev Cancer 14:389–93
- Lu Y, Zhou Y, Tian W. (2013). Combining Hi-C data with phylogenetic correlation to predict the target genes of distal regulatory elements in human genome. Nucleic Acids Res 41:10391–402
- Ma W, Ay F, Lee C, et al. (2015). Fine-scale chromatin interaction maps reveal the cis-regulatory landscape of human lincRNA genes. Nat Methods 12:71–8
- Maeder ML, Thibodeau-Beganny S, Osiak A, et al. (2008). Rapid “open-source” engineering of customized zinc-finger nucleases for highly efficient gene modification. Mol Cell 31:294–301
- Maienschein-Cline M, Zhou J, White KP, et al. (2012). Discovering transcription factor regulatory targets using gene expression and binding data. Bioinformatics 28:206–13
- Melnikov A, Zhang X, Rogov P, et al. (2014). Massively parallel reporter assays in cultured mammalian cells. J Vis Exp 90:e51719
- Melton C, Reuter JA, Spacek DV, et al. (2015). Recurrent somatic mutations in regulatory regions of human cancer genomes. Nat Genet 47:710–16
- Mendenhall EM, Williamson KE, Reyon D, et al. (2013). Locus-specific editing of histone modifications at endogenous enhancers. Nat Biotechnol 31:1133–6
- Meyer MB, Benkusky NA, Pike JW. (2015). Selective distal enhancer control of the Mmp13 gene identified through clustered regularly interspaced short palindromic repeat (CRISPR) genomic deletions. J Biol Chem 290:11093–107
- Mifsud B, Tavares-Cadete F, Young AN, et al. (2015). Mapping long-range promoter contacts in human cells with high-resolution capture Hi-C. Nat Genet 47:598–606
- Nica AC, Parts L, Glass D, et al. (2011). The architecture of gene regulatory variation across multiple human tissues: the MuTHER study. PLoS Genet 7:e1002003
- Noordermeer D, Leleu M, Splinter E, et al. (2011). The dynamic architecture of Hox gene clusters. Science 334:222–5
- Nora EP, Lajoie BR, Schulz EG, et al. (2012). Spatial partitioning of the regulatory landscape of the X-inactivation centre. Nature 485:381–85
- Nord AS, Blow MJ, Attanasio C, et al. (2013). Rapid and pervasive changes in genome-wide enhancer usage during mammalian development. Cell 155:1521–31
- Northcott PA, Lee C, Zichner T, et al. (2014). Enhancer hijacking activates GFI1 family oncogenes in medulloblastoma. Nature 511:428–34
- Ochiai H, Miyamoto T, Kanai A, et al. (2014). TALEN-mediated single-base-pair editing identification of an intergenic mutation upstream of BUB1B as causative of PCS (MVA) syndrome. Proc Natl Acad Sci USA 111:1461–6
- Ong CT, Corces VG. (2014). CTCF: an architectural protein bridging genome topology and function. Nat Rev Genet 15:234–46
- Parelho V, Hadjur S, Spivakov M, et al. (2008). Cohesins functionally associate with CTCF on mammalian chromosome arms. Cell 132:422–33
- Patwardhan RP, Hiatt JB, Witten DM, et al. (2012). Massively parallel functional dissection of mammalian enhancers in vivo. Nat Biotechnol 30:265–70
- Pena-Hernandez R, Marques M, Hilmi K, et al. (2015). Genome-wide targeting of the epigenetic regulatory protein CTCF to gene promoters by the transcription factor TFII-I. Proc Natl Acad Sci USA 112:E677–86
- Peterson KR, Costa FC, Fedosyuk H, et al. (2014). A cell-based high-throughput screen for novel chemical inducers of fetal hemoglobin for treatment of hemoglobinopathies. PLoS One 9:e107006
- Petit F, Jourdain AS, Holder-Espinasse M, et al. (2015). The disruption of a novel limb cis-regulatory element of SHH is associated with autosomal dominant preaxial polydactyly-hypertrichosis. Eur J Hum Genet. [Epub ahead of print]. doi: 10.1038/ejhg.2015.53
- Pfeiffer BD, Jenett A, Hammonds AS, et al. (2008). Tools for neuroanatomy and neurogenetics in Drosophila. Proc Natl Acad Sci USA 105:9715–20
- Phillips-Cremins JE, Sauria ME, Sanyal A, et al. (2013). Architectural protein subclasses shape 3D organization of genomes during lineage commitment. Cell 153:1281–95
- Plank JL, Dean A. (2014). Enhancer function: mechanistic and genome-wide insights come together. Mol Cell 55:5–14
- Pomerantz MM, Ahmadiyeh N, Jia L, et al. (2009). The 8q24 cancer risk variant rs6983267 shows long-range interaction with MYC in colorectal cancer. Nat Genet 41:882–4
- Pope BD, Ryba T, Dileep V, et al. (2014). Topologically associating domains are stable units of replication-timing regulation. Nature 515:402–5
- Porcu E, Sanna S, Fuchsberger C. (2013). Genotype imputation in genome-wide association studies. Curr Protoc Hum Genet. Chapter 1, Unit 1.25
- Qian J, Lin J, Luscombe NM, et al. (2003). Prediction of regulatory networks: genome-wide identification of transcription factor targets from gene expression data. Bioinformatics 19:1917–26
- Quinonez SC, Innis JW. (2014). Human HOX gene disorders. Mol Genet Metab 111:4–15
- Rada-Iglesias A, Bajpai R, Prescott S, et al. (2012). Epigenomic annotation of enhancers predicts transcriptional regulators of human neural crest. Cell Stem Cell 11:633–48
- Rada-Iglesias A, Bajpai R, Swigut T, et al. (2011). A unique chromatin signature uncovers early developmental enhancers in humans. Nature 470:279–83
- Ramasamy A, Trabzuni D, Guelfi S, et al. (2014). Genetic variability in the regulation of gene expression in ten regions of the human brain. Nat Neurosci 17:1418–28
- Rao SS, Huntley MH, Durand NC, et al. (2014). A 3D map of the human genome at kilobase resolution reveals principles of chromatin looping. Cell 159:1665–80
- Roadmap Epigenomics Consortium. (2015). Integrative analysis of 111 reference human epigenomes. Nature 19:317–30
- Rodelsperger C, Guo G, Kolanczyk M, et al. (2011). Integrative analysis of genomic, functional and protein interaction data predicts long-range enhancer-target gene interactions. Nucleic Acids Res 39:2492–502
- Roussos P, Mitchell AC, Voloudakis G, et al. (2014). A role for noncoding variation in schizophrenia. Cell Rep 9:1417–29
- Sander JD, Dahlborg EJ, Goodwin MJ, et al. (2011). Selection-free zinc-finger-nuclease engineering by context-dependent assembly (CoDA). Nat Methods 8:67–9
- Sander JD, Joung JK. (2014). CRISPR-Cas systems for editing, regulating and targeting genomes. Nat Biotechnol 32:347–55
- Sanyal A, Lajoie BR, Jain G. (2012). The long-range interaction landscape of gene promoters. Nature 489:109–13
- Schoenfelder S, Furlan-Magaril M, Mifsud B, et al. (2015). The pluripotent regulatory circuitry connecting promoters to their long-range interacting elements. Genome Res 25:582–97
- Sebastiani P, Farrell JJ, Alsultan A, et al. (2015). BCL11A enhancer haplotypes and fetal hemoglobin in sickle cell anemia. Blood Cells Mol Dis 54:224–30
- Sharma S, Zhou X, Thibault DM, et al. (2014). A genome-wide survey of CD4(+) lymphocyte regulatory genetic variants identifies novel asthma genes. J Allergy Clin Immunol 134:1153–62
- Sheffield NC, Thurman RE, Song L, et al. (2013). Patterns of regulatory activity across diverse human cell types predict tissue identity, transcription factor binding, and long-range interactions. Genome Res 23:777–88
- Shen Y, Yue F, McCleary DF, et al. (2012). A map of the cis-regulatory sequences in the mouse genome. Nature 488:116–20
- Shlyueva D, Stelzer C, Gerlach D, et al. (2014). Hormone-responsive enhancer-activity maps reveal predictive motifs, indirect repression, and targeting of closed chromatin. Mol Cell 54:180–92
- Siebenlist U, Hennighausen L, Battey J, et al. (1984). Chromatin structure and protein binding in the putative regulatory region of the c-myc gene in Burkitt lymphoma. Cell 37:381–91
- Simonis M, Klous P, Splinter E, et al. (2006). Nuclear organization of active and inactive chromatin domains uncovered by chromosome conformation capture-on-chip (4C). Nat Genet 38:1348–54
- Smith RP, Taher L, Patwardhan RP, et al. (2013). Massively parallel decoding of mammalian regulatory sequences supports a flexible organizational model. Nat Genet 45:1021–8
- Stadler MB, Murr R, Burger L, et al. (2011). DNA-binding factors shape the mouse methylome at distal regulatory regions. Nature 480:490–5
- Stewart AJ, Hannenhalli S, Plotkin JB. (2012). Why transcription factor binding sites are ten nucleotides long. Genetics 192:973–85
- Sur IK, Hallikas O, Vaharautio A, et al. (2012). Mice lacking a Myc enhancer that includes human SNP rs6983267 are resistant to intestinal tumors. Science 338:1360–3
- Tashiro S, Lanctot C. (2015). The international nucleome consortium. Nucleus 6:89–92
- Thomassin H, Flavin M, Espinás ML, et al. (2001). Glucocorticoid-induced DNA demethylation and gene memory during development. EMBO J 20:1974–83
- Thurman RE, Rynes E, Humbert R, et al. (2012). The accessible chromatin landscape of the human genome. Nature 489:75–82
- Tolhuis B, Palstra RJ, Splinter E, et al. (2002). Looping and interaction between hypersensitive sites in the active beta-globin locus. Mol Cell 10:1453–65
- Tomlins SA, Rhodes DR, Perner S, et al. (2005). Recurrent fusion of TMPRSS2 and ETS transcription factor genes in prostate cancer. Science 310:644–8
- Urnov FD, Rebar EJ, Holmes MC, et al. (2010). Genome editing with engineered zinc finger nucleases. Nat Rev Genet 11:636–46
- van Berkum NL, Lieberman-Aiden E, Williams L, et al. (2010). Hi-C: a method to study the three-dimensional architecture of genomes. J Vis Exp 39:e1869
- Van Bortle K, Corces VG. (2014). Lost in transition: dynamic enhancer organization across naive and primed stem cell states. Cell Stem Cell 14:693–4
- Vanhille L, Griffon A, Maqbool MA, et al. (2015). High-throughput and quantitative assessment of enhancer activity in mammals by CapStarr-seq. Nat Commun 6:6905
- Vietri Rudan M, Barrington C, Henderson S, et al. (2015). Comparative Hi-C reveals that CTCF underlies evolution of chromosomal domain architecture. Cell Rep 10:1297–309
- Vile GF, Winterbourn CC. (1989). Microsomal lipid peroxidation induced by adriamycin, epirubicin, daunorubicin and mitoxantrone: a comparative study. Cancer Chemother Pharmacol 24:105–8
- Visel A, Blow MJ, Li Z, et al. (2009a). ChIP-seq accurately predicts tissue-specific activity of enhancers. Nature 457:854–8
- Visel A, Rubin EM, Pennacchio LA. (2009c). Genomic views of distant-acting enhancers. Nature 461:199–95
- Vrtacnik P, Ostanek B, Mencej-Bedrac S. (2014). The many faces of estrogen signaling. Biochem Med (Zagreb) 24:329–42
- Wakabayashi Y, Watanabe H, Inoue J, et al. (2003). Bcl11b is required for differentiation and survival of alphabeta T lymphocytes. Nat Immunol 4:533–9
- Wang D, Rendon A, Wernisch L. (2013a). Transcription factor and chromatin features predict genes associated with eQTLs. Nucleic Acids Res 41:1450–63
- Wang Q, Carroll JS, Brown ML. (2005). Spatial and temporal recruitment of androgen receptor and its coactivators involves chromosomal looping and polymerase tracking. Mol Cell 19:631–42
- Wang S, Sun H, Ma J, et al. (2013b). Target analysis by integration of transcriptome and ChIP-seq data with BETA. Nat Protoc 8:2502–15
- Weinstein JN, Collisson EA, Mills GB, et al. (2013). The cancer genome atlas pan-cancer analysis project. Nat Genet 45:1113–20
- Wendt KS, Yoshida K, Itoh T, et al. (2008). Cohesin mediates transcriptional insulation by CCCTC-binding factor. Nature 451:796–801
- Westra HJ, Franke L. (2014). From genome to function by studying eQTLs. Biochim Biophys Acta 1842:1896–1902
- Whitaker JW, Nguyen TT, Zhu Y, et al. (2015). Computational schemes for the prediction and annotation of enhancers from epigenomic assays. Methods 72:86–94
- Yang TP, Beazley C, Montgomery SB, et al. (2010). Genevar: a database and Java application for the analysis and visualization of SNP-gene associations in eQTL studies. Bioinformatics 26:2474–46
- Yao L, Shen H, Laird PW, et al. (2015). Inferring regulatory element landscapes and transcription factor networks from cancer methylomes. Genome Biol 16:105
- Yao L, Tak YG, Berman BP, et al. (2014). Functional annotation of colon cancer risk SNPs. Nat Commun 5:5114
- Yeager M, Xiao N, Hayes RB, et al. (2008). Comprehensive resequence analysis of a 136 kb region of human chromosome 8q24 associated with prostate and colon cancers. Hum Genet 124:161–70
- Yu Y, Wang J, Khaled W, et al. (2012). Bcl11a is essential for lymphoid development and negatively regulates p53. J Exp Med 209:2467–83
- Zhao Z, Tavoosidana G, Sjolinder M, et al. (2006). Circular chromosome conformation capture (4C) uncovers extensive networks of epigenetically regulated intra- and interchromosomal interactions. Nat Genet 38:1341–7
- Zheng R, Blobel GA. (2010). GATA transcription factors and cancer. Genes Cancer 1:1178–88
- Zhou HY, Katsman Y, Dhaliwal NK, et al. (2014). A Sox2 distal enhancer cluster regulates embryonic stem cell differentiation potential. Genes Dev 28:2699–711
- Zhu X, Ling J, Zhang L, et al. (2007). A facilitated tracking and transcription mechanism of long-range enhancer function. Nucleic Acids Res 35:5532–44
- Ziller MJ, Gu H, Muller F, et al. (2013). Charting a dynamic DNA methylation landscape of the human genome. Nature 500:477–81
- Zuin J, Dixon JR, van der Reijden MI, et al. (2014). Cohesin and CTCF differentially affect chromatin architecture and gene expression in human cells. Proc Natl Acad Sci USA 111:996–1001