
The Greek philosopher Zeno of Elea (ca. 490–430 bc), to support Parmenides’ doctrine, took on the project of creating paradoxes to show that the hypothesis that “being” is plural, sustained by Parmenides’ opponents, if properly followed up, leads to surprising results, in particular that motion does not exist. In the arrow paradox, Zeno made the assumption that time is composed of indivisible moments. A flying arrow, during each moment, is occupying a space equal to itself. So, at any instant of time, like in a photograph, the arrow would be at rest. Therefore if at any instant of time the arrow has no motion, temporal locomotion is assumed impossible, since time is composed of multiple freezing instances in succession.
The “freezing” evaluation of residual tracer uptake by Deauville visual scoring (DS or 5-point scale) [Citation1,Citation2] used for reporting interim 18F-fluorodeoxyglucose (FDG) positron emission tomography (iPET) performed in patients with diffuse large B-cell lymphoma (DLBCL) after one or more cycles of chemotherapy returns us to the Zeno’s paradox. This residual uptake, depending on the time point (two cycles or more) at which PET is performed, reflects the response to treatment at that time point, but misses the kinetics of tumor destruction. The rationale of iPET in DLBCL is to identify during first-line therapy fast and slow responders, to decide early changes of treatment (escalation or de-escalation) tailored to specific clinical situations. The metabolic activity of the tumor, assessed by the intensity of the FDG uptake on a FDG-PET scan, decreases in a continuous mode with cell killing during the successive cycles of chemotherapy, and the rate of decrease can differ between two patients despite them having similar residual activity at a given timepoint [Citation3,Citation4].
In the current issue of Leukemia and Lymphoma, Nols and colleagues evaluate different methods of iPET reporting in DLBCL [Citation5]. Using the “freezing” method (analysis of residual uptake on iPET performed after three or four cycles of immunochemotherapy) they found in a retrospective study of 73 patients (all but one treated with an immunochemotherapy regimen) that patients with an iPET DS of 1–3 demonstrated a significantly better outcome than patients with DS of 4–5 in terms of 2-year progression-free survival (PFS) (83 vs. 47%) and overall survival (OS) (91 vs. 58%). iPET was an independent predictor of outcome in a Cox multivariate analysis. Similar conclusions were reached by Itti and colleagues in 114 patients with DLBCL from an international validation study (IVS) all treated by R-CHOP (rituximab, cyclophosphamide, doxorubicin, vincristine, prednisone) or R-ACVBP (rituximab, doxorubicin, cyclophosphamide, vindesine, bleomycin, prednisone) [Citation6]. Three-year PFS and OS estimates were 81 and 91% in patients with DS 1–3 and 59 and 63% in patients with DS 4–5, respectively. Differences between the two series are explicable by differences in timing, since Itti et al. reported data acquired on PET after two cycles and not three or four. Indeed, iPET performed after one or two cycles of chemotherapy evaluates the response of cells with the highest mitotic rate, thereby providing an early evaluation of chemosensitivity of the tumor and identifying responder and non-responder patients [Citation7]. On the other hand, after three or four cycles of therapy FDG uptake is more dependent on tumor regrowth [Citation5]. The discrepant results obtained by Pregno and colleagues using the same criteria (2-year PFS rate 85% for iPET DS 1–3 vs. 72% for iPET DS 4–5) can be explained because they included in the same analysis iPET acquired at two and at four cycles, two time points where iPET has different meanings and different predictive values [Citation8–10].
In DLBCL, the residual uptake observed on iPET after one or more cycles of treatment can be due to the presence of viable tumor cells, benign host cells of the inflammatory reaction to immunochemotherapy or cells of the lymph node microenvironment with either favorable (stromal reaction I) or unfavorable (stromal reaction II) prognostic implications [Citation11]. The mean maximum standardized uptake value (SUVmax) of this residual uptake in DLBCL has been reported with first-generation whole body PET/computed tomography (CT) to be equal to 3.4 ± 2.7 after two cycles, decreasing to 2.9 ± 2.7 after four cycles of R-chemotherapy [Citation9,Citation10]. These values are higher than the mean SUVmax of the liver [Citation12], supporting the use of a Deauville score at least equal to 4 (residual activity over the liver) as cut-off for a positive iPET with resulting good negative predictive values but somewhat low positive predictive values in the various published studies [Citation5,Citation6,Citation8]. The main advantage of the Deauville five-point scale proposed by Barrington et al. is to give the possibility of grading this residual uptake at different times using the same set of criteria and describing in a reproducible manner the changes observed under treatment. Interestingly, Itti et al. have shown that the positive predictive value (PPV) of iPET increases when a DS ≥ 5 (residual activity markedly higher than liver) is applied for PET positivity, reaching a 36% PFS estimate [Citation6]. It has been recently suggested that score 5 should apply to uptake 2–3 times greater than the maximum SUV in the liver, which is in accordance with previous data from Lin et al. who showed a very high PPV (81%) at two cycles by using a SUVmax = 5 cut-off (twice the liver) for the residual lesion [Citation9,Citation13].
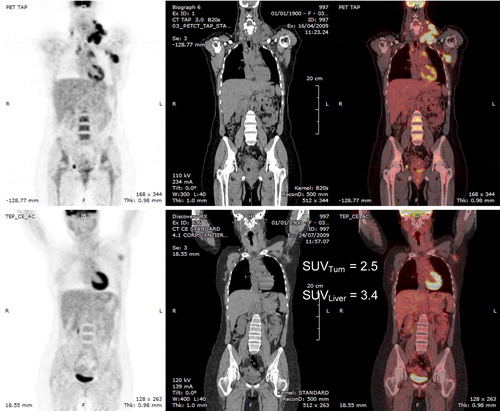
However, even if the DS scale is the best set of criteria to score a residual uptake, it has some shortcomings. It relies on visual assessment of the relative intensities of a residual uptake and a reference region such as the liver. However, the eye is sensitive to differences in contrast and not to differences in intensities. Contrast depends on the activity of the background surrounding the object and on the sharpness of its boundaries. Therefore, a well-demarcated axillary nodal mass surrounded by the low background of the cellular spaces (such as in ) may be perceived to be of equal or even higher intensity than the liver. Although its activity expressed by the SUV is much lower than the liver SUV, it could be misclassified as positive. A semi-quantitative scale, such as a SUV scale, can be used to obviate this limitation but, in this case, the analysis is no longer purely visual. The second shortcoming, returning to the Zeno’s paradox, is that the DS scale, by scoring the residual uptake, leads to a visual dichotomous analysis (positive or negative) of a kinetic phenomenon, which results in a loss of information.
Figure 1. Top: baseline PET/CT in a patient with DLBCL. Bottom: PET/CT after two cycles of R-CHOP; residual uptake in the left axillary lymph node which seems visually equal to or greater than the liver uptake. On the right the SUVmax of the lymph node is lower than the liver SUVmax.
The second method evaluated by Nols and colleagues was the ΔSUVmax technique, which expresses the relative variation between the SUVmax of the lesion with maximum uptake at baseline and the SUVmax of the residual site after one or more cycles of treatment. This quantitative parameter describes the kinetics of tumor destruction. Nols et al. found that patients with a 66% SUVmax reduction demonstrated a significantly better outcome than patients with a ΔSUVmax ≤ 66% in terms of 2-year PFS (78 vs. 50%) and OS (88 vs. 56%). iPET reported with ΔSUVmax was an independent predictor of outcome in a Cox analysis. The results of Nols et al. confirmed the strong and independent prognostic value of iPET, independent from and superior to the age-adjusted international prognostic index (aaIPI).
The superiority of the quantitative analysis over the visual analysis has been shown recently by Casasnovas et al., who reported in a retrospective analysis applied to a trial where treatment was adapted according to visual assessment of iPET that ΔSUVmax at two (with a cut-off of 66%) and four cycles (with a cut-off of 70%) was predictive of PFS, where visual analysis was not [Citation14]. Similar conclusions were reached by Itti et al. in the IVS [Citation6]. They reported after two cycles a 3-year PFS of 79% for patients with ΔSUVmax > 66% vs. 44% for patients with ΔSUVmax ≤ 66%. Three-year overall survival was 89% vs. 46%, respectively. In this series the computation of ΔSUVmax led to better outcome prediction and better reproducibility among observers than DS. Performance was even better in high-risk patients and in patients treated with dose-dense/dose-intense regimens. The lowest percentage of high-risk patients observed in the series of Nols et al. explains why they reported a better outcome prediction with DS than with ΔSUVmax. Indeed, the Menton 2011 consensus statement from the 3rd International Workshop on Interim PET in Lymphoma stated that: “patients showing a low baseline SUVmax < 10.0 may not be suitable for ΔSUVmax analysis, and that visual assessment would be preferred in these cases” [Citation15]. This also applies to patients with a high interim SUVmax > 5.0.
Interestingly, Nols and colleagues found an elegant way to resolve the Zeno’s paradox, i.e. to combine the visual and ΔSUVmax analyses. In such a way they took into account the chemosensitivity, the rate of decrease of the tumor uptake and the level of response after the completion of three or four cycles. They obtained four different risk categories. Forty-six patients were “double negative” (DS 1–3 and ΔSUVmax > 66%). Their outcome was excellent: 2-year PFS = 84%, OS = 91%. Conversely, “double positive” patients (DS 4–5 and ΔSUVmax ≤ 66%, six patients) had a particularly dismal outcome: 2-year PFS = 34%. More than 71% of patients belonged to these two risk categories. They further refined the analysis by combining DS and ΔSUVmax with the IPI. Thirty-three patients had a favorable aaIPI combined with a negative iPET. Their 2-year PFS was 88% and OS was 94%. Five patients had an unfavorable aaIPI combined with a positive iPET by DS and ΔSUVmax. PFS and OS were 0% in this category.
The integrated approach chosen by Nols et al. improves the prognostic value of iPET by combining prognostic indices, tumoral dynamics under treatment and response. This appropriate holistic view, far from freezing the reality, invites us to combine with iPET other markers of the tumoral burden at staging, such as baseline metabolic tumor volume, and to incorporate all pathophysiological information that we can gather from this unique technique of 18FDG-PET/CT.
Supplementary Material
Download Zip (489.2 KB)Potential conflict of interest:
Disclosure forms provided by the authors are available with the full text of this article at www.informahealthcare.com/lal.
References
- Meignan M, Gallamini A, Haioun C. Report on the First International Workshop on Interim-PET-Scan in Lymphoma. Leuk Lymphoma 2009;50:1257–1260.
- Barrington SF, Qian W, Somer EJ, et al. Concordance between four European centres of PET reporting criteria designed for use in multicentre trials in Hodgkin lymphoma. Eur J Nucl Med Mol Imaging 2010;37:1824–1833.
- Cheson BD. Role of functional imaging in the management of lymphoma. J Clin Oncol 2011;29:1844–1854.
- Meignan M, Itti E, Gallamini A, et al. Interim 18F-fluorodeoxyglucose positron emission tomography in diffuse large B-cell lymphoma: qualitative or quantitative interpretation–where do we stand?. Leuk Lymphoma 2009;50:1753–1756.
- Nols N, Mounier N, Bouazza S, et al. Quantitative and qualitative analysis of metabolic response at interim positron emission tomography scan combined with International Prognostic Index is highly predictive of outcome in diffuse large B-cell lymphoma. Leuk Lymphoma 2013;54: [Epub ahead of print].
- Itti E, Meignan M, Berriolo-Riedinger A, et al. An international confirmatory study of the prognostic value of early PET/CT in diffuse large B-cell lymphoma: comparison between Deauville criteria and DeltaSUVmax. Eur J Nucl Med Mol Imaging 2013;40:1312–1320.
- Meignan M. Interim PET in lymphoma: a step towards standardization. Eur J Nucl Med Mol Imaging 2010;37:1821–1823.
- Pregno P, Chiapella A, Bello M, et al. Interim 18-FDG-PET/CT failed to predict the outcome in diffuse large B-cell lymphoma patients treated at the diagnosis with rituximab-CHOP. Blood 2012; 119:2066–2073.
- Lin C, Itti E, Haioun C, et al. Early 18F-FDG PET for prediction of prognosis in patients with diffuse large B-cell lymphoma: SUV-based assessment versus visual analysis. J Nucl Med 2007;48:1626–1632.
- Itti E, Lin C, Dupuis J, et al. Prognostic value of interim 18F-FDG PET in patients with diffuse large B-cell lymphoma: SUV-based assessment at 4 cycles of chemotherapy. J Nucl Med 2009;50:527–533.
- Lenz G, Wright G, Dave SS, et al. Stroma gene signatures in large-B-cell lymphoma. N Engl J Med 2008;359:2313–2323.
- Itti E, Juweid ME, Haioun C, et al. Improvement of early 18F-FDG PET interpretation in diffuse large B-cell lymphoma: importance of the reference background. J Nucl Med 2010;51:1857–1862.
- Meignan M, Barrington S, Itti E, et al. Report on the 4th International Workshop on Positron Emission Tomography in Lymphoma held in Menton, France, 3-5 October 2012. Leuk Lymphoma 2013 Jun 14. [Epub ahead of print]
- Casasnovas RO, Meignan M, Berriolo-Riedinger A, et al. SUVmax reduction improves early prognosis value of interim positron emission tomography scans in diffuse large B-cell lymphoma. Blood 2011;118:37–43.
- Meignan M, Gallamini A, Itti E, et al. Report on the Third International Workshop on Interim Positron Emission Tomography in Lymphoma held in Menton, France, 26-27 September 2011 and Menton 2011 consensus. Leuk Lymphoma 2012;53:1876–1881.