
Abstract
Gain-of-function mutations in the RAS and FLT3 genes are frequently found in cells of acute myeloid leukemia (AML), leading to constitutive activation of signaling pathways that regulate fundamental cellular processes, and are therefore attractive targets for AML therapy. The multi-targeted kinase inhibitor sorafenib is efficacious in AML with FLT3-internal tandem duplication (ITD), but resistance to therapy is an important clinical problem. It is unclear whether AML lacking FLT3-ITD responds to sorafenib. Using AML cell lines, we have shown that a low concentration of sorafenib induces opposing effects depending on the oncogenic background. In FLT3-ITD positive cells sorafenib blocks Erk activity and cell proliferation, and triggers apoptosis. However, in cells lacking FLT3-ITD, sorafenib paradoxically activates Erk2, and stimulates cellular proliferation and metabolic activity. Thus, depending on the genetic context, sorafenib is a beneficial inhibitor or paradoxical activator of mitogenic signaling pathways in AML. These results harbor important consequences in planning clinical trials in AML.
Introduction
Fms-like tyrosine kinase 3 (FLT3) belongs to the class III receptor tyrosine kinases (RTKs), and when activated by its ligand (FL), contributes to survival, proliferation and differentiation in hematopoietic progenitor cells [Citation1,Citation2]. Gain-of-function mutations in the FLT3 gene such as internal tandem duplications (ITDs) in the juxtamembrane domain are observed in acute myeloid leukemia (AML) cells, and these mutations lead to constitutive activation of the tyrosine kinase [Citation2,Citation3]. FLT3 with ITD mutation activates the signal transduction pathways as the native receptor, including the Ras–MAPK (mitogen-activated protein kinase) and the Stat (signal transducer and activator of transcription) pathways [Citation4].
AML is a heterogeneous disease with a dismal outcome in most patients. Although knowledge about the molecular background has increased tremendously in recent years, for the vast majority of patients, cytotoxic therapy has not changed in the last 20 years [Citation5]. Therefore, especially for patients with high-risk AML, new treatment strategies are urgently needed [Citation6].
Sorafenib is a multi-targeted kinase inhibitor of serine/threonine kinases such as Raf as well as tyrosine kinases, including vascular endothelial growth factor (VEGF) receptors [Citation7], and is approved for the treatment of renal cell as well as hepatocellular cancer [Citation8–11]. Recently it was also shown to inhibit oncogenic activation of FLT3-ITD [Citation12,Citation13]. These data led to the conclusion that sorafenib may hold promise in the therapy of AML [Citation14]. However, although beneficial in certain AML subentities such as that with FLT3-ITD, the addition of sorafenib to standard chemotherapy was not superior to placebo in a clinical trial of unselected patients with AML over 60 years of age [Citation15]. As these patients were not selected on the basis of their molecular genotype, we hypothesized that the therapeutic efficacy of sorafenib was highly dependent on the oncogenic signaling context. We were therefore interested to learn whether sorafenib induced different signaling events in cells with or without FLT3-ITD. We took advantage of myeloid 32D cells that become growth-factor independent upon expression of FLT3-ITD [Citation16] and the patient-derived MV4-11 and U937 AML cell lines, with and without FLT3-ITD mutations, respectively. We observed that in AML cells lacking FLT3-ITD, sorafenib induced a paradoxical phosphorylation of C-Raf (known as Raf-1) and extracellular signal-regulated kinase 2 (Erk2). This was associated with an increase in cellular proliferation and metabolism in AML cells lacking FLT3-ITD treated with sorafenib at low concentration.
Materials and methods
Reagents
Sorafenib tosylate (Bay 54-9085) (hereafter referred to as sorafenib) was purchased from Bayer HealthCare (Bayer Schering Pharma, Berlin, Germany) and dissolved in dimethyl sulfoxide (DMSO) to a stock concentration of 1 mM and stored at − 80°C. U0126 (Mek1/2 inhibitor) (New England Biolabs, Frankfurt, Germany) was dissolved in DMSO as 10 mM stock concentration and stored at − 20°C. Propidium iodide (PI) (Sigma-Aldrich, Taufkirchen, Germany) was prepared as 0.5 mg/mL stock concentration in phosphate-buffered saline (PBS) and stored at 4°C. Ribonuclease A (RNase A; Sigma-Aldrich; stock solution 1 mg/mL) and recombinant murine interleukin-3 (rm IL-3) (Immuno Tools, Friesoythe, Germany; stock concentration 50 μg/mL) were prepared in water and stored at − 20°C. Cytarabine (CellPharm, Hannover, Germany) was stored as 412 mM stock solution in 0.9% sodium chloride.
Cell lines
The IL-3-dependent, murine myeloid cell line 32D was obtained from the German Resource Centre of Microorganisms and Cell Cultures (DSMZ, Braunschweig, Germany) and grown in RPMI 1640 (Gibco, Darmstadt, Germany) containing 2 mM l-glutamine and 10% WEHI-3B-conditioned medium as a source of IL-3 or 5 ng/mL recombinant murine IL-3. The murine WEHI-3B cell line (DSMZ) was cultivated in Dulbecco's modified Eagle's medium (DMEM) (Gibco) containing 4 mM l-glutamine and 4.5 g/L d-glucose. The human AML cell line U937 (DSMZ), human acute monocytic leukemia MV4-11 (harboring FLT3-ITD mutation) (DSMZ) and FLT3-ITD-transformed murine myeloid 32D cells (kindly provided by Dr. Hubert Serve, Goethe University, Frankfurt, Germany) were maintained in RPMI 1640 supplemented with 2 mM l-glutamine. All cell culture media were supplemented with 10% heat-inactivated fetal calf serum (PAA, Pasching, Austria) and 1% penicillin/streptomycin (PAA). The WEHI-3B cell line was used for preparing conditioned medium. All experiments were performed on exponentially growing cells. Cells were treated with different sorafenib concentrations and incubated for 48 or 72 h. Mek1/2 inhibitor U0126 (a final concentration of 10 μM) was added to the cells 2 h before sorafenib treatment and incubated for 72 h. Cytarabine was used at 100 nM in U937 cells incubated under standard procedures for 48 h with or without sorafenib (at 200 nM). DMSO (control) was added to cells at equivalent concentration to that in the experimental cells. All cells were cultivated in a humidified atmosphere of 37°C and 5% CO2.
Patient samples
Frozen peripheral blood mononuclear cells taken from three patients with AML were thawed using standard protocols. The blast count before freezing the cells was 53, 68 and 72%, respectively. Thawed cells were washed twice in PBS and then grown in cell culture medium (RPMI 1640; Gibco) containing 2 mM l-glutamine, supplemented with 20% fetal calf serum (PAN Biotech GmbH, Aidenbach, Germany) and 1% penicillin/streptomycin (PAA). Cells (2 × 10⁶ cells/well) were seeded in six-well plates (Greiner Bio One, Frickenhausen, Germany) in a volume of 3 mL medium per well and were treated with sorafenib (final concentration of 10 and 50 nM). As control we used the MV4-11 cell line treated with sorafenib (final concentration of 50 nM). DMSO (control) was added to cells at equivalent concentration to that in the experimental cells (50 nM sorafenib). All cells were cultivated in a humidified atmosphere of 37°C and 5% CO2. Twenty-four hours later the whole-cell lysates were prepared using modified radioimmunoprecipitation assay (RIPA) buffer, and cell extracts (30 μg) were fractioned on 10% sodium dodecyl sulfate (SDS)-polyacrylamide gel and transferred to nitrocellulose membranes (GE Healthcare, Frankfurt, Germany), and analysis of phosphorylated Erk was performed as described below for immunoblot analysis.
In addition, peripheral blood cells of one patient suffering from thyroid cancer were analyzed for phosphorylated Erk on and off treatment with sorafenib. Peripheral blood mononuclear cells were isolated using Ficoll–Paque (density 1.077 g/ml; GE Healthcare) and immunoblotting performed as described below.
Informed consent was obtained from all patients whose blood cells were analyzed.
Immunoblot analysis
Whole-cell lysates were prepared using modified RIPA lysis buffer (50 mM Tris pH7.4, 150 mM NaCl, 1 mM ethylenediaminetetraacetic acid [EDTA], 1% NP-40, 0.25% sodium deoxycholate) containing protease and phosphatase inhibitors (1 mM each phenylmethylsulfonyl fluoride [PMSF], NaF, Na3VO4 and 1 μg/mL each aprotinin, leupeptin, pepstatin) (Sigma-Aldrich). Cell extracts (30 μg or 20 μg) were fractioned on 10% SDS-polyacrylamide or Mini-Protean® TGX stain-free gels (10%, 4–15%, 4–20%; Bio-Rad, Munich, Germany) and transferred to nitrocellulose membranes (GE Healthcare). Immunoblot analysis was performed with the following antibodies: phospho-Erk (sc-7383), p70 S6 kinase α (sc-230) and Raf-1 (sc-133), Erk1/2 (sc-135900) (Santa Cruz Biotechnology, Heidelberg, Germany), phospho-C-Raf (#9427), phospho-Bad (#4366), p44/42 MAPK (Erk1/2) (#9102) and glyceraldehyde 3-phosphate dehydrogenase (GAPDH (#2118) (New England Biolabs), phospho-p70 S6 kinase (PA5-17884) (Thermo Fisher Scientific, Schwerte, Germany) and β-actin (Abcam, Cambridge, UK), and horseradish peroxidase (HRP)-conjugated secondary antibodies were detected by chemiluminescence (GE Healthcare). Membranes were re-probed using Restore™ Western Blot Stripping Buffer (Thermo Fisher Scientific) according to the manufacturer's instructions.
Cell proliferation assays
The number of viable cells was determined by trypan blue dye exclusion test. Cell proliferation was measured with the CellTiter 96® AQueous One Solution Cell Proliferation Assay (MTS; Promega, Mannheim, Germany) according to the manufacturer's instructions. U937 and MV4-11 cells (25 000 cells/well) were seeded in 96-well plates (Greiner Bio One) in a volume of 50 μL medium per well. A 1 mM stock solution of sorafenib was diluted into the culture medium at final concentrations of 0.001, 0.01, 0.1, 1 and 10 μM. DMSO (control) was diluted into the culture medium at equivalent concentration to that in the experimental wells. Subsequently, cells were treated with different concentrations of sorafenib. Seventy-two hours later assays were performed by adding 20 μL CellTiter 96® AQueous One Solution reagent to each well for 2 h. Absorbance was determined at 492 nm in a Sunrise Microplate Reader (Tecan, Grödig, Austria). Six replicate wells were used for each analysis. Data were analyzed using JMP 8.0 statistical software (SAS Institute GmbH, Böblingen, Germany).
To study the effect of the Mek1/2 inhibitor U0126 on cell proliferation, U937 cells (25 000 cells/well) were seeded in a 96-well plate (Greiner Bio One) and incubated for 72 h in the presence of various concentrations (0, 0.001, 0.01, 0.1, 1 and 10 μM) of U0126 or the appropriate amount of DMSO, and cell proliferation was determined by the CellTiter 96® AQueous One Solution Cell Proliferation Assay, as described above. To test effects of the Mek1/2 inhibitor on the MAPK pathway we used a final concentration of 10 μM U0126 on U937 cells.
For cell proliferation analysis by bromodeoxyuridine (BrdU) incorporation (S-phase, determination of cell cycle), 32D and U937 cells were incubated with BrdU (a final concentration of 10 μM; Becton Dickinson [BD] Biosciences, Heidelberg, Germany) for 2 h after sorafenib (0, 10, 30, 50, 200 nM) treatment (48 h). Cells were fixed in 70% ethanol, and HCl (2 M) and Na2B4O7 (0.1 M, pH 8.5) were subsequently added and incubated with anti-BrdU-conjugated Alexa Fluor® 488 antibody (no. 558599; BD) at room temperature. Cells were washed after each step with PBS containing 0.5% bovine serum albumin (BSA). Finally cells were stained with 10 μg/mL final concentration of PI containing RNase A (final concentration of 50 μg/mL) and analyzed using a BD LSR II flow cytometer and FACSDiva 6.1.3 (BD) and Flowjo 7.6 (Tree Star, Inc., Ashland, OR) software. All cells were incubated in a humidified atmosphere of 37°C and 5% CO2.
Determination of phosphorylation of MAPKs
The Proteome Profiler™ Human Phospho-MAPK Array (ARY002B; R&D Systems, Wiesbaden, Germany), in which capture and control antibodies are spotted in duplicate on nitrocellulose membranes, was used to determine the relative phosphorylation levels of 26 kinases including nine MAPKs, according to the manufacturer's instructions. U937 cells were treated with sorafenib (final concentration of 200 nM) for 48 h. The cell lysates were prepared using the buffer provided. Then 300 μg treated and untreated cell lysates were mixed with biotinylated detection antibody and incubated with the membranes, respectively. Finally, after washing away the unbound material, streptavidin HRP and chemiluminescent detection reagents were used to detect phosphorylated proteins.
Apoptosis assay
Murine 32D and FLT3-ITD expressing 32D cells were treated with different concentrations of sorafenib (10, 30, 50, 100 nM). Human U937 and MV4-11 cells were treated with sorafenib at a final concentration of 200 nM and incubated at 37°C for 72 h in a humidified, 5% CO2 atmosphere. Untreated or treated cells with DMSO were used as controls. Seventy-two hours later cells were stained using an Annexin V-FITC [fluorescein isothiocyanate] Apoptosis Detection Kit I (BD Biosciences) according to the manufacturer's instructions. Labeled cells were analyzed using a BD LSR II flow cytometer and FACSDiva 6.1.3 (BD) and Flowjo 7.6 (Tree Star, Inc.) software.
Metabolic assay
Measurement of the extracellular acidification rate (ECAR, mpH/min) and oxygen consumption rate (OCR, pmol/min) was performed with an XF96 Extracellular Flux Analyzer (Seahorse Bioscience, North Billerica, MA). Cell culture media containing 10, 30, 50 and 200 nM sorafenib were prepared from a 4 mM stock solution. DMSO controls were set up using a concentration equivalent to the amount of DMSO in the 200 nM sorafenib media. Then 80 μL of these media containing 35 000 32D or 32D-FLT3-ITD cells were seeded in an XF96 polyethylene terephthalate (PET) 96-well cell culture plate and incubated for 24 h in a humidified atmosphere at 37°C and 5% CO2. Next 80 μL culture medium of the appropriate sorafenib, U0126 or DMSO concentration was added to each well and cells were incubated for an additional 24 h. Additionally an XF96 sensor cartridge was prepared according to the manufacturer's instructions. The reagent delivery ports of the sensor cartridge were loaded with 25 μL of 10 mM d-glucose, 5 μM oligomycin and 100 mM 2-deoxy- d-glucose. Prior to the measurement the culture media of the cell plate were exchanged and cells were resuspended in 175 μL of assay medium followed by 60 min incubation at 37°C without CO2. Calibration and measurement were performed according to the manufacturer's standard protocols for an XF glycolysis stress test.
Normalization was done using a Pierce Bicinchoninic Acid [BCA] Protein Assay Kit (Thermo Scientific). Cells were washed with PBS and lysed by adding 50 μL RIPA buffer per well. The cell plates were stored overnight at 4°C and the protein concentration of each well was determined by measuring the optical density at 540 nm (OD540 nm) with a Sunrise Microplate Reader.
Statistical analysis
Statistical analysis was performed using the software package GraphPad Prism 6 for Mac OS X. Two-way analysis of variance (ANOVA) testing was performed for calculation of significance in cell cycle analyses.
Results
Sorafenib treatment results in opposite effects in 32D cells with or without FLT3-ITD expression
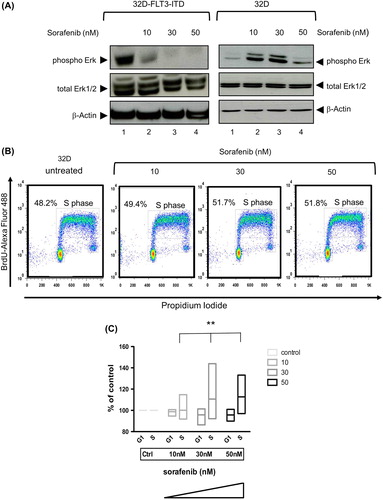
We first analyzed sorafenib-induced apoptosis in the AML model cell line 32D-FLT3-ITD, a murine growth factor independent cell line expressing the FLT3-ITD mutant. This was compared with parental murine 32D cells dependent on IL-3. As expected, sorafenib induced dose-dependent apoptosis in 32D-FLT3-ITD cells (3.3–24.1%, Annexin V-FITC/PI-positive cells, respectively) (Supplementary Figure 1 available online at http://informahealthcare.com/doi/abs/10.3109/10428194.2014.1003055). In keeping with inhibition of oncogenic FLT3 signaling, the phosphorylation of downstream targets such as Erk1/2 was decreased in the FLT3-ITD positive cells [, left panel]. In striking contrast, parental 32D control cells displayed resistance to low concentrations of sorafenib and showed a paradoxical increase in Erk1/2 phosphorylation [, right panel]. We next addressed whether this was associated with a change in cell cycle kinetics using BrdU incorporation in 32D cells. A significant increase of the percentage of cells in S-phase depending on the dose of sorafenib was observed (p < 0.0012) [].
Figure 1. Sorafenib inhibits FLT3 signaling in 32D cells expressing FLT3-ITD but paradoxically induces Erk activity and proliferation in 32D control cells. (A) Immunoblot analyses of Erk activity in 32D-FLT3-ITD (left panel) and 32D (right panel) cell lines. 32D and 32D-FLT3-ITD cells were incubated with different concentrations of sorafenib for 48 h. Cells with DMSO served as control. Whole cell extracts (20 μg) were analyzed by immunoblotting using an antibody against phosphorylated Erk (phospho Erk, 42 and 44 kDa). Total Erk1/2 and β-actin served as loading controls. (B) Flow cytometric analysis of BrdU-Alexa Fluor 488/propidium iodide (PI)-stained cells. 32D cells were treated or untreated with sorafenib for 48 h. (C) Cell cycle determination of five independent experiments using the murine 32D cell line. Shown are cells in G1- and S-phase. Data are presented as percent of control without sorafenib (left). The plot is a “min–max” plot and shows an increase of cells in S-phase depending on increasing sorafenib concentration (p = 0.0012).
We next wanted to assess whether the observed effects of sorafenib on signal transduction and the cell cycle also resulted in metabolic changes. To this end, we simultaneously measured pH as a surrogate parameter for lactate concentration and oxygen consumption in the 32D cell system. As expected, in 32D-FLT3-ITD cells, exposure to sorafenib for 24 h at higher concentration induced a decrease in metabolic activity. In contrast, in 32D control cells, a significant increase in metabolic activity, i.e. oxygen consumption (p < 0.0002) and lactate production (p < 0.0001), was observed (). After the short exposure time of 24 h no apoptosis was detected (data not shown).
Figure 2. Sorafenib enhances glycolytic and respiratory activity in 32D but leads to decreased glycolysis and respiration in 32D-FLT3-ITD cells. The extracellular acidification rate (ECAR) and oxygen consumption rate (OCR) decline in 32D-FLT3-ITD cells but increase significantly in 32D cells after exposure to sorafenib for 24 h (p < 0.0001 ECAR; p < 0.0002 OCR). Addition of U0126 (10 μM) abrogates this effect in 32D cells. ECAR was determined after the addition of glucose, OCR was measured in basal medium without glucose.
From these observations we deduce that sorafenib leads to dephosphorylation of Erk1/2 in 32D-FLT3-ITD but increases phosphorylation of Erk in 32D cells, thereby enhancing proliferation and metabolic activity. The Erk2 inhibitor U0126 abrogated this effect ().
Sorafenib induces a paradoxical activation of Raf/Erk inU937 cells lacking FLT3-ITD expression
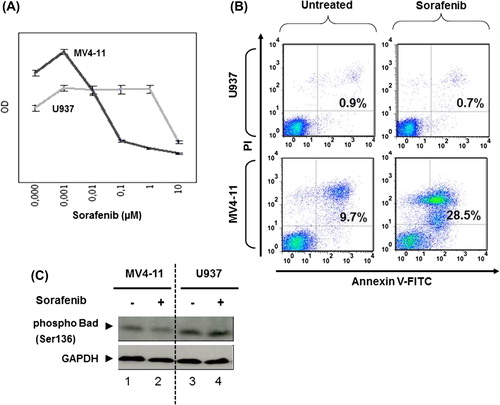
In order to prove that the described results were dependent on the expression of FLT3-ITD, we chose the human AML cell line MV4-11 that expresses FLT3-ITD endogenously [Citation17]. As a human control cell line lacking FLT3-ITD, the AML cell line U937 was selected [Citation18]. Consistent with our model, MV4-11 cells were much more sensitive toward sorafenib as compared to U937 cells with regard to survival. The proliferation of U937 cells was inhibited at high sorafenib concentrations above 1 μM, whereas MV4-11 cells responded to concentrations of 0.01 μM []. Sorafenib induced apoptosis in FLT3-ITD positive MV4-11 cells, whereas FLT3-negative U937 cells were resistant to low concentrations of sorafenib (200 nM) []. In keeping with this, the inhibitory phosphorylation of the pro-apoptotic protein Bad (Bcl-2-associated agonist of cell death) [Citation19,Citation20] was decreased in response to sorafenib only in sensitive MV4-11 cells, but not in resistant U937 cells [].
Figure 3. Sorafenib inhibits FLT3 signaling at low concentration and induces apoptosis in FLT3-ITD expressing cells but not in AML cells lacking FLT3-ITD. (A) Cell proliferation analyzed by CellTiter 96® AQueous One Solution Cell Proliferation Assay using 72 h sorafenib treated or untreated MV4-11 and U937 cells. Data were recorded as optical densities (ODs) (measured from six replicate wells). Standard deviation (SD) is indicated (bars). MV4-11 and U937 cells were treated or untreated with sorafenib (200 nM) for 72 h (B,C). (B) Annexin V-FITC/propidium iodide (PI)-stained cells were analyzed by flow cytometry. Upper right quadrants: apoptotic cells. (C) Immunoblot analyses of Bad phosphorylation. Whole-cell extracts were analyzed by Mini-Protean TGX stain-free gel. Glyceraldehyde-3-phosphate dehydrogenase (GAPDH) served as loading control.
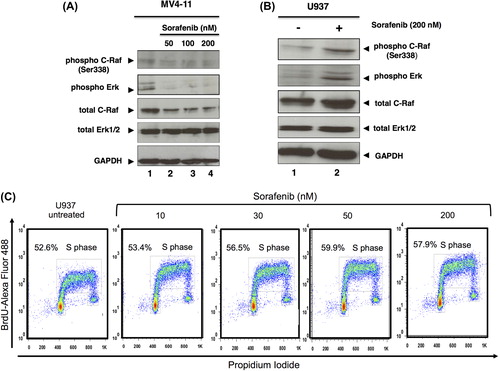
On the basis of our results we further investigated the phosphorylation of molecules involved in FLT3 signaling, including C-Raf and Erk. While in MV4-11 cells we observed the expected decrease of phosphorylation after sorafenib exposure [], the FLT3-ITD negative U937 cells showed an up-regulation in the phosphorylation level of C-Raf (at Ser338) and Erk1/2 upon exposure to sorafenib []. In order to analyze activity of the MAPK pathway on cell proliferation, we analyzed the cell cycle by BrdU uptake in U937 cells. The percentage of cells in S-phase was slightly increased upon exposure to sorafenib [].
Figure 4. Sorafenib inhibits MAPK signaling in MV4-11 but activates it in U937 cells. Immunoblot analysis of phosphorylated C-Raf and Erk using 48 h sorafenib (50, 100, 200 nM) treated or untreated MV4-11 (A) and 72 h sorafenib (200 nM) treated or untreated U937 cells (B). Total C-Raf, Erk1/2 and GAPDH served as loading controls. (C) Flow cytometric analysis of BrdU-Alexa Fluor 488/propidium iodide (PI)-stained cells. U937 cells were treated or untreated with sorafenib for 48 h. The percentage of cells in S-phase as well as G1/G2 is displayed.
We next investigated the phosphorylation level of Erk1/2, c-Jun N-terminal kinases (JNK1–3) and different p38 isoforms (α, β, δ and γ), the MAPK pathway and other intracellular proteins, such as Akt, glycogen synthase kinase 3 (Gsk-3), ribosomal protein S6 kinase (p70 S6 kinase), cAMP responsive element binding (Creb), p53 and mammalian target of rapamycin (mTor) using a Human Phospho-MAPK Array, in which the capture antibodies specific for MAPKs were spotted on a nitrocellulose membrane. We observed that incubation of U937 cells with sorafenib induced increased phosphorylation of Erk2 at Thr185/Tyr187 and Mkk6 (also known as Mek6) at Ser207/Thr211 sites. In contrast the phosphorylation status of Erk1 was unchanged. Also, the phosphorylation levels of the other spotted proteins were very similar to the control array (data not shown).
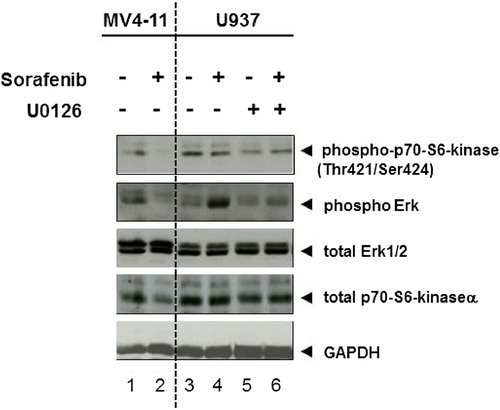
As sorafenib induced phosphorylation of Erk2 in U937 cells, we incubated these cells with the Mek1/2 inhibitor U0126 (final concentration of 10 μM). We found that U0126 abrogated sorafenib stimulated Erk2 activation but did not diminish the basal phosphorylation of Erk2 (, lanes 6 vs. 5). We further analyzed the activity of ribosomal protein S6 kinase (p70 S6 kinase) in U937 cells by immunoblotting, and found a basal phosphorylation of p70S6 kinase (at Thr421/Ser424 sites) that was reduced by U0126 (, lanes 3 vs. 5). As expected, p70 S6 kinase phosphorylation was decreased in response to sorafenib in MV4-11 cells ().
Figure 5. Mek1/2 inhibitor blocks sorafenib-induced Erk2 activity in U937 cells. Immunoblot analysis of p70S6 kinase and Erk1/2 phosphorylation. U937 cells were treated with Mek1/2 inhibitor U0126 (10 μM) and/or sorafenib (200 nM) for 72 h. MV4-11 cells were treated with 200 nM sorafenib for 72 h. Untreated cells were used as controls. Total Erk1/2, p70S6 kinase α and GAPDH served as loading controls.
Paradoxical activation of Erk is observed in primary AML cells lacking FLT3-ITD
We next wanted to know whether the paradoxical activation of Ras-Raf signaling could also be detected in primary AML patient cells lacking FLT3-ITD. To this end, we incubated peripheral blood mononuclear cells of three patients with leukemic AML with sorafenib. shows a representative case indeed suggesting that this activation may also be found in primary AML cells lacking FLT3-ITD. In contrast to the cell lines analyzed, in the primary cases the band for unphosphorylated Erk also appeared stronger, potentially suggesting a transcriptional effect of sorafenib.
Figure 6. Sorafenib induces paradoxical effect in primary AML cells lacking FLT3-ITD and untransformed blood cells. (A) Cells from a leukemic patient suffering from AML lacking FLT3-ITD were isolated, frozen and thawed. After thawing, cells were incubated in medium supplemented with 20% fetal calf serum and incubated for 24 h. Cells were then washed, lysed and immunoblot was performed as described in the “Materials and methods” section. A slight increase of phosphorylated Erk and Erk can be seen (representative experiment). MV4-11 cells with FLT3-ITD treated for 24 h with sorafenib (50 nM) served as positive control. (B) Immunoblot analysis of Erk activity in peripheral blood mononuclear cells from a patient suffering from thyroid carcinoma (TC) with or without (4 weeks after) sorafenib therapy and a healthy donor (control). Whole cell extracts (20 μg) were analyzed by immunoblotting using an antibody against phosphorylated Erk. Total Erk1/2 and β-actin served as loading controls.
Next we addressed the question of whether non- transformed cells also displayed this phenomenon. We therefore analyzed peripheral blood mononuclear cells of a single patient suffering from thyroid cancer under and after stopping sorafenib. shows that here also an increase in phosphorylated Erk could be found.
Taken together, these data imply that sorafenib, a drug commonly used in “targeted” cancer therapy, can induce paradoxical effects on signal transduction that result in an increase of cellular proliferation and metabolic activity in AML cells, depending on the oncogenic background of these cells.
Discussion
AML is thought to be caused by two different classes of mutations: (i) a type I mutation that is a pro-proliferative oncogenic (i.e. gain-of-function) mutation such as a mutation in one of the RAS genes, and (ii) a type II mutation that is commonly a genomic translocation resulting in a gene fusion such as PML (promyelocytic leukemia gene)–RARA (retinoic acid receptor-alpha), CBFβ (core-binding factor beta)–MYH11 (myosin, heavy chain 11, smooth muscle) or RUNX1i (runt-related transcription factor 1)–RUNX1T1 (runt-related transcription factor 1; translocated to, 1; former: AML1–ETO). The complete genomic sequencing efforts published recently showed impressively that most mutations found in the analysis of 200 patients with AML were already known candidate genes [Citation21]. One of the most frequently observed genetic modifications in AML is an in-frame ITD of the FLT3 gene resulting in a constitutive activation of FLT3 kinase. This aberration is associated with a poor outcome. We and others have previously observed that sorafenib is active in FLT3-ITD positive AML [Citation12,Citation13,Citation22]. In addition, rare cases may respond to sorafenib. Recently, sorafenib was also shown to be effective in an imatinib-resistant AML with FIP1L1/PDGFRA T674I mutation [Citation23]. Therefore we proposed a preferential activity of sorafenib especially in FLT3-ITD positive AML. In line with this notion, a recently published randomized clinical trial could not detect a beneficial effect of sorafenib given concomitant with chemotherapy in patients with AML above 60 years of age [Citation15]. In the present study we investigated whether sorafenib induced different effects on myeloid cells depending on their oncogenic background. To this end, we took advantage of murine myeloid 32D cells transformed with FLT3-ITD, and also analyzed human cell lines with this mutation (MV4-11) in comparison with cells without this mutation (U937).
Cells with FLT3-ITD were addicted to this aberrant kinase signaling, as incubation with low concentrations of the multi-targeted kinase inhibitor sorafenib resulted in a blockade of downstream signaling events, which was associated with a decrease of cell proliferation [] and induction of apoptosis in murine (Supplementary Figure 1 available online at http://informahealthcare.com/doi/abs/10.3109/10428194.2014.1003055) and human cells expressing FLT3-ITD []. However, as also shows, U937 cells not expressing FLT3-ITD were rather resistant toward therapeutic concentrations of sorafenib. This was also true for 32D cells without FLT3-ITD (data not shown). When we analyzed the phosphorylation level of down-stream targets, we found that in cells without FLT3-ITD, sorafenib induced a not expected paradoxical up-regulation of phosphorylation in Erk. In this regard we also observed that the sorafenib-induced Erk2 phosphorylation was impaired by the Mek1/2 inhibitor U0126 in U937 cells (, lanes 4 vs. 6).
That kinase inhibitors may unexpectedly activate other kinases has also been described by others recently (examples found in [Citation24–26]). The Raf inhibitors vemurafenib (PLX4032) and PLX4720, developed to treat malignant melanomas, were studied in more detail. In the case of the B-Raf inhibitor vemurafenib, the therapy leads to clinically relevant side effects in that the number of skin cancers other than melanoma significantly increases when patients take the drug [Citation27]. This is due to, at least in part, a paradoxical activation of C-Raf [Citation25,Citation27].
In the cells analyzed in the present study, sorafenib at nanomolar concentrations induced a subtle increase in cell number in MV4-11 and U937 cells [], whereas at higher concentrations, it induced apoptosis preferentially in FLT3-ITD mutated cells []. When analyzing the S-phase of the cell cycle, we observed a slight increase in cells in S-phase at concentrations between 10 and 50 nM in 32D and U937 cells without FLT3 mutations [ and ]. It seems that the intensity and duration of Erk activity (transient or sustained state) may play a role in each experimental system, and is linked to events that alter the cell fates [Citation28].
In addition, a case has been described in which progression of a myeloid leukemia was observed while treating melanoma with vemurafenib; the malignant myeloid cells harbored an oncogenic RAS mutation, while the melanoma showed the B-RAF(V600E) mutation [Citation29]. The paradoxical effects of compensatory activation of Ras-dependent pathways while inhibiting B-Raf have recently been reviewed [Citation30]. In keeping with this, we observed an activation of Erk in primary AML cells lacking FLT3-ITD [].
In the case of sorafenib, we do not know whether the herein described paradoxical effects may engender severe side effects for patients. Using U937 cells and 32D control cells, a dramatic effect on the growth rate was not observed in our hands. In this regard, we observed activation of critical kinases downstream of Raf, and also a slight (but significant) positive effect on the cells in S-phase [ and ]. Whether this may explain the lack of a beneficial effect of sorafenib when given to unselected patients with AML independent of the presence of FLT3-ITD [Citation15] remains to be determined. In this respect, using the myeloid cell line U937, co-incubation of cytarabine and sorafenib somehow diminished the paradoxical effect of sorafenib. The molecular reasons for this observation need to be determined (Supplementary Figure 2 available online at http://informahealthcare.com/doi/abs/10.3109/10428194.2014.1003055).
In summary, we conclude that sorafenib induces opposing effects in AML cell lines: (1) inhibition of MAPK signaling pathway in FLT3-ITD expressing cells and (2) increased activation of Erk2 via C-Raf–Mek1/2 signaling in FLT3 wild-type cells. This is associated with differences in the cell cycle and cell metabolism. The genetic context could therefore be a critical determinant of sorafenib treatment responses in AML that may warrant genetic patient stratification in future clinical trials.
Supplementary material available online
Supplementary Figures 1–2 showing further results.
ilal_a_1003055_sm2240.zip
Download Zip (10 MB)ilal_a_1003055_sm2239.pdf
Download PDF (1.7 MB)Potential conflict of interest
Disclosure forms provided by the authors are available with the full text of this article at www.informahealthcare.com/lal.
This work was supported by: Deutsche Forschungsgemeinschaft, Transregio TRR17, C3 (A.N.), Klinische Forschergruppe KFO210, #3 (A.N.), the Behring-Röntgen Foundation (A.N.) and the German José Carreras Leukemia Foundation (AH06-01; to A.N.).
References
- Turner AM, Lin NL, Issarachai S, et al. FLT3 receptor expression on the surface of normal and malignant human hematopoietic cells. Blood 1996;88:3383–3390.
- Gilliland DG, Griffin JD. The roles of FLT3 in hematopoiesis and leukemia. Blood 2002;100:1532–1542.
- Nakao M, Yokota S, Iwai T, et al. Internal tandem duplication of the flt3 gene found in acute myeloid leukemia. Leukemia 1996;10: 1911–1918.
- Choudhary C, Muller-Tidow C, Berdel WE, et al. Signal transduction of oncogenic Flt3. Int J Hematol 2005;82:93–99.
- Buchner T, Schlenk RF, Schaich M, et al. Acute myeloid leukemia (AML): different treatment strategies versus a common standard arm—combined prospective analysis by the German AML Intergroup. J Clin Oncol 2012;30:3604–3610.
- Schiller GJ. Evolving treatment strategies in patients with high-risk acute myeloid leukemia. Leuk Lymphoma 2014;55:2438–2448.
- Wilhelm SM, Carter C, Tang L, et al. BAY 43-9006 exhibits broad spectrum oral antitumor activity and targets the RAF/MEK/ERK pathway and receptor tyrosine kinases involved in tumor progression and angiogenesis. Cancer Res 2004;64:7099–7109.
- Zhang T, Ding X, Wei D, et al. Sorafenib improves the survival of patients with advanced hepatocellular carcinoma: a meta-analysis of randomized trials. Anticancer Drugs 2010;21:326–332.
- Escudier B. Sorafenib for the management of advanced renal cell carcinoma. Expert Rev Anticancer Ther 2011;11:825–836.
- Escudier B, Eisen T, Stadler WM, et al. Sorafenib in advanced clear-cell renal-cell carcinoma. N Engl J Med 2007;356:125–134.
- Wilhelm S, Carter C, Lynch M, et al. Discovery and development of sorafenib: a multikinase inhibitor for treating cancer. Nat Rev Drug Discov 2006;5:835–844.
- Metzelder S, Wang Y, Wollmer E, et al. Compassionate use of sorafenib in FLT3-ITD-positive acute myeloid leukemia: sustained regression before and after allogeneic stem cell transplantation. Blood 2009;113:6567–6571.
- Mori S, Cortes J, Kantarjian H, et al. Potential role of sorafenib in the treatment of acute myeloid leukemia. Leuk Lymphoma 2008;49:2246–2255.
- Tadmor T, Tallman MS, Polliack A. Sorafenib - a small molecule with big promise? Leuk Lymphoma 2010;51:181–182.
- Serve H, Krug U, Wagner R, et al. Sorafenib in combination with intensive chemotherapy in elderly patients with acute myeloid leukemia: results from a randomized, placebo-controlled trial. J Clin Oncol 2013;31:3110–3118.
- Mizuki M, Fenski R, Halfter H, et al. Flt3 mutations from patients with acute myeloid leukemia induce transformation of 32D cells mediated by the Ras and STAT5 pathways. Blood 2000;96: 3907–3914.
- Lange B, Valtieri M, Santoli D, et al. Growth factor requirements of childhood acute leukemia: establishment of GM-CSF-dependent cell lines. Blood 1987;70:192–199.
- Yao Q, Nishiuchi R, Li Q, et al. FLT3 expressing leukemias are selectively sensitive to inhibitors of the molecular chaperone heat shock protein 90 through destabilization of signal transduction-associated kinases. Clin Cancer Res 2003;9:4483–4493.
- Yang E, Zha J, Jockel J, et al. Bad, a heterodimeric partner for Bcl-XL and Bcl-2, displaces Bax and promotes cell death. Cell 1995; 80:285–291.
- Zha J, Harada H, Yang E, et al. Serine phosphorylation of death agonist BAD in response to survival factor results in binding to 14-3-3 not BCL-X(L). Cell 1996;87:619–628.
- Cancer Genome Atlas Research N. Genomic and epigenomic landscapes of adult de novo acute myeloid leukemia. N Engl J Med 2013;368:2059–2074.
- Metzelder SK, Schroeder T, Finck A, et al. High activity of sorafenib in FLT3-ITD-positive acute myeloid leukemia synergizes with allo-immune effects to induce sustained responses. Leukemia 2012;26:2353–2359.
- Al-Riyami AZ, Hudoba M, Young S, et al. Sorafenib is effective for imatinib-resistant FIP1L1/PDGFRA T674I mutation-positive acute myeloid leukemia with eosinophilia. Leuk Lymphoma 2013;54:1788–1790.
- Hall-Jackson CA, Eyers PA, Cohen P, et al. Paradoxical activation of Raf by a novel Raf inhibitor. Chem Biol 1999;6:559–568.
- Hatzivassiliou G, Song K, Yen I, et al. RAF inhibitors prime wild-type RAF to activate the MAPK pathway and enhance growth. Nature 2010;464:431–435.
- Poulikakos PI, Zhang C, Bollag G, et al. RAF inhibitors transactivate RAF dimers and ERK signalling in cells with wild-type BRAF. Nature 2010;464:427–430.
- Chapman PB, Hauschild A, Robert C, et al. Improved survival with vemurafenib in melanoma with BRAF V600E mutation. N Engl J Med 2011;364:2507–2516.
- Marshall CJ. Specificity of receptor tyrosine kinase signaling: transient versus sustained extracellular signal-regulated kinase activation. Cell 1995;80:179–185.
- Callahan MK, Rampal R, Harding JJ, et al. Progression of RAS-mutant leukemia during RAF inhibitor treatment. N Engl J Med 2012;367:2316–2321.
- Gibney GT, Messina JL, Fedorenko IV, et al. Paradoxical oncogenesis—the long-term effects of BRAF inhibition in melanoma. Nat Rev Clin Oncol 2013;10:390–399.