Abstract
Context: Celecoxib suffers from low and variable bioavailability following oral administration of solutions or capsules. Recent studies proved that chemoprevention of colorectal cancer is possible with celecoxib.
Objective: This work aimed to tailor colon-targeted celecoxib-loaded microparticles using time-dependant and pH-dependant coats. Estimation of drug pharmacokinetics following oral administration to fasted rats was another goal.
Methods: A 23 factorial design was adopted to develop poly-ϵ-caprolactone (PCL) celecoxib-loaded microparticles (F1–F8). To minimize drug-percentages released before colon, another coat of Eudragit® S100 was applied. In vitro characterization of microparticles involved topography, determination of particle size and entrapment efficiency (EE %). Time for 50% drug release (t50%) and drug-percentages released after 2 hours (Q2h) and 4 hours (Q4h) were statistically compared. Estimation of drug pharmacokinetics following oral administration of double-coat microparticles (F10) was studied in rats.
Results: PCL-single-coat microparticles were spherical, discrete with a size range of 60.66 ± 4.21–277.20 ± 6.10 μm. Direct correlations were observed between surfactant concentration and EE%, Q2h and Q4h. The PCL M.wt. and drug: PCL ratio had positive influences on EE% and negative impacts on Q2h and Q4h. When compared to the best achieved PCL-single-coat microparticles (F2), the double-coat microparticles (F10) showed satisfactory drug protection; Q2h and Q4h were significantly (P < 0.01) decreased from 31.84 ± 1.98% and 54.72 ± 2.10% to 15.92 ± 1.78% and 26.93 ± 2.76%, respectively. When compared to celecoxib powder, F10 microparticles enhanced the bioavailability and extended the duration of drug-plasma concentration in rats.
Conclusion: The developed double-coat microparticles could be considered as a promising celecoxib extended-release colon-targeting system.
1. Introduction
Inflammatory bowel disease (IBD), including ulcerative colitis and Crohn’s disease, is becoming a serious problem as a severe, chronic and refractory disease. It usually affects the mucosa of the rectum and colon, exhibiting an unpredictable clinical course which is mainly characterized by rectal bleeding and diarrhea (CitationImaly and Linn, 1988; CitationSimmonds and Rampton, 1994). Anti-inflammatory drugs and 5-Aminosalicylic acid-related drugs are used for treating mild or moderate disease states (CitationArdizzone and Bianchi Porro, 1998). Steroids and immunosuppressive drugs are required for the treatment of more severe inflammation. However, their use is seriously restricted due to toxic side effects following systemic absorption (CitationCampieri et al., 1997).
Various targeted, colon-specific, drug delivery systems were developed depending on covalent drug-linking with a carrier (CitationChourasia and Jain, 2003) coating with pH-sensitive polymers and/or time-dependent polymers (CitationRaffin et al., 2007) or using enzymatically-controlled systems (CitationYehia et al., 2009). The pH-dependent systems represent the leading approach for the site-specific colon delivery of drugs. Of the investigated gastro-resistant polymers, Eudragit® S100 represents a potential candidate for colonic delivery. It has the ability to protect drugs from the low pH of the upper gastrointestinal tract (CitationAshford et al., 1993). The time-dependent polymers like polylactides, polyglycolides and Poly-ϵ-caprolactone (PCL) represent another category that is commonly used to achieve controlled drug delivery to colon. PCL is a biodegradable and biocompatible hydrophobic polymer. It is ideally suitable for long-term drug delivery due to its slow degradation (CitationBarbato et al., 2001). Moreover, it does not generate an acidic environment during degradation compared to poly-lactides or poly-glycolides (CitationSinha et al., 2004).
Designing the previous systems using multiple-units, like microparticles and nanoparticles, is preferred for many reasons (CitationAbdallah et al., 2009); they are less affected by pH, there is a minor risk of dose dumping (CitationNakase et al., 2000), they can improve the absorption, distribution, and bioavailability of acid labile drugs (CitationLamprecht et al., 2001). Finally, they are well retained and exhibit uniform distribution over a large area of colitis sites. The residence time of other delivery systems like tablets or pellets is usually decreased by diarrhea, a common symptom of IBD (CitationMeissner et al., 2006).
The first introduced selective cyclooxygenase-2 inhibitor, celecoxib, is classified as a BCS Class II drug (poor solubility, high permeability) (CitationTan et al., 2009). It is practically insoluble at gastrointestinal pH. Consequently, it suffers from low and variable bioavailability following oral administration of solutions (64–88%) or capsules (20–40%) (CitationPaulson et al., 2001). The oral delivery of celecoxib via microspheres, micro- and nano-particles using chitosan (CitationCheng et al., 2010; CitationThakkar et al., 2004), albumin (CitationThakkar et al., 2005), PCL, Eudragit RS, low viscosity ethylcellulose (CitationHomar et al., 2007), polyethylene oxide, Eudragit S (CitationAli et al., 2007), polylactic acid and poly(lactic-co-glycolic acid) (CitationZvonar et al., 2009) and silica-lipid hybrid microcapsule system composed of medium-chain triglycerides, lecithin and silica (CitationTan et al., 2009) was previously reported in many works. Recent studies proved that chemoprevention of colorectal cancer is already possible with celecoxib (Citationde Heer et al., 2008; CitationSinha et al., 2006). In a parallel line, the safety of celecoxib for treating IBD was previously reported (CitationMahadevan et al., 2002).
The current work focused on the development and in vitro/in vivo evaluation of colon-targeted celecoxib-loaded microparticles. The first part of this study deals with optimization of the experimental variables affecting the preparation of (i) PCL-single-coat microparticles, using a 23 full factorial design, as well as (ii) Eudragit® S100-single-coat microparticles. The second part of this work is concerned with the development of more promising novel double-coat colon-targeted celecoxib-loaded microparticles using a combination of PCL and Eudragit® S100. Finally, the pharmacokinetics of the drug was estimated following oral administration of an aqueous suspension of the double-coat microparticles to rats.
2. Materials and Methods
2.1. Materials
Two grades of poly-ϵ-caprolactone (M.wt. 14,000 and 42,500) were kindly provided by Birmingham polyesters polymers (Birmingham, AL, USA). Eudragit® S100 was donated by RÖhm Pharma Polymers (Darmstadt, Germany). Celecoxib was generously supplied by Hi Pharm Pharmaceuticals Co. (El-obour City, Egypt). Naproxen (used as an internal standard) was provided by Egyptian International Pharmaceutical Industries Co (10th of Ramadan, Egypt). Sorbitan monooleate (Span® 80), polyoxyethylene sorbitan monooleate (Tween® 80), acetonitrile (HPLC grade) and methanol (HPLC grade) were purchased from Sigma-Aldrich Chemicals Co. (St. Louis, MO, USA). Potassium dihydrogen orthophosphate and Disodium hydrogen orthophosphate were obtained from Merck (Darmstadt, Germany). Concentrated hydrochloric acid, liquid paraffin, ethyl alcohol, sodium hydroxide, acetone and n-hexane were obtained from El-Nasr Pharmaceutical Chemicals Co. (Abu Zaabal, Egypt).
2.2. Preparation of celecoxib-loaded microparticles
2.2.1. Preparation of PCL- single -coat celecoxib- loaded microparticles
Experimental design
A 23 full factorial design with three independent variables; (i) PCL M.wt., (ii) drug: PCL ratio and (iii) Span® 80 concentration in the external phase, was set to develop a time-dependant celecoxib-loaded microparticles. Each variable was investigated at two levels representing the lower and higher values (14,000 & 42,500, 1: 0.5 & 1: 1 and 1% & 3%, w/v, respectively). The composition of the prepared formulae (F1–F8) is shown in . The influence of each variable on particle size, EE as well as Q2h and Q4h was studied.
Table 1. A 23 full factorial design of the prepared PCL single-coat celecoxib-loaded microparticles.
PCL single-coat celecoxib-loaded microparticles were prepared according to the method developed by CitationRaffin et al. (2007). Briefly, an accurate amount of PCL was dissolved in acetone (40 mL). After complete dissolution, celecoxib was added and mixed till a uniform solution was obtained. The resulting solution was poured into liquid paraffin (120 mL) containing a specified amount of Span® 80. An oil in oil (o/o) emulsion was formed after homogenization (7000 rpm) for five minutes. The emulsion was mechanically stirred till complete evaporation of the organic solvent. Vacuum filtration was adopted to facilitate the collection of the microparticles. To remove the traces of organic solvent, if present, the microparticles were washed with cyclohexane (50 mL) for two times. Finally, they were dried overnight in a desiccator.
2.2.2. Preparation of Eudragit® S100-single-coat celecoxib-loaded microparticles
Eudragit® S100 single-coat celecoxib-loaded microparticles (formula F9) were prepared using a solvent diffusion technique. Briefly, an accurate amount of celecoxib was suspended in water (100 mL). An equivalent amount of Eudragit® S100 was dissolved in ethyl alcohol (10 mL). The latter solution was poured onto the former suspension. The resulting mixture was homogenized (7000 rpm) for five minutes and then mechanically stirred till complete evaporation of the organic solvent. Microparticles were collected by vacuum filtration, washed with distilled water (50 mL) and dried overnight in a desiccator.
2.2.3. Preparation of double-coat celecoxib-loaded microparticles
An accurate weight of the best achieved PCL-single-coat celecoxib-loaded microparticles (F2) was suspended in a solution containing an accurate amount of Eudragit® S100 (equivalent to celecoxib content in the microparticles) dissolved in ethyl alcohol (10 mL). The resulting suspension was poured into distilled water (100 mL). The resulting mixture was homogenized (7000 rpm) for five minutes and then mechanically stirred till complete evaporation of the organic solvent. Microparticles (formula F10) were treated as previously described.
2.3. Characterization of the Prepared Celecoxib Microparticles
2.3.1. Differential Scanning Calorimetry (DSC)
The possible interactions between celecoxib and other polymers were investigated using DSC. Five milligram samples of celecoxib, PCL, celecoxib: PCL physical mixture (1: 1), Eudragit® S100, celecoxib: PCL: Eudragit® S100 physical mixture (1: 1: 1) and celecoxib-loaded microparticles (formulae F2 and F10) were heated in hermetically sealed aluminium pans over a temperature range of 30 to 200 °C at a constant rate of 10 °C /min under a nitrogen purge (30 ml/min). The DSC thermograms were recorded on a differential scanning calorimeter (DSC-60, Shimadzu, Kyoto, Japan).
2.3.2. X- ray diffraction (XRD)
XRD patterns of celecoxib as well as celecoxib-loaded microparticles (formulae F2 and F10) were determined to check the permanence of the drug in its original crystalline form in the developed microparticles. The XRD patterns of the powdered samples were recorded using a Philips PW 1729 X-ray diffractometer (Legroupe Interconnexion, Saint-Juire, Clubac, Canada) irradiated with mono-chromatized Cu Kα radiation (λ = 1.542 °A) and analyzed between 4 and 50° (2θ). The voltage was 30 kV and the current was 30 mA.
2.3.3. Morphology of the developed microparticles
2.3.3.1. Image analysis optical microscopy
A small amount of each formula was suspended in mineral oil and the suspension was spread onto a microscopy slide. A cover slide was added allowing the suspension to settle homogeneously between the two glass surfaces. The slide was then mounted on an optical microscope and the images of the particles were transferred to a computer through a video camera (JVC, Victor Company, Japan). At least 300 particles were examined for each sample. The shape was analyzed automatically using an image analysis software (Leica Imaging Systems, Cambridge, England).
2.3.3.2. Scanning electron microscopy (SEM)
SEM micrographs were taken to examine the topography and texture of certain celecoxib-loaded microparticles (formulae F2 and F10). Briefly, representative samples were taken and fixed on an a SEM sample holder with double-sided adhesive tape and coated with a layer of gold (150 A°) for 2 min using a sputter coater (Edwards S-150A, England). The samples were examined using a scanning electron microscope (Jeol JSM T20, Tokyo, Japan) using an accelerating voltage of 20 kV.
2.3.4. Determination of Particle size
The mean particle size of representative microparticles from each formula was determined, in triplicate, after dispersion in distilled water using Mastersizer-S laser diffractometer (Malvern Instruments, Malvern, Worcestershire, UK) equipped with 300 mm lens, at 25 ± 0.5 °C.
2.3.5. Determination of entrapment efficiency (EE) percentage
An accurate amount of the prepared microparticles (10 mg) was suspended in methanol (5mL). The suspension was vigorously shaken (10 min) and then placed in a thermostatically-controlled shaker water bath, adjusted at 25 °C, for 2 h to allow complete extraction of the drug in methanol. The accuracy and precision of the extraction method was validated. The suspension was filtered and the supernatant was appropriately diluted with methanol. The drug content was measured spectrophotometrically at 258 nm. The entrapment efficiency percentage was calculated from formula (1)
Where, EE% is the entrapment efficiency percentage, Qs is the actual drug content and Qt the theoretical drug content.
2.3.6. In vitro drug release studies
The in vitro drug release studies of celecoxib-loaded microparticles were performed, in triplicate, in a USP Dissolution Tester Apparatus type II (Paddle method) (VK700 Dissolution Testing Station, Vankel Industries, Inc., NJ, USA) at 37 ± 0.5 °C. The paddles rotated at a speed of 100 rpm. Based on the calculated EE percentages, accurate amounts of celecoxib-loaded microparticles containing the equivalent to 50 mg of celecoxib were used in the studies. The choice of this dose was based on maintaining the sink conditions in the dissolution medium, as estimated from the preliminary saturated solubility studies of celecoxib. A gradient pH was maintained throughout the dissolution testing duration. Initially, 900 mL of 0.1 N HCl with 1% Tween® 80 (% w/v) was adopted as the dissolution medium for the first 2 hs. Following, the pH of the medium was adjusted to 6.8 and was maintained for another 2 hs. Finally, the pH of the medium was set at 7.4 till the end of the study to simulate the pHs pertaining to the stomach, proximal and middle small intestine (duodenum and jejunum), and distal small intestine (ileum), respectively (CitationYehia et al., 2009). Adjustment of the pH of the dissolution medium was carried out using accurate amounts of sodium hydroxide and sodium hydrogen phosphate (CitationKondo et al., 1994). The incorporation of Tween® 80 in the dissolution media was previously reported by (CitationKondo et al., 2005) to maintain the sink conditions for celecoxib release. Aliquot samples (5 mL) of the dissolution media were withdrawn at predetermined time intervals; 0.5, 1, 1.5, 2, 3, 4, 5, 6, 8, and 12 hs. The samples were filtered through a cellulose acetate membrane (0.45 µm). The drug content was determined spectrophotometrically at a wavelength of 258 nm. At each time of withdrawal, 5 mL of fresh medium was replaced into the dissolution flask.
The time required for 50% of drug release (t50%) as well as the drug percentages released after 2 h (Q2h) and 4 h (Q4h) from each formula were calculated. The results were expressed as mean values (± S.D.) of three determinations. Statistical analysis of data (SPSS 14.0, Chicago, USA) was performed applying one way ANOVA at P-value < 0.05. Post Hoc multiple comparisons between formulae were performed using the least square difference test.
2.3.7. Kinetic modeling of dissolution profiles
The dissolution profiles of the drug from all formulae were fitted to zero order, first order, CitationHiguchi model (1963) and Korsmeyer–Peppas (1983) equation (2).
Where, k is a constant incorporating the structural and geometric characteristics of the spherical microparticles, n is the release exponent indicating the drug release mechanism and (Mt / M∞) represents the drug dissolved fraction at time t.
For spherical microparticles, the limiting value of n is 0.5 for Fickian (case I) diffusion release, 1 in case of zero order (case II) release and > 1 for relaxation (super case II) release. The non-Fickian release, corresponding to a coupled diffusion - polymer relaxation (anomalous drug transport), occurs when the n value falls between 0.5 and 1. The model with the highest correlation coefficient was considered to be the best fitting one.
2.4. In vivo absorption studies
2.4.1. Study design
The study was carried out to compare the pharmacokinetics of aqueous suspensions of celecoxib from the best achieved microparticles, formula F10, to celecoxib powder following oral administration of single doses, 30 mg/kg (CitationNiederberger et al., 2001), in rats using a non-blind, two treatment, randomized design. The protocol of the study was approved by the Research Ethics Committee in the Faculty of Pharmacy, Cairo University, Egypt. The study was conducted in accordance with EC Directive 86/609/EEC for animal experiments.
Twelve adult male Wistar rats weighing (200–250 g) were randomly distributed into two groups of equal number. The animals were kept in individual cages under well-defined and standardized conditions (humidity- and temperature-controlled room) and a constant 12 h light and 12 h dark cycle. They were fed with a standard food, water access ad libitum.
Prior to the study day, the rats were cannulated in the right jugular vein, allowed to recover and fast overnight (12 h) (CitationTan et al., 2009). On the study day, each rat in the first group received an aqueous suspension of celecoxib (Treatment A). Based on the calculated EE percentages, the rats of the other group received equivalent doses of celecoxib derived from formula F10 via a similar suspension (Treatment B). Blood samples (0.2 ml) were collected pre-dose (0 time) and at scheduled time intervals (1, 2, 3, 4, 6 and 8 h) and were heparin-treated to prevent blood clotting. The plasma was obtained by centrifugation (3500 g) for 10 min (Centurion Scientific LTD., West Sussex, UK), kept in glass tubes and then frozen at -20˚C. Prior to HPLC analysis, aliquots of plasma (100 μl) were vortex-mixed with equivalent volumes of acetonitrile and centrifuged, as previously described, to precipitate proteins.
2.4.2. Chromatographic conditions
Plasma concentrations of celecoxib were determined using a previously described HPLC procedure by CitationTan et al. (2009) with slight modifications. The mobile phase consisted of a mixture of acetonitrile, methanol, and water (50: 10: 40 v/v, respectively) containing 0.15% (v/v) o-phosphoric acid (pH 3.5), eluted at a flow rate of 1.0 ml/min with UV detection at 254 nm. Naproxen (20 µg/mL) was adopted as an internal standard. The column was a reverse-phase micro-particulate Bondapack C18, particle size 10 μm, 25 cm × 4.6 mm (Waters Corp., Milford, MA, USA). All assays were performed in triplicate.
Under the described conditions, the retention times of naproxen and celecoxib were 4.7 and 6.9 min, respectively. The lower limit of quantification was 0.1µg/mL. Peak areas were determined with a C-R6A chromatopac Shimadzu integrator. A standard curve was constructed by plotting the peak-area ratios of celecoxib and naproxen against celecoxib concentrations in plasma. A linear response (r2 = 0.98) across the full range of concentrations from 0.1 - 10 µg/mL was obtained.
2.4.3. Pharmacokinetic analysis
The pharmacokinetic parameters of the two treatments were estimated for each subject by using WinNonlin® software (Ver. 1.5, Scientific consulting, Inc., Cary, NC, USA) adopting non-compartmental analysis. The maximum drug concentration (Cmax, µg/mL), the time to reach Cmax (Tmax, h), the elimination half life (t50%, h) as well as the mean residence time (MRT(0–∞), h) were obtained from the individual plasma concentration–time curves. The trapezoidal rule method was employed to calculate the area under curve from zero to 8 h (AUC(0–8), μg h/mL) (CitationAbdelbary and Tadros, 2008). The area under curve from zero to infinity (AUC(0–∞), μg h/mL) was calculated using equation (3)
Where, Ct is the drug plasma concentration observed at time t, Ke is the apparent elimination rate constant.
The relative bioavailability (%) was calculated using equation (4)
2.4.4. Statistical analysis
The results are expressed as mean values ± S.D. A Two-way analysis of variance (ANOVA) was performed (SPSS 14.0, SPSS Inc., Chicago, USA) for the data derived from the pharmacokinetic parameters in order to investigate the statistical significance (P-value < 0.05) among groups.
3. Results and Discussion
PCL-single-coat microparticles were successfully fabricated by adoption of a simple o/o emulsification solvent-evaporation method. The selection of the internal and external emulsion phases was based on the solubility of the formulation components; acetone was choosen as an internal organic phase while liquid paraffin was considered for the external organic phase. On the other hand, Eudragit® S100-single-coat microparticles and Eudragit® S100-coated PCL microparticles were successfully prepared by a simple solvent-diffusion method. Both methods were conducted at room temperature.
3.1. DSC studies
The DSC studies were conducted to investigate the presence of interaction between the formulation components. DSC thermograms of celecoxib, PCL, celecoxib: PCL physical mixture and PCL-single-coat microparticles (F2) are shown in (A). It is clear that the DSC thermogram of celecoxib powder exhibits a sharp melting endotherm at 163.20 °C while that of PCL shows an endothermic peak at 65.43 °C related to its melting. The DSC thermograms of the physical mixture or formula F2 show compilations of these peaks. In fact, two endothermic events were observed, in each thermogram, at 65.91°C, 163.43 °C and 60.30 °C, 159.37 °C, respectively. These peaks could be related to the melting points of PCL and celecoxib, respectively. These results suggest that celecoxib does not form a homogeneous phase with the PCL. It could be suggested that the drug crystals are heterogeneously mixed with them (CitationRaffin et al., 2007).
Figure 1. DSC thermograms of celecoxib, PCL, celecoxib: PCL physical mixture and formula F2 (A) and celecoxib, PCL, Eudragit® S100, celecoxib: PCL: Eudragit® S100 physical mixture and formula F10 (B).
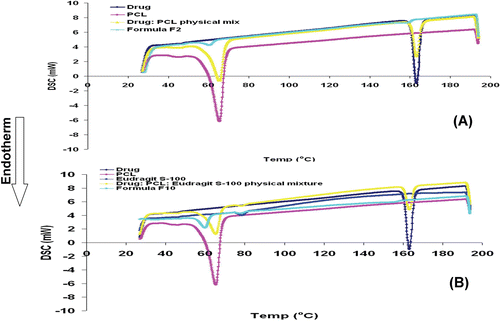
DSC thermograms of celecoxib, PCL, Eudragit® S100, celecoxib: PCL: Eudragit® S100 physical mixture and double-coat microparticles (F10) are shown in (B). The DSC thermogram of Eudragit® S100 shows an endothermic peak at 77.97 °C, corresponding to its melting. The DSC thermograms of the physical mixture shows three endothermic peaks at 65.74 °C, 78.57 °C and 163.43 °C corresponding to the melting points of PCL, Eudragit® S100 and celecoxib, respectively. On the other hand, the DSC thermogram of formula F10 shows two endothermic peaks only at 60.48 °C and 79.06 °C corresponding to the melting points of PCL and Eudragit® S100, respectively. The peak corresponding to the melting point of celecoxib almost disappeared. This could be attributed to the possible change of the drug to an amorphous form. To confirm the previous suggestions, X-ray diffraction studies were conducted.
3.2. X-ray diffractrograms
X-ray powder diffractrograms, showing the inter-plannery distances (d values), of celecoxib and celecoxib-loaded microparticles (Formulae F2 and F10) are depicted in . It is clear that the diffractogram of celecoxib showed two characteristic intensity reflection counts of 548 and 568 at 2θ 16.07 A° and 21.48 A°, respectively.
Figure 2. X-ray diffractrograms of celecoxib (A), formula F2 (B) and formula F10 (C).
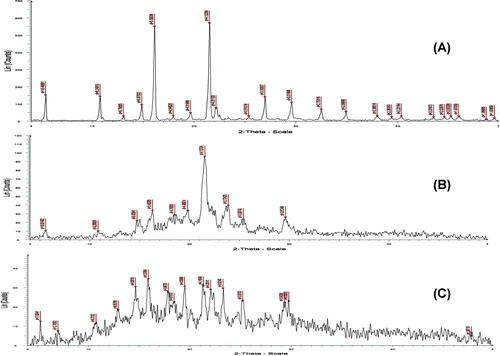
The diffraction pattern of formula F2 showed markedly lower intensity reflection counts of 33.1 and 95.1 at 2θ 16.24 A° and 21.51 A°, respectively. This could be related to the dilution effect. In fact, the recognition of drug-related peaks in the DSC thermograms of F2 microparticles as well as in their X-ray diffractrograms could indicate the permanence of the drug in its original crystalline form (CitationPasserini et al., 2003).
On the other hand, the marked changes in the appearance of the drug-related peaks in the diffractogram of F10 microparticles as well as the marked reductions in their intensity reflection counts could be best described by transition of the drug crystals to an amorphous form rather than by the dilution effect.
3.3. Microparticles’ morphology
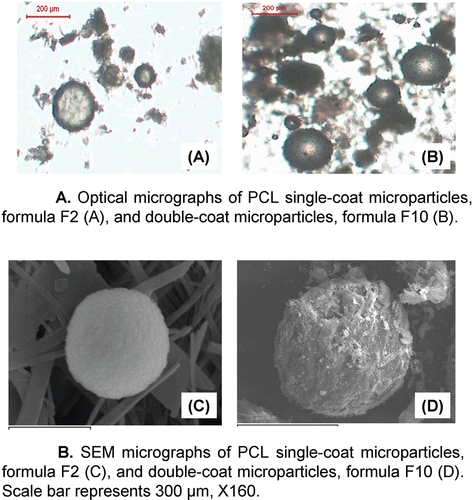
The optical micrographs, illustrated in . A. (A) and (B), revealed the spherical nature of the developed microparticles of formula F2 and F10, respectively. On the other hand, the SEM micrographs, depicted in . B. (C) and (D), were taken to elucidate the topography of these microparticles. PCL-single-coat microparticles (F2) displayed well-defined spherical and discrete particles having relatively smooth surfaces. The addition of the second coat (F10) resulted in the formation of more wrinkled surfaces with a marked increase in the mean particle diameter.
Figure 3. A. Optical micrographs of PCL single-coat microparticles, formula F2 (A), and double-coat microparticles, formula F10 (B). B. SEM micrographs of PCL single-coat microparticles, formula F2 (C), and double-coat microparticles, formula F10 (D). Scale bar represents 300 μm, X160.
3.4. Particle size and EE%
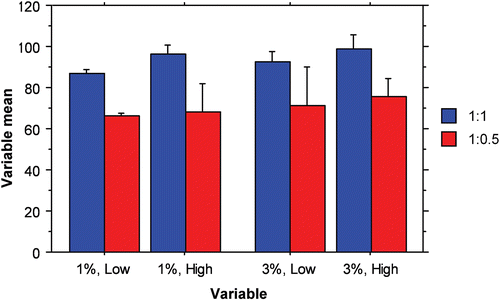
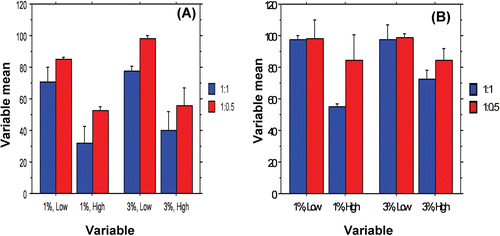
The mean particle size and drug EE% of the prepared microparticles are shown in . Eudragit® S100 single-coat microparticles were the smallest (51.66 ± 2.62 μm). Double-coat microparticles were the largest (350.32 ± 7.89 μm). In between, PCL-single-coat microparticles had a mean size range of 60.66 ± 4.21 μm to 277.20 ± 6.10 μm. All formulae had a satisfactory drug EE% ranging from 66.15 ± 0.07 to 98.75 ± 0.35%. The interaction bar plot representing the influence of the three independent variables; PCL M.wt., drug: PCL ratio and Span® 80 concentration on EE% is shown in .
Table 2. The particle size and the entrapment efficiency % of the prepared celecoxib-loaded microparticles, mean ± S.D., n = 3.
Figure 4. Interaction bar plot representing the effect of PCL M.wt. (low and high), drug: PCL ratio (1:0.5 and 1: 1) and span® 80 concentration (1% and 3%, w/v) on the entrapment efficiency %, mean ± S.D.
3.4.1. Effect of PCL M.wt.
Direct correlations were observed between PCL M.wt. and (i) mean particle size and (ii) drug EE%; the particle size means and drug EE percentages of the formulae prepared with high M.wt PCL (F2, F4, F6 and F8) are significantly larger (P < 0.001) than those derived from their corresponding formulae prepared with low M.wt PCL (F1, F3, F5 and F7, respectively).
These effects could be related to the high viscosity of high M.wt PCL. In fact, the increase in the viscosity of the inner phase containing PCL will minimize the partitioning of the drug into the external phase leading to an increase in mean particle size and drug EE%. Similar findings were reported by CitationFu et al. (2005). It was concluded that the drug EE% of the microparticles is affected by the molecular weight grade of the polymer.
3.4.2. Effect of drug: PCL ratio
A direct correlation was observed between drug: PCL ratio and (i) mean particle size and (ii) drug EE%; the particle size means and drug EE percentages of the formulae prepared with a high drug: PCL ratio (F1, F2, F5 and F6) are significantly larger (P < 0.05) than those derived from their corresponding formulae prepared with a low drug: PCL ratio (F3, F4, F7 and F8, respectively).
Increasing the polymer concentration, from 1: 0.5 to 1: 1, while maintaining the volume of the organic phase constant (40 mL) would produce a marked increment in the viscosity of the internal organic phase. This would enable the formation of larger droplets and subsequently, larger microparticles following solvent evaporation. In a parallel line, the increase in the viscosity of the internal organic phase would minimize the diffusion of the drug into the external phase, resulting in higher drug EE percentages (CitationRodriguez et al., 1998).
3.4.3. Effect of Span® 80 concentration
Increasing Span® 80 concentration from 1% to 3% (w/v) in the continuous oily phase exhibited a reversal in trend between particle size and EE% of celecoxib-loaded microparticles. An inverse correlation was observed between Span® 80 concentration and mean particle size; the particle size means of the formulae prepared with a low surfactant concentration (F1, F2, F3 and F4) are significantly larger (P < 0.05) than those derived from their corresponding formulae prepared with a high surfactant concentration (F5, F6, F7 and F8, respectively).
When Span® 80 was added in a small concentration (1%), it might not be able to cover the entire organic droplet surface. Thereby, some of the droplets would tend to aggregate till the surface area was decreased to such a point that the available amount of surfactant was able to coat the entire surface of the agglomerate and thus forming a stable emulsion with a relatively larger droplets. Consequently, larger microparticles would be produced following solvent evaporation (CitationCastellanos et al., 2001)
The increase in drug EE% of the formulae Span® 80, 3% w/v, could be related to the generation of smaller droplets. It was reported (CitationKrishnamachari et al., 2007) that smaller droplets would result in a greater surface area allowing for rapid solvent evaporation, rapid hardening of microparticles leaving shorter time for drug diffusion to the external phase.
Formula F9 was prepared using a drug: polymer (Eudragit® S100) ratio of 1: 1 similar to the composition of PCL-containing formulae F1 and F2. However, the EE% of the former formula was 68.43 ± 0.68% while the EE% of the latter formulae were 87.18 ± 0.08% and 96.54 ± 0.25%, respectively. This significant difference (P < 0.01) could be related to the difference in the polymer type and M.wt, in addition to the different method of preparation.
The decrease in EE% following double coating of formula F2 from 96.54 ± 0.25% to 69.8 ± 0.77% (formula F10) might be related to the drug extraction occurring during the coating process using Eudragit® S100. These findings are in accordance with those reported by CitationKrishnamachari et al. (2007). It was reported that drug extraction and diffusion into the external phase might take place resulting in an overall decrease in EE%. Practically, ethyl alcohol is a good solvent for Eudragit® S100 and celecoxib.
3.5. In vitro drug release studies
The in vitro drug release profiles from the prepared microparticles were studied in gradually pH-changing buffers ().
Figure 5. The influence of PCL M.wt. and drug: PCL ratio on in vitro drug release from PCL single-coat microparticles prepared using Span® 80 (1%, w/v) at 37 ± 0.5 °C (mean ± S.D., n = 3).
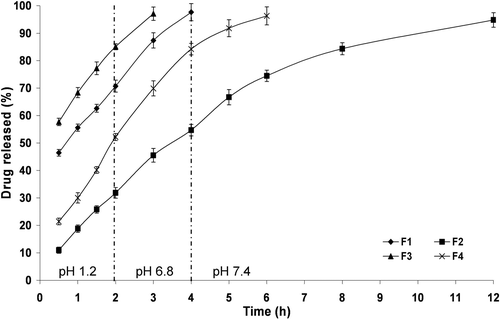
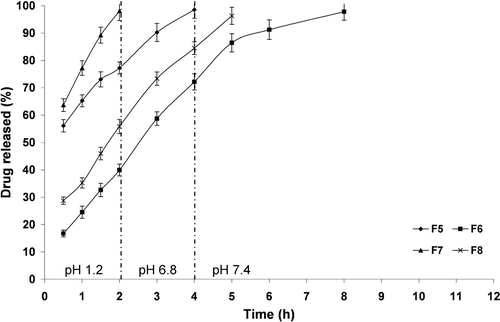
Figure 6. The influence of PCL M.wt. and drug: PCL ratio on in vitro drug release from PCL single-coat microparticles prepared using Span® 80 (3%, w/v) at 37 ± 0.5 °C (mean ± S.D., n = 3).
shows the influence of PCL M.wt. and drug: PCL ratio on in vitro drug release from PCL single-coat microparticles formulae (F1–F4) prepared using Span® 80 (1%, w/v) at 37 ± 0.5 °C. It could be concluded that more significant (P < 0.01) retardation of the drug release profiles was observed with formulae F2 and F4, prepared using high M.wt. PCL. The superiority of formula F2, over formula F4, could be attributed to the incorporation of a PCL in a higher ratio.
shows the influence of PCL M.wt. and drug: PCL ratio on in vitro drug release from PCL single-coat microparticles formulae (F5–F8) prepared using Span® 80 (3%, w/v) at 37 ± 0.5 °C. High M.wt. PCL-containing formulae (F6 and F8) showed more significant (P < 0.05) retardation of the drug release profiles. The incorporation of a PCL in a higher ratio (formula F6) promoted further retardation of the drug release profiles.
Mathematical modeling and kinetic treatment of the drug release profiles for the investigated PCL-single-coat microparticles; formulae (F1–F8) is shown in (). The n values of High M.wt. PCL-containing formulae (F2, F4, F6 and F8) were between 0.5 and 1 indicating non-Fickian release; a combination of drug diffusion and polymer relaxation mechanism. The lower n values of low M.wt. PCL-containing formulae (F1, F3, F5 and F7) could indicate Fickian diffusion release. The highest mean t50% (3.55 h) was achieved with formula F2. The minimum retardation in the drug release rates was observed with the drug release profile of formula F7 having a mean t50% of 0.18 h only.
Table 3. Mathematical modeling and release kinetics of celecoxib from the investigated microparticles.
The negative influences of PCL M.wt. and drug: PCL ratio on the drug release rates could be attributed to the increase in the microenvironmental viscosity which may act as a barrier against drug diffusion across the microparticles.
The Span® 80 concentration in the external phase has a significant impact on the retardation of the drug release profiles. PCL-single-coat microparticles (F5–F8) prepared following incorporation of Span® 80 in a higher level have significantly (P < 0.05) faster drug release rates than their corresponding formulae (F1–F4) prepared with a lower Span® 80 concentration. This could be attributed to the generation of smaller droplets and consequently smaller microparticles following solvent evaporation. The incorporation of high percentage of smaller microparticles is usually accompanied by faster drug release rates.
The drug percentages released after 2 h (Q2h) and 4 h (Q4h) were taken as indices to evaluate the ability of the designed systems to provide protective drug barriers till reaching the colon (pH 7.4). shows the interaction bar plots representing the effect of the investigated variables on Q2h and Q4h. It could be estimated that higher drug release percentages (Q2h and Q4h) were achieved with those formulae prepared using lower M.wt. PCL (F1, F3, F5 and F7), lower drug: PCL ratio (F3, F4, F7 and F8) or higher Span® 80 concentration (F5, F6, F7 and F8). In other words, formula F2 [prepared using a higher M.wt PCL, higher drug: PCL ratio and lower Span® 80 concentration] was considered for further optimization studies.
Figure 7. Interaction bar plots representing the effect of PCL M.wt. (low and high), drug: PCL ratio (1:0.5 and 1: 1) and Span® 80 concentration (1% and 3%, w/v) on Q2h (A) and Q4h (B), mean ± S.D.
In fact, significantly (P < 0.01) more retarded drug release rates (mean t50% = 3.55 h) and significantly (P < 0.05) lower Q2h (31.84 ± 1.98%) and Q4h (54.72 ± 2.10%) were achieved with the latter formula. Nevertheless, the utilization of a time-dependent PCL-single-coat alone was inefficient in providing a protective drug barrier till reaching the colon.
In another attempt (formula F9), the drug particles were coated with Eudragit® S100 as a single protective enteric polymer. The drug: polymer ratio was 1: 1. shows a differential pH-dependent drug release profile for formula F9. The Q2h and Q4h were only 14.61 ± 2.56% and 23.77 ± 3.13%, respectively. However, upon shifting the pH to 7.4, corresponding to the pH of the ileocecal region of the GIT, the enteric polymer dissolved and the remaining drug was rapidly released reaching 96.92 ± 3.29% within two hours post pH shifting.
Figure 8. In vitro drug release from PCL single-coat microparticles (F2), Eudragit® S100 single-coat microparticles (F9) and double-coat microparticles (F10) at 37 ± 0.5 °C (mean ± S.D., n = 3).
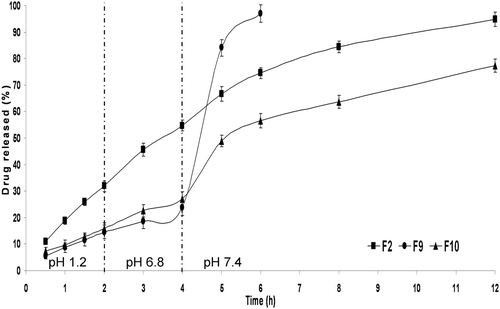
In the last attempt, the best achieved PCL-single-coat microparticles (formula F2) was extra-coated with an enteric polymer, formula F10. The ratio of drug: PCL: Eudragit® S100 was 1: 1: 1. When compared to formula F2, the double-coat microparticles significantly (P < 0.01) decreased the Q2h and Q4h, corresponding to the drug release percentages at lower pH regions of the GIT, from 31.84 ± 1.98% and 54.72 ± 2.10% to 15.92 ± 1.78% and 26.93 ± 2.76%, respectively. When compared to formula F9, the remaining drug was slowly released in a controlled manner reaching 77.27 ± 2.53% within 8 hours post pH shifting to 7.4. As previously reported by CitationKrishnamachari et al. (2007), this drug release pattern would promote a site-specific controlled drug delivery to the terminal ileocecal region.
Mathematical modeling and kinetic treatment of the drug release profiles of the formulae F9 and F10 is shown in . The n value of formula F9 is > 1, indicating; super case II (relaxation) release. Polymer relaxation would facilitate drug transport as a result of a reduction in the attractive forces among polymer chains. On the other hand, the drug release profile of formula F10 followed first order kinetics.
Among the investigated formulae (F1–F10), formula F10 was considered for further in vivo studies as it provided a site-specific controlled drug delivery following pH shifting to 7.4 with a significantly (P < 0.01) more retarded drug release rate (mean t50% = 5.37 h) and significantly (P < 0.01) lower Q2h (15.92 ± 1.78%) and Q4h (26.93 ± 2.76 %).
3.6. In vivo absorption studies
The pharmacokinetic parameters of celecoxib following oral administration of single doses (30 mg/kg) of aqueous suspensions of (i) formula F10 and (ii) celecoxib powder, in a fasted rat model, are shown in . The aim of this study was to (i) investigate the in vivo success of the double-coat microparticles to provide a site-specific controlled drug delivery to the terminal ileocecal region and (ii) estimate the relative bioavailability percentage.
Table 4. Pharmacokinetic parameters of celecoxib following oral administration of aqueous suspensions of the best achieved microparticles (Formula F10) and celecoxib powder to rats (mean ± SD, n = 6).
The drug plasma concentration - time profiles of both treatments are depicted in . It is clear that remarkable differences between the two treatments were found. The peak plasma concentration (Cmax) of both treatments were comparable; (Treatment A, 3.740 ± 0.367 µg/mL and Treatment B, 3.405 ± 0.560 µg/mL). Statistical analysis of Cmax values revealed a non significant difference (P > 0.05) suggesting that the aqueous suspension of double-coat microparticles provides a comparable peak plasma concentrations to the aqueous celecoxib suspension.
Figure 9. Plasma concentration–time profiles of celecoxib following oral administration of aqueous suspensions of the best achieved microparticles (F10) and celecoxib powder to fasted rats (mean ± SD, n = 6).
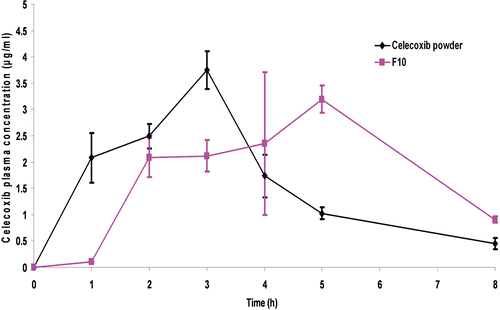
The extremely lower drug-plasma concentration of formula F10, one hour post dosing, might indicate minimum drug absorption at the upper parts of GIT. On the other hand, the increasing drug-plasma concentrations of the same formula, from the second to the fifth hour post dosing, might indicate a site-specific controlled drug delivery to the lower parts of GIT. The estimation of certain pharmacokinetic parameters like, MRT(0-∞), Tmax and t50% elimination, for the two treatments could provide strong evidences to the above assumptions. It was found that the MRT(0-∞) was prolonged from 4.106 ± 0.802 h to 6.797 ± 1.604 h, respectively, the median Tmax was delayed from 3 h to 5 h, respectively and the t50% elimination of the drug was prolonged from 2.209 ± 0.785 h to 4.023 ± 1.810 h, respectively. Statistical analysis, at P < 0.01, revealed significant differences between the two treatments for the above parameters.
The relative bioavailability, judged from the AUC(0-∞), was 134.84%. The enhanced bioavailability of the designed double-coat microparticles, relative to the aqueous suspension of celecoxib powder, could be attributed to the prolonged drug input into the main absorption sites in a manner that do not exceed their absorption ability (CitationHu et al., 2006).
Conclusions
PCL-single-coat celecoxib-loaded microparticles were successfully prepared using an o/o emulsification solvent-evaporation technique. Direct correlations were observed between both the drug: PCL ratio and the Span® 80 concentration in the external phase and (i) particle size, (ii) EE% and (iii) Q2h and Q4h. The PCL M.wt. had positive influences on particle size and EE% and negative impacts on Q2h and Q4h.
Eudragit® S100-coated poly ϵ-caprolactone microparticles were successfully prepared using a solvent-diffusion technique. They showed satisfactory drug protection, upto pH 6.8, evidenced by significant (P < 0.01) reduction of Q2h and Q4h. Following oral administration in rats, they enhanced the bioavailability and extended the duration of drug-plasma concentration relative to an aqueous celecoxib suspension.
Declaration of interest
The authors report no declarations of interest.
References
- Abdallah M, Yuichi T, Hirofumi T. (2009). pH-Sensitive nanospheres for colon-specific drug delivery in experimentally induced colitis rat model. Eur J Pharm Biopharm, 72, 1–8.
- Abdelbary GA, Tadros MI. (2008). Design and in vitro/in vivo evaluation of novel nicorandil extended release matrix tablets based on hydrophilic interpolymer complexes and a hydrophobic waxy polymer. Eur J Pharm Biopharm, 69, 1019–28.
- Ali J, Tyagi P, Ahuja A, Baboota S, Hasan S. (2007). Development and evaluation of a gastroretentive drug delivery system for the low-absorption-window drug celecoxib. PDA J Pharm Sci Technol, 61(2), 88–96.
- Ardizzone S, Bianchi Porro G. (1998). A practical guide to the management of distal ulcerative colitis. Drugs, 55, 519–42.
- Ashford M, Fell JT, Attwood D, Woodhead PJ. (1993). An in vitro investigation into the suitability of pH-dependent polymers for colonic targeting. Int J Pharm, 91, 241–45.
- Barbato F, Rotonda MI, Maglio G, Palumo R, Quaglia F. (2001). Biodegradable microspheres of a novel segmented polyether-ester-amides based on poly-ϵ-caprolactone for the delivery of bioactive compounds. Biomaterials, 22, 1371–78.
- Campieri M, Ferguson A, Doe W, Persson T, Nilsson LG. (1997). Oral budesonide is as effective as oral prednisolone in active Crohn’s disease. The Global Budesonide Study Group. Gut, 41, 209–14.
- Castellanos IJ, Carrasquillo KG, de Jesus Lopez J, Alvarez M, Griebenow K. (2001). Encapsulation of bovine serum albumin in poly(lactide-co-glycolide) microspheres by the solid-in-oil-in-water technique. J Pharm Pharmacol, 53, 167–78.
- Cheng SY, Yuen MC, Lam PL, Gambari R, Wong RS, Cheng GY, Lai PB, Tong SW, Chan KW, Lau FY, Kok SH, Lam KH, Chui CH. (2010). Synthesis, characterization and preliminary analysis of in vivo biological activity of chitosan/celecoxib microcapsules. Bioorg Med Chem Lett, 20(14), 4147–4151.
- Chourasia MK, Jain SK. (2003). Pharmaceutical approaches to colon targeted drug delivery systems. J Pharm Sci, 6(1), 33–66.
- de Heer P, Sandel MH, Guertens G, de Boeck G, Koudijs MM, Nagelkerke JF, Junggeburt JM, de Bruijn EA, van de Velde CJ, Kuppen PJ. (2008). Celecoxib inhibits growth of tumors in a syngeneic rat liver metastases model for colorectal cancer. Cancer Chemother Pharmacol, 62(5), 811–19.
- Fu X, Ping Q, Gao Y. (2005). Effects of formulation factors on encapsulation efficiency and release behavior in vitro of huperzine A-PLGA microspheres. J Microencapsul, 22, 705–14.
- Higuchi T. (1963). Mechanism of sustained action medication. J Pharm Sci, 52, 1145–49.
- Homar M, Ubrich N, El Ghazouani F, Kristl J, Kerc J, Maincent P. (2007). Influence of polymers on the bioavailability of microencapsulated celecoxib. J Microencapsul, 24(7), 621–633.
- Hu LD, Liu Y, Tang X, Zhang Q. (2006). Preparation and in vitro/in vivo evaluation of sustained-release metformin hydrochloride pellets. Eur J Pharm Biopharm, 64, 185–92.
- Imaly JA, Linn S. (1988). DNA damage and oxygen radical toxicity. Science, 240, 1302–9.
- Kondo H, Sharma RK, Mishra AK, Chuttani K, Murthy RR. (2005). Albumin microspheres as carriers for the antiarthritic drug celecoxib. AAPS PharmSciTech, 6 (1), E65–73.
- Kondo N, Iwao T, Hirai K, Fukuda M, Yamanouchi K, Yokoyama K, Miyaji M, Ishihara Y, Kon K, Ogawa Y, Mayumi T. (1994). Improved oral absorption of enteric coprecipitates of a poorly soluble drug. J Pharm Sci, 4(83), 566–70.
- Korsmeyer RW, Peppas NA. (1981). Effect of the morphology of hydrophilic polymeric matrices on the diffusion and release of water soluble drugs. J Membr Sci, (9), 211–27.
- Krishnamachari Y, Madan P, Lin S. (2007). Development of pH- and time dependent oral microparticles to optimize budesonide delivery to ileum and colon. Int J Pharm, 348, 238–47.
- Lamprecht A, Schafer U, Lehr CM. (2001). Size-dependent bioadhesion of micro- and nanoparticulate carriers to the inflamed colonic mucosa. Pharm Res, 18, 788–93.
- Mahadevan U, Loftus EV Jr, Tremaine WJ, Sandborn WJ. (2002). Safety of selective cyclooxygenase-2 inhibitors in inflammatory bowel disease. Am J Gastroenterol, 97(4), 910–14.
- Meissner Y, Pellequer Y, Lamprecht A. (2006). Nanoparticles in inflammatory bowel disease: particle targeting versus pH-sensitive delivery. Int J Pharm, 316, 138–43.
- Nakase H, Okazaki K, Tabata Y, Uose S, Ohana M, Uchida K, Matsushima Y, Kawanami C, Oshima C, Ikada Y, Chiba T. (2000). Development of an oral drug delivery system targeting immune-regulating cells in experimental inflammatory bowel disease: a new therapeutic strategy. J Pharmacol Exp Ther, 292, 15–21.
- Niederberger E, Tegeder I, Vetter G, Schmidtko A, Schmidt H, Euchenhofer C, Bräutigam L, Grösch S, Geisslinger G. (2001). Celecoxib loses its anti-inflammatory efficacy at high doses through activation of NF-κB. The FASEB J, 15, 1622–24.
- Paulson SK, Vaughn MB, Jessen SM, Lawal Y, Gresk CJ, Yan B, Maziasz TJ, Cook CS, Karim A. (2001). Pharmacokinetics of celecoxib after oral administration in dogs and humans: effect of food and site of absorption. J Pharmacol Exp Ther, 297 (2), 638–645.
- Passerini N, Perissutti B, Albertini B, Voinovich D, Moneghini M, Rodriguez L. (2003). Controlled release of verapamil hydrochloride from waxy microparticles prepared by spray congealing. J Control Release, 88(2), 263–275.
- Raffin RP, Colomé LM, Guterres SS, Pohlmann AR. (2007). Enteric Controlled-Release Pantoprazole-Loaded Microparticles Prepared by Using Eudragit S100 and Poly(ε-caprolactone) Blend. Pharm Dev Technology, 12(5), 463–71.
- Rodriguez M, Vila-Jato JL, Torres D. (1998). Design of new multiparticulate system for potential site specific and controlled drug delivery to the colonic region. J Control Rel, 55, 67–77.
- Simmonds NJ, Rampton DS. (1994). Inflammatory bowel disease: a radical view. Gut, 34, 861–5.
- Sinha VR, Bhinge JR, Kumria R, Kumar M. (2006). Development of pulsatile systems for targeted drug delivery of celecoxib for prophylaxis of colorectal cancer. Drug Deliv, 13(3), 221–5.
- Sinha VR, Bansal K, Kaushik R, Kumria R, Trehan A. (2004). Poly-ϵ-caprolactone microspheres and nanospheres: an overview. Int J Pharm, 278, 1–23.
- Tan A, Simovic S, Davey AK, Rades T, Prestidge CA. (2009). Silica-lipid hybrid (SLH) microcapsules: A novel oral delivery system for poorly soluble drugs. J Control Rel, 134, 62–70.
- Thakkar H, Sharma RK, Mishra AK, Chuttani K, Murthy RR. (2005). Albumin microspheres as carriers for the antiarthritic drug celecoxib. AAPS PharmSciTech, 20;6(1), E65–73.
- Thakkar H, Sharma RK, Mishra AK, Chuttani K, Murthy RS. (2004). Celecoxib incorporated chitosan microspheres: in vitro and in vivo evaluation. J Drug Target, 12(9-10), 549–557.
- Yehia SA, Elshafeey AH, Sayed I, Shehata AH. (2009). Optimization of budesonide compression-coated tablets for colonic delivery. AAPS PharmSciTech, 10(1), 147–57.
- Zvonar A, Kristl J, Kerc J, Grabnar PA.(2009). High celecoxib-loaded nanoparticles prepared by a vibrating nozzle device. J Microencapsul, 26(8), 748–759.