Abstract
The aim of this study was to develop a pectin-based colon-specific multiparticulate delivery system. Aceclofenac was used as a model drug owing to its potential therapeutic efficacy in rheumatoid arthritis. Pectin microspheres were prepared using emulsion dehydration technique. These microspheres were coated with Eudragit S-100 using solvent evaporation method. The effect of different variables (polymer, emulsifier, stirring speed and stirring time) was investigated in terms of size, surface morphology, entrapment efficiency, in vitro release and in vivo studies. The size of uncoated microspheres ranged from 30 to 55 µm and exhibited 5–40% of drug release in the upper gastrointestinal tract; however, continuous high release of drug was observed at colonic pH. In addition, the release of drug from the microspheres was found to be higher in the presence of rat cecal contents with maximum release at the 8th hour. This is one of the prerequisites for the effective treatment of rheumatoid arthritis, indicating the effect of colonic enzymes on the pectin microspheres. In vivo studies suggest the maintenance of therapeutic concentration of drug for 24 h with significant anti-inflammatory effect. Therefore, these findings clearly suggest that the Eudragit-coated pectin microspheres offer an exciting mode of aceclofenac delivery to colon in the chronopharmacological treatment of rheumatoid arthritis.
Introduction
In recent years, there is an increasing interest in specific delivery of drugs to the colon via the oral route, because of the advantage in treating colon-specific diseases such as Crohn’s disease and ulcerative colitis (Paharia et al., Citation2007; Vaidya et al., Citation2009). Besides, poorly absorbed drugs have shown improved bioavailability in the colon due to the long residence time (Edwards, Citation1997). Moreover, colon has a less hostile environment with less diversity and intensity of activity than the stomach and small intestine (Gaikwad et al., Citation2010). Multiple-unit systems have been shown to spread out upon entry to the colon and this may give improvements in drug absorption and local treatment. In this regard, multiple-unit systems may empty from the stomach and traverse the ileocecal junction in a more reproducible manner than single units (Edwards, Citation1997). The utilization of enzymes residing in the colon is a means of obtaining site-specific delivery to this region. Dosage forms either prepared from (Rubinstein & Radai, Citation1995) or coated with selected polysaccharides (Milojevic et al., Citation1996) can be utilized to achieve this aim.
Many natural polysaccharides, such as chitosan (Shimono et al., Citation2002), guargum (Krishnaiah et al., Citation1998, Citation2003; Tugcu-Demiroz et al., 2004), amylase (Basit et al., Citation2004; McConnell et al., Citation2007), pectin (Wakerly et al., Citation1996a,Citationb; Macleod et al., Citation1999; Semde et al., 2000; El-Gibaly, Citation2002; Marianne et al., Citation2003; Ahmed, Citation2005; Xu et al., Citation2005; Chambin et al., Citation2006; He et al., Citation2007) have been investigated for their ability to target colon-specific drug delivery. Perhaps, pectin is one of the most extensively investigated polysaccharides in colon-specific drug delivery (Wakerly et al., Citation1996a; Ahrabi et al., Citation2000; Ahmed, Citation2005; Xi et al., Citation2005; Xu et al., Citation2005; He et al., Citation2007). Extensive research is being carried out to exploit pectin as a drug carrier to attain the desirable drug release profile (Queen et al., Citation2000). Many studies have shown that pectin has a potential value in delivering the therapeutics to the colon (Ashford et al., Citation1993; Liu et al., Citation2003). However, pectin is soluble in gastric pH, which retards its utility as a targeting carrier. To address this problem, various approaches have been investigated to create an effective pectin-based drug delivery system. Of all, the combination of pectin with enteric polymers such as film-coating materials appears especially promising (Liu et al., Citation2003). Protection of the drug in the upper gastrointestinal tract (GIT) while allowing enzymatic breakdown and drug release in the colon (Wakerly et al., Citation1996a; Ahmed, Citation2005; He et al., Citation2007) has been obtained by the combination of Eudragit and pectin.
The use of microsphere-based therapy allows drug release to be carefully tailored to the specific treatment site through the various drug–polymer combinations. Microsphere-based systems may increase the life span of active constituents and control the release of bioactive agents. Being small in size, microspheres have large surface to volume ratios and can be used for controlled release of soluble/insoluble drugs. Aceclofenac, a nonsteroidal anti-inflammatory drug used in the treatment of rheumatoid arthritis (Rang et al., Citation2001) has been selected as a model drug. In the recent past, the concept of chronopharmacology has been associated with drug delivery system in the treatment of circadian rhythm diseases such as asthma, hypertension, acidity and arthritis (Botti & Yoan, 2004). In certain diseases, for example in rheumatoid arthritis, constant plasma drug level is not required; however, a pulsatile or controlled release at specific time point would be more effective. To achieve the release of drug when it needed most, various approaches have been employed (Bodmeier et al., Citation1999; Hao et al., Citation2007). However, the multiparticulate drug delivery system has been more advantageous than single unit dosage form by avoiding all or none emptying from the stomach during migrating motor complex (Pillay & Fassihi, Citation1999; Arora et al., Citation2005).
Therefore, taking all these facts into consideration, the main aim of this work was to: (a) investigate the potential of pectin microspheres as an oral colon-specific drug carrier and more importantly and (b) establish the pectin as a suitable chronopharmacological polymer. The proposed multiparticulate system combines the pH-sensitive property of enteric polymer as well as enzymatic biodegradability of pectin in the colon. The design consists of Eudragit S-100 coated pectin microspheres for the colon-targeted delivery of aceclofenac in the treatment of rheumatoid arthritis. The coating of Eudragit S-100 protects the pectin microspheres in the acidic environment of GIT and releases drug at the colonic site.
Materials and methods
Aceclofenac was a kind gift from Mano Pharmaceuticals, Chennai, India. Pectin was purchased from Indian Research Products, Chennai, India. Eudragit R and S 100 were purchased from Colorcon Asia, Mumbai, India. All other chemicals were of reagent grade and used without further purification.
Step I
Preparation of pectin microspheres by emulsion dehydration technique
The pectin microspheres of aceclofenac were prepared by emulsion dehydration method. The weighed quantity of pectin was dissolved in 20 ml of distilled water and then drug was added to it and stirred overnight to solubilize completely. The resulted polymer suspension was poured into 50 ml of isooctane containing 2% (w/v) span-85 and stirred at 1200 rpm for 1 h at 50 °C to obtain a stable water in oil (w/o) emulsion. The emulsion was rapidly cooled to 15 °C followed by the addition of 50 ml of acetone in order to dehydrate the pectin droplets. This system was maintained under mechanical stirring at 25 °C for 30 min to allow the complete solvent evaporation under fume hood. The obtained microspheres were freeze dried overnight and kept in an air tight container for further studies (Paharia et al., Citation2007).
Various formulation and process variables that could affect the preparation and properties of the microspheres were optimized to get small, discrete, smooth surfaced and spherical microspheres. The compositions of the various formulations are presented in . The underlined values were constant for all the formulations studied with other variables. The temperature of the system was maintained at 50 °C.
Table 1. Effect of different variables on particle size, swelling index and entrapment efficiency.
Step II
In this step, an enteric polymeric coating was given to the optimized batch of the formulations. This was accomplished by solvent evaporation method, wherein pectin microsphere (100 mg) was dispersed in 5 ml of an organic solvent (acetone:ethanol; 2:1) in which Eudragit S-100, 1000 mg was previously dissolved. Various core/coat ratios were investigated (1:2, 1:4, 1:6, 1:8, 1:10), while 1:10 core/coat ratio has showed uniform coating and thus the latter coating ratio has been selected. This organic phase mixture was then poured into 70 ml of liquid paraffin containing span-85. The system was maintained under agitation (1000 rpm) at room temperature for 3 h to allow the evaporation of the solvent. Finally, the microspheres were collected, rinsed with n-hexane and freeze dried at −30 °C for 24 h (Sinha et al., Citation2004a,Citationb).
FT-IR and DSC analysis
FT-IR of aceclofenac, pectin and drug-loaded pectin microspheres were recorded at room temperature in KBr pellets by applying 6000 kg/cm2 pressure on Bomen MB-II FT-IR spectrometer (Hartmann & Brawn Co, USA) between the ranges of 400 and 4000 cm−1. DSC thermograms were recorded on a scanning calorimeter equipped with a thermal analysis data system (Perkin-Elmer DSC-7, Waltham, MA). The thermograms were obtained at a heating rate of 10 °C/min over the temperature range of 60–200 °C.
Particle size and surface morphology
Microspheres were characterized using a Malvern Mastersizer S (Malvern Instruments Ltd, Worcestershire, UK). The morphology, surface appearance of both uncoated microspheres and Eudragit S-100 coated microspheres were examined by scanning electron microscopy (SEM, JSM-6400, Tokyo, Japan). The particles were freeze dried, coated with gold palladium to achieve a film of 20 nm thickness (Sputter coater, Balzers SCD 004, Liechtenstein) under high vacuum (100 mTorr) and high voltage (1.2 kV and 50 mA). The samples were then imaged using a 15 kV electron beam.
UV–Vis determination of aceclofenac
A simple and precise UV spectrophotometric method was used for the quantification of aceclofenac in microsphere dosage forms. The method was based on the measurement of absorbance at a wavelength of 274 nm in phosphate buffered saline (PBS; pH 7.4). Weighed amount of aceclofenac was dissolved in PBS to obtain a 100 µg/ml solution. This solution was subjected to scanning between 200 and 400 nm and absorption maximum (274 nm) was determined. The validation parameters were found to be as follows: molar absorptivity (9.168 × 10³ l/mol/cm), linearity range (5–40 µg/ml), correlation coefficient (R2 = 0.9995), intercept (−0.00132), slope (0.02548), regression equation (y = 0.02548x − 0.00132), LOD (0.07 µg/ml) and LOQ (0.22 µg/ml).
Drug loading and encapsulation efficiency
Loading capacity is the maximum amount of aceclofenac found in 100 mg of microspheres. The drug loaded in microspheres was estimated using the formula, L = Qm/Wm × 100, where L is the percentage of loaded microspheres, Wm the weight of the microspheres; Qm the quantity of the drug present in Wm of microspheres; whereas encapsulation efficiency was calculated in terms of the ratio of drug in the final formulation to the amount of added drug. The amount of drug encapsulation in the microspheres was determined using the formula, E = Qp/Qt × 100, where E is the percentage of encapsulation of microspheres amd Qp the product of drug content per gram of microspheres and yield of microspheres in gram.
Equilibrium swelling studies of microspheres
A preweighed amount (100 mg) of microspheres was placed in simulated colonic fluid (SCF; Jain et al., 2004) and allowed to swell up to a constant weight. The microspheres were removed and blotted with filter paper and their changes in weight were measured.
Preparation of 4% (w/v) rat cecal contents
Male albino rats weighing 115–150 g were maintained on a normal diet and used for the study. The rats were asphyxiated using carbon dioxide and the abdomens were opened and cecum was traced. The cecal bags were opened and the contents were individually weighed, pooled and then suspended in PBS to provide a 4% (w/v) dilution. As the cecum is naturally anaerobic, all these operations were carried out under CO2. The rats were cared in accordance with institutional guidelines for animal studies.
In vitro drug release study in simulated gastric fluid, simulated intestinal fluid and SCF
In vitro drug release studies were studied using USP rotating paddle dissolution apparatus maintained at 100 rpm and 37 °C. Initially, the pH of the dissolution medium was maintained at pH 1.2 with simulated gastric fluid (SGF; USP, Citation2008) for 2 h followed by pH 7.0 for 6 h with simulated intestinal fluid (USP, Citation2008). It was then replaced with SCF (pH 7.4) containing 4% (w/v) rat cecal materials; the experiment was carried out with a continuous CO2 supply into the dissolution medium. The supernatant was filtered through Whatman filter paper and the absorbance was taken at 275 nm (Momin & Pundarikakshudu, 2004; Patel et al., Citation2007). Data obtained from dissolution studies were fitted to various kinetic equations. The kinetic models used were a zero order, first order, Higuchi's equation and Korsmeyer–Peppas equation (Masuda Khatun et al., 2005; Mehrgan & Mortazavi, 2005).
Stability studies
To assess the long-term stability, the Eudragit-coated pectin microsphere formulations were put in hard gelatin capsules and sealed in aluminum packaging coated inside with polyethylene. The studies were performed at 40 °C/75% relative humidity (RH) in the stability chamber (Stability Oven, Nirmal Instruments, Delhi, India) for 3 months and observed for any change in color, odor, percentage drug content, entrapment efficiency, size, shape, surface morphology and in vitro drug release.
Pharmacodynamics study – anti-inflammatory activity
Male albino rats (Wistar strain) weighing between 150 and 175 g were selected for anti-inflammatory studies (Winter et al., Citation1962). The experiments were performed in accordance with the guidelines established by the European community for the care and use of laboratory animals and approved by the Institutional Animal Ethics Committee as per CPCSEA guidelines (290/CPCSEA/20/12/2006) and the studies were carried out at Madras Medical College, Chennai, India.
Carrageenin-induced rat hind paw edema was produced by making an injection of 0.1 ml of 1% carrageenin (Sigma Chemical Co, St. Louis, CA) suspension into the right hind paw of each rat in the plantar region. The paw volume was measured at 0 and 3 h after injection of carrageenin. The plethysmograph apparatus were used for the measurement of rat paw volume (Godefroy et al., Citation1992).
Experimental induction of arthritis
Rats were divided into four groups with each group containing six rats. The treatment schedules of animals belonging to the different groups are shown below.
Group I: Normal (normal saline 2 ml/kg).
Group II: Complete Freund’s adjuvant (0.1 ml).
Group III: Standard aceclofenac (10 mg/kg).
Group IV: Eudragit-coated pectin micospheres (10 mg/kg).
On day “0”, arthritis was induced in animals belonging to Groups II–IV by injecting 0.1 ml of complete Freund’s adjuvant (Sigma Chemical Co) below the plantar aponeurosis of the right foot paw of the rats. Next day, the test drug was administered to the animals at the dose of 10 mg/kg for up to 15 d. The paw volume was measured using plethysmograph apparatus at days 5, 10 and 15. At the end of the experimental period, the animals were fasted overnight and then killed by cervical decapitation. Blood was collected and serum separated out. The liver was immediately removed and suspended in ice-cold saline for antioxidant studies. The serum was analyzed for the following biochemical parameters: serum aspartate transaminase (AST), alanine aminotransferase (ALT), alkaline phosphatase (ALP), cholesterol and triglyceride. A 10% homogenate of the tissue was used for the assay of lipid peroxidation (LPO), superoxide dismutase (SOD), catalase (CAT) and glutathione peroxidase (GPx; Wei Jia et al., 2003).
Determination of pharmacokinetic parameters
A total of 18 young, male rats weighing between 150 and 200 gm were divided into three groups and fasted for 12 h before dosing. On the day of experiment, animals were orally dosed at 2 mg/kg of aceclofenac reference standard. The blood samples were collected from femoral artery periodically at 0.25, 0.5, 1, 2, 3, 4, 6, 8, 10, 12, 24 h into the sterile heparinized EP tubes. Plasma samples were obtained following centrifugation of blood at 1500 × for 10 min at 4 °C and kept frozen until analyzed by high performance liquid chromatography (HPLC). The parameters such as area under the curve (AUC), Cmax, Tmax, volume of distribution and half lives were evaluated using the software “kinetica”.
Chromatographic conditions
A simple HPLC method has been validated and used for the determination of aceclofenac in serum. HPLC (Shimadzu LC-20AT, Columbia, MD) method was used with the column (Phenomenex Luna C18, Torrance, CA; 5 µm, 250 × 4.6 mm2 i.d.) and a Rheodyne model 7125 injector valve with 20 μL sample loop. The separation was carried out using a mobile phase consisting of phosphate buffer of pH 7.4, acetonitrile and methanol in the ratio of 40:40:20. Flow rate employed was 1.2 ml/min. Each solution was injected and a chromatogram was recorded. The retention times of aceclofenac was found to be 3.035 min. The method was validated for selectivity, linearity, accuracy and precision as per the ICH guidelines. The validation parameters were found to be as follows: linearity range (80–240 µg/ml), slope (0.1401), correlation coefficient (R2 = 0.9991), regression equation (y = 0.1401x + 128.87), theoretical plate/meter (29 784), resolution factor (1.32), tailing factor (1.0), LOD (0.35 µg/ml), LOQ (1.46 µg/ml), precision (%RSD = 0.31) and recovery(99.18%).
Organ distribution study
Male albino rats were divided into three groups of six rats each. The first group served as control and received no drug. The second group received 2 mg uncoated pectin microspheres and the third group were given Eudragit-coated pectin microspheres (E-APM16) containing equivalent amount of drug. The test formulations were orally administered in suspension form followed by sufficient volume of drinking water. After 2, 4, 6 and 8 h, the rats were humanly killed and stomach, small intestine, and colon were isolated. These organs were homogenized along with PBS (pH 7.4). The drug contents were determined by HPLC method (Paharia et al., Citation2007).
Results and discussion
The present study focused on the influence of different variables namely, polymer concentration, emulsifier concentration, stirring speed and stirring time on optimizing the microspheres for colon-specific delivery of the drug. In this study, aceclofenac was used as a model drug and pectin was selected as a chronopharmacological polymer to formulate a multiparticulate delivery system for the sustained release of aceclofenac in the colon. The pectin has been selected in this work due to its proven ability in controlled drug delivery in colon and also due to the fact that it can be degraded in the colon by colonic enzymes (Jain et al., Citation2008; Vaidya et al., 2009; Das et al., 2011). Pectin microspheres were prepared by emulsion dehydration method and then coated with Eudragit S-100 using solvent evaporation method.
Preformulation studies
DSC studies
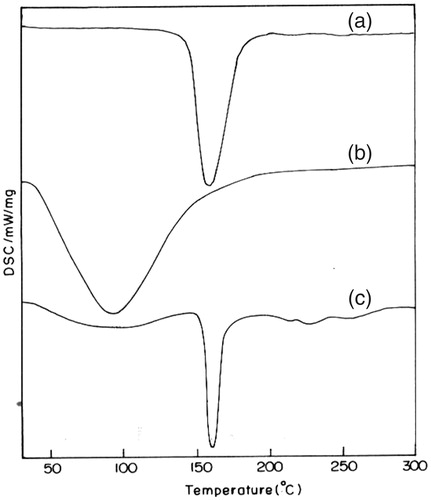
The thermal curves of pure aceclofenac, pectin and drug-loaded pectin microspheres are presented in . The thermal curve of aceclofenac exhibited a profile typical of a pure, crystalline, anhydrous drug, with a sharp endothermic peak (T peak = 158.3 °C) due to its melting process. The thermal profile of pectin revealed a melting phenomenon at around 80–100 °C, that is endothermic peak at 91.5 °C (Nurjaya & Wong, Citation2005). While aceclofenac melting peak is still visible at 160 °C in the thermogram of drug-loaded microspheres, although strongly reduced in intensity, indicating a marked decrease in drug crystallinity. From these findings, it can be learned that no interactions between aceclofenac and pectin occurred during the preparation of microspheres.
Figure 1. DSC of: (a) aceclofenac; (b) pectin; and (c) aceclofenac-loaded pectin microspheres.
FT-IR studies
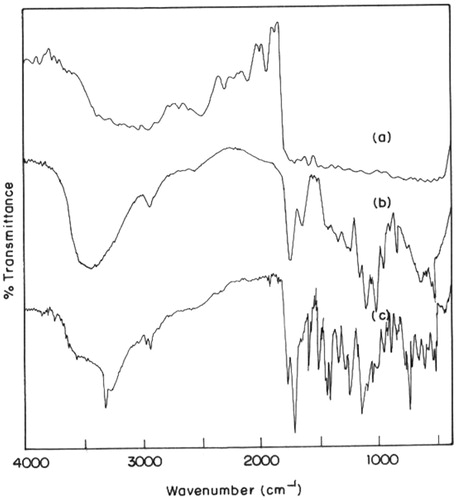
FT-IR spectral data are used to confirm the chemical stability of aceclofenac after the preparation of microspheres. The FT-IR of aceclofenac showed a intense band at 1771.47, 1716.89, 1589.53 and 1055.9 cm−1 corresponding to the functional groups C=O, COOH, NH and OH bending. While the pectin showed a broad band between 3800 and 3250 cm−1, due to OH stretching, a C=O vibration band of COOH groups at 1732 cm−1 and the asymmetric vibration stretching of COO¯ at 1630 cm−1. The peaks observed in FT-IR of drug-loaded microspheres were almost unchanged and observed at 1771.62, 1716.76, 1589.84 and 1055.18 cm−1, respectively. Hence, all the peaks observed in the plain aceclofenac were noted in the drug-loaded pectin microspheres, indicating no interaction of aceclofenac with the polymeric matrix. The FT-IR graphs of pure aceclofenac, pectin and drug-loaded pectin microspheres are shown in .
Figure 2. FT-IR of: (a) aceclofenac; (b) pectin; and (c) aceclofenac-loaded pectin microspheres.
Mean particle size and entrapment efficiency
It was observed that, as the concentration of drug to pectin ratio was increased from 1:3 to 1:6, the size of microspheres was also increased from 29.05 ± 0.72 (APM1) to 38.85 ± 0.36 µm (APM4). The increase in microsphere size could be explained on the basis of the viscosity (Rodriguez et al., Citation1998) of dispersing media which was increased due to higher concentration of the pectin and caused larger droplets in the emulsion resulting in increased size. In the pectin microspheres, drug:pectin concentration (1:3) was found to be optimal insuring the smaller size of microspheres (29.05 ± 0.72 µm). At concentrations lower than the optimum, the solution become less viscous and dispersed into fine droplets that easily coalesced resulting in larger microspheres, whereas at higher concentrations of the polymer, the solution dispersed into large droplets. It was further noted that, the entrapment efficiency too significantly (p < 0.05) increased from 79.1 ± 0.39% (APM1) to 84.58 ± 1.56% (APM4) for 1:3 to 1:6. It is known that the entrapment efficiency of microspheres fabricated using an o/w emulsion solvent evaporation technique is dependent on the diffusion of the drug to the external phase during emulsification (Fu et al., Citation2005). Thus, it was understood that high viscosity of the pectin polymer may have restricted drug diffusion to the external phase during the formation of microspheres resulting in higher entrapment efficiency as the polymer concentration increased. In this study, even though a statistically significant difference in entrapment efficiency was observed between the microspheres prepared using the lowest and highest concentration of polymers, the difference was not as large as that observed in a study conducted by Gabor et al. (2005). Again, this could be attributed to the relatively small polymer concentration used in this study compared to the higher polymer concentration (40% w/v) used in the study reported by Gabor et al. (1999).
Further, upon increasing the concentration of the emulsifier (Span-85) from 0.5 (APM5) to 2.0% (APM8), the particle size of the microspheres significantly (p < 0.05) decreased from 57.48 ± 0.35 to 31.32 ± 0.21 µm. The percent drug entrapment efficiency increased from 70.68 ± 0.49% to 84.58 ± 1.49%, which may be due to the reduction in interfacial tension between dispersed droplets of pectin and oil, which in turn causes reduction in droplet size and results in decreased microsphere size (Castellanos et al., Citation2001). Microspheres fabricated using 0.5% (w/v) span-85, had the largest particle size and the lowest entrapment efficiency while those fabricated with 2% span-85 showed the lowest particle size and the highest entrapment efficiency. When added in a small concentration (0.5%), the surfactant may not have been able to cover the entire organic droplet surface. Thus, some of the droplets would tend to aggregate till the surface area was decreased to such a point that the available amount of emulsifier was able to coat the entire surface of the agglomerate and form a stable emulsion resulting in a larger microsphere size. This could also explain the smaller droplet size at higher surfactant concentration resulting in a greater surface area for rapid solvent evaporation and rapid hardening of microspheres, and further decreased drug diffusion to the external phase and thus higher entrapment efficiency at higher surfactant concentrations.
Further the effects of stirring speed and stirring time on the particle size and entrapment efficiency were investigated. Yang et al. (Citation2003) found that the increased mechanical shear force, produced by increasing the stirring speed, divided the suspension of drug and polymer into small droplets rapidly. In our study, the stirring speed applied between 500 and 1500 rpm caused fibrous aggregates. However, the microspheres prepared with 2000 rpm had smaller particle size and homogenous size distribution. In this respect, 2000 rpm was selected as the optimum stirring speed. In addition, the stirring time too had significant effect on the formation of microspheres. It was learned that the solidification of microspheres was not complete and enough in 30 min of stirring and thus 1 h of stirring was found to be appropriate for the preparation. In this respect, the optimum stirring time was selected as 1 h.
Drug-loading percentage
The drug loading decreased from 21.14 ± 0.26% (APM1) to 11.3 ± 0.45% (APM4), i.e. the drug loading decreased with increasing concentration of polymer. Whereas for the increase in emulsifier concentration from 0.5% to 2.0%, the drug loading increased from 17.67 ± 0.12% (APM5) to 21.14 ± 1.78% (APM8). The drug loading percentage also increased for an increase in the rate of stirring from 500 to 2000 rpm and it was 21.75 ± 1.59% for 500 rpm (APM9) and 24.25 ± 2.29% for 2000 rpm (APM12). Further, an increase in time of stirring from 15 min to 1 h also resulted in increase in percentage loading and it was 17.41 ± 0.34% for 15 min (APM13) to 22.65 ± 1.26% for 1 h. The effect of various variables on particle size, entrapment efficiency, percentage of drug loading and swelling ratio (SR) is presented in .
Swelling ratio
Drug release rates are influenced by the equilibrium water-uptake of the microspheres (Ritger & Peppas, Citation1987). The SR increased with the increase in the polymer concentration and rotational speed as evident from . The water-lodging capacity of microspheres is dependent on gelling strength, which in turn depend upon the concentration of pectin hence with the increase in the pectin concentration, the SR also increased. While swellability decreased with the increase in emulsifier concentration and stirring time.
In vitro drug release studies
Polymer concentration, emulsifier concentration, rotational speed and rotational times have got a profound influence on percentage cumulative drug release. Four formulae of pectin microspheres of aceclofenac were prepared using various drug to polymer ratios from 1:3 (APM1) to 1:6 (APM4). The increase in polymer concentration leads to a decrease in the percentage drug release in all dissolution medium. In SGF, the highest percentage release was 5.84 ± 0.63% at 120 min for the batch APM1 formulated with a drug to polymer ratio of 1:3 and it was about 3.66 ± 0.16% for the batch APM4 formulated with a drug to polymer ratio of 1:6, at the end of 120 min. The APM1 batch was optimized by taking account of mean particle size, entrapment efficiency and swelling index. The cumulative percentage drug release (%CDR) in simulated intestinal fluid (SIF) also decreased from 29.45 ± 0.67% (APM1) to 12.49 ± 0.39% (APM4). The %CDR in SCF control for APM1 was 23.71 ± 0.32% and for APM4 it was 12.51 ± 1.13%. The decrease in %CDR from APM1 to APM4 is due to the increase in mean particle size from 29.05 ± 1.72 (APM1) to 38.85 ± 0.36 µm and an increase in swelling index from 0.35 (APM1) to 0.75 (APM4). The percentage CDR in SCF enzyme induced was 83.14 ± 0.11% to 61.12 ± 0.64% for APM1 to APM4 at the end of 8th hour, as shown in , which could be due to the thicker polymer membrane that controls the release rate. The aim of the study was to obtain maximum %CDR at the end of 8th hour to synchronize the chronobiological symptoms of rheumatoid arthritis. From APM1 to APM4, the batch APM1 was selected as an optimized formula. The percentage drug release in SCF enzyme induced for APM1 to APM4 is shown in .
Figure 3. The cumulative percentage drug release in SCF enzyme induced medium (a) APM 1--APM 4, (b) APM 5--APM 8, (c) APM 9--APM 12, (d) APM 13--APM 16.
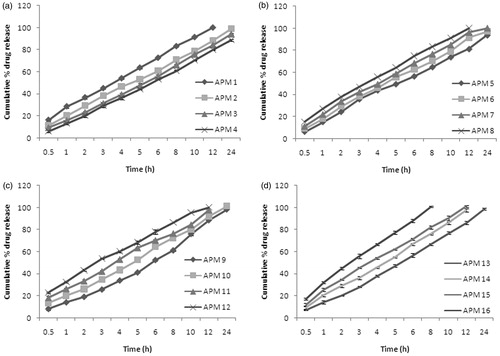
The emulsifier concentration also has an effect on %CDR. The %CDR was increased from 3.26 ± 0.29 (APM5) to 5.48 ± 0.36% (APM8) for increase in concentration from 0.5% to 2.0% w/w of span-85 at the end of 2 h in the SGF. The %CDR increased from 15.82 ± 0.49% (APM5) to 26.34 ± 0.12% (APM8) at the end of 6th hour of the study in SIF. This is due to the decrease in particle size with an increase in emulsifier concentration from APM5 to APM8 (i.e. 57.48 ± 0.35 µm to 31.32 ± 0.20 µm). The %CDR increased from 10.39 ± 0.35% (APM5) to 14.29 ± 0.37% (APM8) at the end of 8th hour of the study in SCF without enzyme induction, whereas it was 64.83 ± 0.66 to 83.3 ± 0.92% for SCF with enzyme induction. This could be attributed to the presence of greater amount of free drug on the surface of the microspheres with increasing the concentration of span-85. The APM8 batch is the optimized batch for optimal emulsifier concentration. The percentage drug release in SCF enzyme induced for APM5 to APM8 is shown in .
APM9 to APM12 were formulated using the optimized drug polymer ratio of 1:3 and an optimized concentration of 2% w/w of span-85. The rotational speed was the varying parameter among the APM9 to APM12 which were formulated at 50 to 2000 rpm. At the end of 120 min, the %CDR was 2.68 ± 0.95 to 4.09 ± 0.32% for APM9 to APM12 in SGF. This may be due to the decrease of particle size from 38.15 ± 0.36 µm (APM9) to 13.05 ± 0.57 µm (APM12). In SIF also, there was an increase in %CDR from 27.02 ± 0.62 (APM9) to 30.31 ± 0.18% (APM12) and in SCF control, the %CDR increased from 25.43 ± 1.88% (APM9) to 58.44 ± 1.44% (APM12) at the end of 24th hour. In SCF (enzyme induced) medium, APM9 and APM10 released 61.19 ± 0.62 and 72.47 ± 0.83% at the end of 8th hour, respectively, as shown in . But the APM11 and APM12 which were made with 1500 and 2000 rpm released about 76.32 ± 0.56 and 86.37 ± 0.65, respectively, at the end of 8th hour. This could be due to the formation of smaller microspheres at higher speed. So, APM12 batch which released 86% at the end of 8th hour and 100% at the end of 12th hour was selected as an optimized batch among APM9 to APM12. The percentage drug release in SCF enzyme induced for APM9 to APM12 is shown in .
The batches APM13 to APM16 were optimized for stirring time. APM13 to APM16 were formulated with a drug to polymer ratio of 1:3 and an optimized concentration of 2.0% span-85 at 1200 rpm at varying time of 15, 30, 45 and 60 min. The increase in time of stirring leads to a decrease in mean particle size, from 55 ± 0.64 µm to 31.32 ± 0.20 µm and thereby increasing the %CDR from APM13 to APM16 in all the dissolution medium used. In SIF, APM13 to APM16 released about 8.26 ± 0.14% to 16.01 ± 0.10% and in SCF-control, the release for APM13 to APM16 was 26.36 ± 2.06 to 33 ± 1.01% at the end of 24 h. In SCF (enzyme induced), it was 66.44 ± 0.48% to 100.72 ± 2.02% at the 8th hour. The microspheric formulation which exhibited 80% in vitro drug release in 8 h was selected for colon-specific drug release and for further in vivo studies. Thus, the APM16 which was formulated using a drug to polymer ratio of 1:3 and 2% w/w of span-85 as an emulsifier, stirred at 2000 rpm for 1 h was selected as the optimized formula and given Eudragit S-100 coating. The percentage drug release in SCF (enzyme induced) for APM13 to APM16 is shown in .
There was a significant (p < 0.05) difference in rate and extent of drug release from formulations with and without rat cecal content. In all case, the cumulative drug release was significantly (p < 0.05) higher in the presence of rat cecal contents than in the control system. From the results, we learned that, this could have been due to the enzymes present in cecum, which are responsible for degradation of pectin, whereby, the drug is released from the microspheres. Similar results have been reported by (Sinha et al., Citation2004a,Citationb). The release of aceclofenac from microspheres was characterized by an initial moderate release, and then followed by slow release, thus avoiding the unwanted toxic effects like bone marrow depression that sometimes leads to withdrawal of drug therapy (Richman et al., Citation1987). The biphasic pattern of drug release is characteristic of matrix diffusion kinetics (Lemoine et al., Citation1998).
The mean in vitro dissolution profiles of acecloenac in simulated GI fluids (SGF and SIF) showed similar patterns and rates of release. Only 0–20% of the drug was released in the upper GIT environment. Thus, polymeric microspheres can prevent the drug from being released in the physiological environment of the stomach and the small intestine. These findings are concordant with the results of Krishnaiah et al. (Citation2002). The release profile of pectin microspheres in all the media clearly indicates that polymer, emulsifier, rotational speed and rotational time significantly affect the release from microspheres. The pectin used in the present study undergoes enzymatic degradation by microbial flora in the colon and thus affect the drug release incorporated in these polymers. Pectin microspheres showed drug release pattern to the extent of 100.7% in the SCF (with enzyme induction) in 8 h, which is the prerequisite for addressing chronopharmacological symptoms in rheumatoid arthritis. A colon-targeted drug delivery system should not only protect its load from being released in the physiological environment of the stomach and the small intestine but also deliver its load to the colon. Hence polymeric coating was given to pectin microspheres to retard the drug release in upper GIT.
Step II
The release rate of drug from all uncoated aceclofenac-loaded pectin microspheres showed considerable drug release at pH 1.2 and 6.8 because pectin is a non-enteric polymer. Hence, it was quite imperative to coat the pectin microspheres with an enteric polymer to retard drug release at lower pH regions of the GIT as well as to optimize the site-specific delivery of drug to the colon. Keeping this in mind, the microspheres were coated with Eudragit S-100 for colon-specific delivery of the drug.
Characterization of Eudragit S-100 coated pectin microspheres of aceclofenac
With regard to in vitro drug release, smaller particle size, high entrapment and high loading efficiency, among the 16 formulae, APM16 was selected as the optimized one for further in vivo studies and hence it was given Eudragit coating. Thus, E-ACM16 was formulated by taking the core/coat ratio of 1:10 by solvent evaporation method described in the section “Materials and methods”. The mean particle size of the Eudragit-coated pectin microspheres was obviously larger than the original cores and found to be 156.2 ± 2.6 µm and the production yield was found to be 82.33%. The percentage of microspheres attached to the everted colon was considered as the mucoadhesion. The result shows that microspheres with a 10:1 coat/core ratio have the good mucoadhesion and was found to be 68.29 ± 2.65%. The greatest bioadhesion seen in E-ACM16 microspheres may be attributed due to the small particle size of these microspheres that causes the greatest contact surface between the mucosal tissue of colon and the microspheres.
SEM analysis
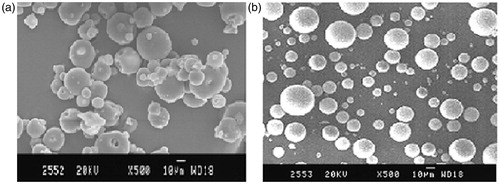
The morphology of the microspheres prepared by emulsion dehydration method was investigated by SEM. The SEM photographs of pH-dependent uncoated microspheres are shown in . It was observed by SEM analysis that the microspheres were finely spherical; free flowing, non-aggregated and multinucleated. shows the SEM image of Eudragit-coated microspheres, where the surface is still spherical, perhaps surface is not so smooth and they are substantially larger than the core particles.
Figure 4. SEM photograph: (a) uncoated and (b) coated microspheres.
Percentage cumulative drug release of Eudragit-coated microspheres
The results of in vitro drug release of multiparticulate system clearly revealed that Eudragit-coated microspheres exhibited slow release, that is, only 5–10% drug releases in 6 h. No drug release was observed in simulated stomach fluid (pH 1.2 in 2 h) and only 4.8 ± 2.13% at the 6th hour due to only swelling and diffusion mechanism in SIF (pH 6.8), while in simulated colonic fluid, it was 17.92 ± 1.34% at 8th hour of the study, this could be due to dissolution of the Eudragit coat at pH 6.8 and on exposure of the pectin microspheres to colonic fluid. Further, the biodegradability of pectin by colonic microflora was assayed by performing the in vitro drug release studies in PBS (pH 7.4) containing rat cecal content (4%). The drug release was found to be improved in the presence of rat cecal content in comparison to those that were carried out without rat cecal content with the microspheres prepared with 1:10 core/coat ratio. This makes more than 70% of drug available at colon with peak concentration around 8–10th hour of the study. This %CDR of E-APM16 in SIF and SCF is shown in . Thus, the initial drug release from uncoated pectin microspheres could be due to the fact that they were not able to maintain their integrity in upper part of GIT, while Eudragit-coated pectin microspheres maintain their integrity in upper GIT hence drug release was slow in comparison to uncoated microspheres (Maestrelli et al., Citation2008).
Figure 5. The %CDR of Eudragit-coated pectin microspheres and Eudragit microspheres alone in SCF.
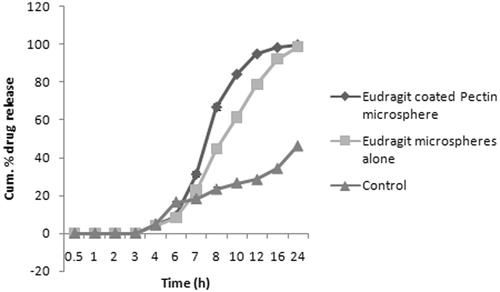
However, in order to find out the effect of Eudragit S-100 alone, we made an attempt to prepare the Eudragit microsphere and investigated its in vitro drug release in PBS. Even if cynical, comparison of two polymers deemed necessary to provide a controlled approach. As expected, literally there is no drug release in the SGF and perhaps the drug started release in the pH 6.8 with 8 ± 1.73% at the end of 6th hour. The drug release although increased in the colonic medium, the 80% of the drug released at the 12th hour comparing to the pectin microsphere where the 80% of the drug released between 8 and 10th hour which is the prerequisite for the chronopharmacological treatment for rheumatoid arthritis. The reason could be pectin is more prone to enzymatic activity than the Eudragit polymer and this contributed to the higher drug release in the former microspheres. The Eudragit on the other hand is more controlled in terms of drug release and this behavior of Eudragit makes it more suitable for the coating of pectin microsphere rather than Eudragit microsphere alone. The later approach is the one which was also followed by Bozdag-Pehlivan et al. (2008).
The goodness-of-fit for various models investigated for E-APM16 ranked in the order of (Zero order > Korsemeyer–Peppas > Higuchi > first order). The kinetic treatment reflected that release data of the optimal batch showed R2 value of 0.9945 and 0.9230 for the zero and first orders, respectively. Likewise, the formulations were observed to yield correlations with Higuchi model, i.e. (R2 = 0.9665). Thus, it was understood to be predominant zero-order release pattern. Further to understand the drug release mechanism, data were fitted into Korsmeyer–Peppas model, where the values of the diffusional exponent n characterizes the drug transport mechanism. The value of n was found to be 1.5308, thus indicate a coupling of diffusion and erosion mechanism indicating that drug release from the microspheres follow a super case II transport.
Stability studies
The protocol conformed to the recommended World Health Organization document for stability testing of products intended for the global market (Food and Drug Administration, Citation1997). After storage, formulation E-ACM16 was observed for physical appearance, particle size, particle shape, drug content and in vitro drug release. Before and after storage at 40 °C/75% RH for 3 months, in vitro release data were analyzed for dissolution efficiency. No significant difference (p ≤ 0.05) was found, and similarity factor f2 and dissimilarity factor f1 (Lorenzo-Lamosa et al., Citation1998) were found to be 97.6 and 0.76, respectively. There was an insignificant change (p > 0.05) in the organoleptic properties, drug content, particle size distribution and shape, indicating that formulation ACM16 was very stable. Stability studies revealed that there was no significant change in the organoleptic properties and drug content. Thus, the formulation was stable at different conditions of temperature and humidity.
Pharmacodynamic studies
The anti-inflammatory and sustaining action of the optimized formulation was evaluated by the carrageenan-induced rat paw edema method (Winter et al., Citation1962) in male Wistar rats. In this study, we investigated the effects of aceclofenac microspheres on paw swelling and activity of hepatic enzymes in adjuvant arthritis rats. Adjuvant arthritis in rat shows several clinical and histological similarities to human rheumatoid arthritis (Hungl & Siebertl, Citation2006). The anti-inflammatory activity of standard or test formulations was evaluated on the basis of its ability to inhibit the edema produced in hind paw of rats after challenging with carrageenan. The difference in paw volume values before and after test formulation administration was calculated and percent inhibition of edema at each time point was calculated and presented in . Edema value of the injected footpad significantly (p < 0.05) increased and reached a peak at 15 d. Administration of standard and test drugs at a dose of 10 mg/kg of body weight, significantly (p < 0.05) inhibited the development of the swelling induced by CFA. The dose of 10 mg/kg exhibited anti-inflammatory activity, which was maintained until the experiment was terminated on day 15. shows the time course of edema and inhibition rate after the administration of CFA and test formulations.
Table 2. Effect of test formulation (E-APM16) on CFA-induced paw edema in rats.
Marker enzymes (AST, ALT and ALP) in serum were elevated significantly (p < 0.05) during carrageenan induced hind paw edema in all arthritis rats when compared to control rats. As a result of arthritis-induced by CFA in Group II, the level of serum enzymes was increased as AST to 74.21 ± 11.56, ALT to 27.18 ± 10.03 and ALP to 96.17 ± 13.08. After test formulation treatment (10 mg/kg), the levels of these enzymes were significantly decreased (p < 0.05). Assessment of the levels of AST, ALT and ALP provides an excellent and simple tool to measure the anti-arthritic activity of the target drug. The activities of aminotransferases and ALP were significantly increased in arthritic rats, since these are good indices of liver and kidney impairment which is also considered a feature of adjuvant arthritis (Rainsford, Citation1982). Serum AST and ALT have been reported to play a vital role in the formation of biologically active chemical mediators such as bradykinins in inflammatory process (Glenn et al., Citation1965). Also, Niino-Nanke et al. (1998) confirmed a positive correlation between the increased activity of serum alkaline phosphatase and the disease activity in RA.
represents the levels of lipid peroxides. Lipid peroxide level was found to be significantly increased (p < 0.05) in arthritis-induced rats when compared to control animals. After drug treatment for 15 d, the level was found to be significantly reduced (p < 0.05) in Group III animals when compared to Group II animals. Whereas the levels of enzymic antioxidants (GPx, SOD and CAT) were found to be significantly decreased (p < 0.05) in Group II animals when compared with Group I animals. The levels were reverted back to near-normal levels in Group III animals when compared with Group II animals.
Table 3. Effect of test formulation (E-APM16) on antioxidant status in liver of control and experimental animals.
An increase in the level of lipid peroxides in tissues reflects membrane damage (Kawamura et al., Citation1992). In rheumatoid arthritis, membrane damage provokes LPO in the membrane and accelerates the disorder in structure and function of these membranes (Yagi, Citation1987). In the present investigation, lipid peroxides were significantly increased in arthritic condition. The increased level of lipid peroxides under arthritic condition might be due to poor antioxidant defense as well as inactivation of antioxidant systems. Results of this present investigation elucidate that the test formulations significantly (p < 0.05) inhibit both inflammation as well as accumulation of lipid peroxides in tissues.
The antioxidant defense enzyme namely, SOD, CAT, protect aerobic cells against O2 toxicity and LPO. SOD may play an important role in protecting cells against reactive oxygen species (ROS; Yamaguchy, Citation1991). CAT is the enzyme which catalyses the disproportion of H2O2. The results show that the activities of SOD and CAT are found to be decreased in arthritic rats which may be due to enormous production of free radicals. GPx is localized in the cytoplasm and mitochondria, which catalyses the degradation of various peroxides by oxidizing glutathione with the formation of its conjugates.
The decreased activity of these enzymes in arthritis may be due to supersaturation of enzyme SOD with a high concentration of ROS formed. This decrease in SOD activity leads to declined production of hydrogen peroxide. Since hydrogen peroxide is the substrate for the enzyme CAT and GPx, these were also found to be decreased. On test formulation treatment, the activities of SOD, CAT and GPx are brought to near normal levels. It reduced the increased production of superoxide radicals, hydroxy radicals and singlet oxygen.
In the present study, we thus conclude that oral administration of test formulations has been shown to modulate the above biochemical changes observed in the adjuvant-induced arthritic animals. The results of this study show the possibility of aceclofenac microspheres formulation can produce significant anti-inflammatory effect.
Pharmacokinetic parameters
The plasma concentration versus time profiles graph is presented in . Following the oral administration of standard and test formulations, aceclofenac was detectable in the plasma after a 0.48 and 8.27 h (Tmax), respectively, which was significantly different and high (p < 0.05) from the of standard. This delayed absorption may be due to the extended release effect of the swellable hydrophilic polymer present in the composition. Also, the observed mean Cmax from the standard (260.12 ± 2.22 ng/ml) was lower than that of the test formulations (281.29 ± 3.56 ng/ml). The values were significantly (p < 0.05) different from each other. The half-life of pure aceclofenac (3.82 ± 2.17) was less which specifies the rapid removal of drug from plasma. The rapid elimination of pure drug was further supported by high elimination rate constant. On the contrary, microsphere (6.01 ± 3.39) exhibited high half-life and low elimination rate constant (0.124 ± 4.21) values indicating that drug remains in the body for longer period of time and exhibits prolonged effect. There was a statistically significant difference (p < 0.05) in the AUC values between the standard (705.13 ± 18.20 ng h/ml) and the pectin microspheres (1645.12 ± 20.45 ng h/ml). The low value of AUC observed with plain aceclofenac may be due to its rapid absorption and elimination from the body; on the contrary, the micospheres showed high AUC values indicating increased bioavailability of drug. The pharmacokinetic parameters of microspheres and standard drug are presented in . All these parameters clearly reveal that the aceclofenac microspheres exhibited prolonged effect of aceclofenac in rats. Thus, the drug delivery system presented here permits the treatment of chronopharmacological symptoms of rheumatoid arthritis.
Figure 6. Plasma drug concentration–time curve.
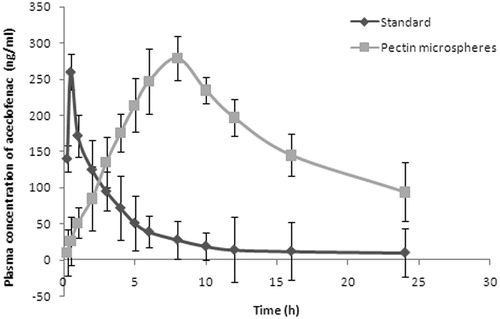
Table 4. Comparison of pharmacokinetic parameters of optimized batch microsphere (E-APM16) and standard.
Both pharmacodynamics and pharmacokinetics study revealed that after test formulations treatment, the alterations produced in arthritic rats with respect to LPO and antioxidant concentrations were modulated nearly to normal levels. A good correlation between the dissolution and absorption profiles was observed. The in vitro–in vivo correlations were obtained for absorption rate constant versus dissolution rate constant, which showed linearity with value almost equals 1. Thus, level A defines the relationship between an in vitro dissolution curve and an in vivo input (absorption) profile. The correlation quality depends solely on the quality of the data.
Organ distribution study
As with in vivo studies, APM16 formulation was again selected on the basis of in vitro release performance for organ distribution study in albino rats in order to establish its targeting ability in colon. The results indicated that the maximum (70.2 ± 1.19%) concentration of aceclofenac was observed after 2 h in stomach following oral administration of plain aceclofenac and in subsequent hours; much less drug reached the small intestine, and virtually no drug was found in the colon. Whereas only 27.3 ± 1.02% of total drug load of pectin microspheres reached the colon after 8 h while a maximum of 79.12 ± 1.32% of drug released in the small intestine. The Eudragit-coated pectin microspheres were observed relatively intact in the upper part of the GIT. Approximately 2% of total drug load was released during its transit through the upper GIT. After 6–8 h, the maximum percentage of drug was observed in the colon (95.12 ± 0.63%), and a negligible amount of drug was found in the small intestine. This release pattern of aceclofenac from Eudragit-coated aceclofenac microspheres can be understood by the protective nature of Eudragit coating delaying the drug release in upper GIT. The drug aceclofenac was released from Eudragit-coated aceclofenac microspheres only after reaching the colon owing to the dissolution of Eudragit-coated aceclofenac microspheres in colonic pH and reaction with microbial flora residing in the colon.
Conclusion
To the best of our knowledge, none demonstrated the pectin’s characteristics as a chronopharmacological polymer, to date. In this study, the Eudragit-coated pectin microspheres were successfully prepared and its potential as a novel chronopharmacological polymer was investigated in vitro and in vivo. The results of the present investigation suggest that emulsion dehydration method followed by solvent evaporation method can be successfully employed to fabricate aceclofenac-loaded pectin microspheres (30–55 µm). Eudragit-coated pectin microspheres bearing aceclofenac, maintained its integrity and premature drug release in the hostile GI environment and delivered the drug in the colonic environment. The plasma concentration-time profiles clearly exhibited a prolonged effect of aceclofenac in rats. The pharmacodynamic study demonstrated that the marker enzymes (ALP, AST and ALT) and enzymic antioxidants (SOD, CAT and GPx), were significantly reduced in arthritic rats after the single dose administration of drug-loaded microspheres. Therefore, it can be concluded that the Eudragit-coated pectin microspheres can be effectively utilized for the colon-specific delivery of drug in the treatment of rheumatoid arthritis.
Declaration of interest
The authors report no declarations of interest.
Acknowledgements
The authors are grateful to Dr. Anbalagan, Principal, Pydah College of Pharmacy for his guidance and useful scientific discussions during the course of the work. One of the authors appreciates the help of Indrani Ramasamy for sharing her immense knowledge and passion toward chemistry.
References
- Ahmed IS. (2005). Effect of simulated gastro intestinal conditions on drug release from pectin/ethylcellulose as film coating for drug delivery to the colon. Drug Dev Ind Pharm 31:465–70
- Ahrabi SF, Madsen G, Dyrstad K, et al. (2000). Development of pectin matrix tablets for colonic delivery of model drug ropivacaine. Eur J Pharm Sci 10:43–52
- Arora S, Ali J, Ahuja A, et al. (2005). Floating drug delivery system: a review. AAPS Pharm Sci Tech 6:372–90
- Ashford M, Fell JT, Attwood D, et al. (1993). An evaluation of pectin as a carrier for drug targeting to the colon. J Control Rel 26:213–20
- Basit AW, Podczeck F, Newton JM, et al. (2004). The use of formulation technology to assess regional gastrointestinal drug absorption in humans. Eur J Pharm Sci 21:179–89
- Bodmeier R, Krogel I. (1999). Development of multifunctional matrix drug delivery system surrounded by an impermeable cylinder. J Cont Rel 61:43–50
- Botti B, Yoan C. (2004). Chronopharmaceutics: gimmick or clinically relevant approach to drug delivery. J Cont Rel 98:337–53
- Bozdag-Pehlivan S, Çetin M, Vural I, Ünlü N. (2009). Eudragit-coated alginate microspheres for colon specific delivery of indomethacin. Available from: www.aapsj.org/abstracts/AM_2009/AAPS2009-002176.PDF [last accessed May 2011]
- Castellanos IJ, Carrasquillo KG, de Jesus Lopez J, et al. (2001). Encapsulation of bovine serum albumin in poly(lactide-co-glycolide) micropsheres by the solid-in-oil-in-water technique. J Pharm Pharmacol 53:167–78
- Chambin O, Dupuis G, Champion D, et al. (2006). Colon-specific drug delivery: influence of solution reticulation properties upon pectin beads performance. Int J Pharm 321:86–93
- Das S, Ng KY, Ho PC. (2011). Design of a pectin-based microparticle formulation using zinc ions as the cross-linking agent and glutaraldehyde as the hardening agent for colonic-specific delivery of resveratrol: in vitro and in vivo evaluations. J Drug Target 19:446–57
- Demiroz TF, Acarturk F, Takka S, Konus-Boyunaga O. (2004). In-vitro and in-vivo evaluation of mesalazine-guargum matrix tablets for colonic drug delivery. J Drug Target 12:105–12
- Edwards C. (1997). Physiology of the colorectal barrier. Adv Drug Del Rev 28:173–90
- El-Gibaly I. (2002). Oral delayed-release system based on zn-pectinate gel (ZPG) microparticles as an alternative carrier to calcium pectinate beads for colonic drug delivery. Int J Pharm 232:199–211
- Food and Drug Administration (1997). Guidance for industry: dissolution testing of immediate release solid oral dosage forms. fishers lane. Rockville, MD: US Department of Health and Human Services, Food and Drug Administration, Center for Drug Evaluation and Research
- Fu X, Ping Q, Gao Y. (2005). Effects of formulation factors on encapsulation efficiency and release behavior in vitro of huperzine A-PLGA microspheres. J Microencapsul 22:705–14
- Gabor F, Ertl B, Wirth M, Mallinger R. (1999). Ketoprofen-poly(d,l-lactic co glycolic acid) microspheres: influence of manufacturing parameters and type of polymer on the release characteristics. J Microencapsul 16:1–12
- Gaikwad M, Belgamwar V, Tekade A, et al. (2010). Formulation and evaluation of floating, pulsatile, multiparticulates using pH-dependent swellable polymers. Pharm Dev Tech 15:209–16
- Glenn B, Gray J, Di VM, et al. (1965). Chemical changes in adjuvant induced polyarthritis of rats. Ann J Ven Res 26:1195–203
- Godefroy F, Besson JM, Butler SH, et al. (1992). A limited arthritic model for chronic pain studies in the rat. Pain 48:73–81
- Hao Z, Xuetao J, Lingshan K, Shen G. (2007). Design and gamma-scintigraphic evaluation of a floating and pulsatile drug delivery system based on an impermeable cylinder. Chem Pharm Bull 55:580–5
- He W, Du Q, Cao DY, et al. (2007). Pectin/ethylcellulose as film-coatings for colon-specific drug delivery: preparation and in vitro evaluation using 5-fluorouracil pellets. PDAJ Pharm Sci Technol 61:121–30
- Hungl D, Siebertl G, Changl P, et al. (2006). Hepatic pharmacokinetics of propranolol in rats with adjuvant-induced systemic inflammation. Am J Physiol Gastrointest Liver Physiol 290:G343–51
- Jain A, Gupta Y, Jain SK. (2008). Potential of calcium pectinate beads for target specific drug release to colon. J Drug Target 15:285–94
- Jain SK, Rai G, Saraf DK, Agrawal GP. (2008). The preparation and evaluation of albendazole microspheres for colonic delivery. Pharm Tech 12:45–51
- Kawamura T, Ohisa Y, Abe Y, et al. (1992). Plasma lipid peroxides in the operation of oesophageal cancer. Rinsho-Ayori 40:881–4
- Khatun M, Islam A, Akter P, et al. (2005). Controlled release of naproxen sodium from Eudragit RS 100 transdermal film. J Pharm Sci 3:1–2
- Krishnaiah YSR, Satyanarayana V, Dineshkumar B, Karthikeyan RS. (2002). In vitro drug release studies on guar gum-based colon targeted oral drug delivery systems of 5-fluorouracil. Eur J Pharm Sci 16:185–92
- Krishnaiah YSR, Satyanarayana V, Kumar BD. (2003). In vivo pharmacokinetics in human volunteers: oral administered guargum-based colon-targeted 5-fluorouracil tablets. Eur J Pharm Sci 19:355–62
- Krishnaiah YSR, Satyanarayana S, Rama Prasad YV, Narasimha Rao S. (1998). Evaluation of guargum as a compression coat for drug targeting to colon. Int J Pharm 171:137–46
- Lemoine D, Wauters F, Bouchend S, Preat V. (1998). Preparation and characterization of alginate microspheres containing model antigen. Int J Pharm 176:9–19
- Liu L, Fishman ML, Kost J, Hicks KB. (2003). Pectin-based systems for colon-specific drug delivery via oral route. Biomaterials 24:3333–43
- Lorenzo-Lamosa ML, Remunan-Lopez C, Vila-Jato JL, Alonso MJ. (1998). Design of microencapsulated chitosan microspheres for colonic drug delivery. J Cont Rel 52:109–18
- Macleod GS, Fell JT, Collett JH, et al. (1999). Selective drug delivery to the colon using pectin: chitosan: hydroxyl propyl methyl cellulose film coated, tablets. Int J Pharm 187:251–7
- Maestrelli F, Cirri M, Corti G, et al. (2008). Development of enteric-coated calcium pectinate microspheres intended for colonic drug delivery. Eur J Pharm Biopharm 69:508–18
- Marianne H, Ingunn T, Sverre AS. (2003). The formation and permeability of drugs across free pectin and chitosan films prepared by a spraying method. Eur J Pharm Biopharm 56:175–82
- McConnell EL, Tutas J, Mohamed MAM, et al. (2007). Colonic drug delivery using amylase films: the role of aqueous ethyl cellulose dispersions in controlling drug release. Cellulose 14:25–34
- Mehrgan H, Mortazavi SA. (2005). The release behavior and kinetic evaluation of diltiazem HCl from various hydrophilic and plastic based matrices. Iran J Pharm Res 3:137–46
- Milojevic S, Newton JM, Cummings JH, et al. (1996). Amylose as a coating for drug delivery to the colon: preparation and in vitro evaluation using 5-aminosalicylic acid pellets. J Cont Rel 38:75–84
- Momin M, Pundarikakshudu K. (2004). In vitro studies on guar gum based formulation for the colon targeted delivery of Sennosides. J Pharm Pharmaceut Sci 7:325–31
- Niino-Nanke NY, Akama H, Hara M, et al. (1998). Alkaline phasphatase (ALP) activity in rheumatoid arthritis – its clinical significance and synthesis of ALP in RA synovium. Ryumachi 38:581–8
- Nurjaya S, Wong TW. (2005). Effect of microwave on drug release properties of matrices of pectin. Carb Polym 62:245–57
- Paharia A, Yadav AK, Rai G, et al. (2007). Eudragit-coated pectin microspheres of 5-fluorouracil for colon targeting. AAPS Pharm Sci Tech 8:1–12
- Patel VM, Prajapati BG, Patel MM. (2007). Formulation, evaluation, and comparison of bilayered and multilayered mucoadhesive buccal devices of propranolol hydrochloride. AAPS Pharm Sci Tech 8:E147–54
- Pillay V, Fassihi R. (1999). In vitro release modulation from crosslinked pellets for site-specific drug delivery to the gastrointestinal tract: II. Physico-chemical characterization of calcium-alginate, calcium-pectinate and calcium-alginate-pectinate pellets. J Cont Rel 59:243–56
- Queen MC, Silvia C, Lai A, Amiji PMC. (2000). Surface and blood interaction properties of polyethylene oxide modified pectin microspheres. STP Pharm Sci 10:95–100
- Rainsford KD. (1982). Adjuvant polyarthritis in rats: is this a satisfactory model for screening anti-arthritic drugs? Agents Actions 12:452–8
- Rang AP, Dale MM, and Ritter JM. (2001). Pharmacology. 4th edn. London: Churchill Livingstone, 229–36
- Richman DD, Fischl MA, Grieco MH. (1987). The toxicity of azidothymidine (AZT) in the treatment of patients with AIDS and AIDS related complex. N Engl J Med 317:192–7
- Ritger PL, Peppas NA. (1987). A simple equation for description of solute release. II Fickian and anomalous release from swellable devices. J Cont Rel l5:37–42
- Rodriguez M, Vila-Jato JL, Torres D. (1998). Design of new multiparticulate system for potential site specific and controlled drug delivery to the colonic region. J Cont Rel 55:67–77
- Rubinstein A, Radai R. (1995). In vitro and in vivo analysis of colon specificity of calcium pectinate formulations. Eur J Biopharm 41:291–5
- Semde R, Amighi K, Devleeschouwer MJ, Moes AJ. (2000). Studies of pectin HM/Eudragit RL/Eudragit NE film-coating formulations intended for colonic drug delivery. Int J Pharm 197:181–92
- Shimono N, Takatori T, Ueda M, et al. (2002). Chitosan dispersed system for colon-specific drug delivery. Int J Pharm 245:45–54
- Sinha VR, Mittal BR, Bhutani KK, Kumria R. (2004a). Colonic drug delivery of 5-fluorouracil: an in vitro evaluation. Int J Pharm 269:101–8
- Sinha VR, Singla AK, Wadhawan S, et al. (2004b). Pectin microspheres as a potential carrier for drugs. Int J Pharm 274:1–33
- Tugcu-Demiroz F, Acarturk F, Takka S, Konus-Boyunaga O. (2008). In-vitro and in-vivo evaluation of mesalazine-guargum matrix tablets for colonic drug delivery. J Drug Target 12:105–12
- United States Pharmacopoeia (2008). 19th edn. Rockville, Maryland, USA. Available from: http://www.usp.org [last accessed April 2011]
- Vaidya A, Jain A, Khare P, et al. (2009). Metronidazole loaded pectin microspheres for colon targeting. J Pharm Sci 98:4229–36
- Wakerly Z, Fell JT, Attwood D, Parkins D. (1996a). In vitro evaluation of pectin-based colonic drug delivery systems. Int J Pharm 129:73–7
- Wakerly Z, Fell JT, Attwood D, Parkins D. (1996b). Pectin/ethylcellulose film coating formulations for colonic drug delivery. Pharm Res 13:1210–12
- Wei J, Yuan WG, Qiang NC, Gen PX. (2003). Anti-inflammatory effects of an herbal medicine on carrageenan and adjuvant induced paw edema in rats. J Ethno Pharmacol 89:139–41
- Winter CA, Risley EA, Nuss GW. (1962). Carrageenin-induced edema in hind paw of the rat as an assay for anti inflammatory drugs. Proc Soc Exp Biol Med 111:544–7
- Xi MM, Zhang SQ, Wang XY, et al. (2005). Study on the characteristics of pectin-ketoprofen for colon targeting in rats. Int J Pharm 298:91–7
- Xu C, Zhang JS, Mo Y, Tan RX. (2005). Calcium pectinate capsules for colon-specific drug delivery. Drug Dev Ind Pharm 31:127–34
- Yagi K. (1987). Lipid peroxides and human diseases. Chem Phys Lipids 45:337–51
- Yamaguchy S. (1991). The role of SOD an antioxidant. J Natl Cancer Inst 28:221–32
- Yang MS, Cui FD, You BG, et al. (2003). Preparation of sustained-release nitrendipine microspheres with eudragit RS and aerosil using quasi-emulsion solvent diffusion method. Int J Pharm 259:103–13