Abstract
The low encapsulation efficiency of conventional solid lipid microparticles (SLMs) especially for hydrophilic drugs has remained a challenge to drug formulation experts. This work seeks to address the issue of inefficient delivery of metformin hydrochloride (MTH), a potent hydrophilic oral antihyperglycemic agent, using novel SLMs based on solidified reverse micellar solutions (SRMS) prepared by melt-emulsification using a lipid derived from Capra hircus and Phospholipon® 90H. Characterization based on size, morphology, zeta potential, polydispersity index, encapsulation efficiency (EE%), loading capacity (LC) and time-resolved stability were carried out on the SLMs. The in vitro release of MTH from the SLMs was performed in phosphate buffer (pH 7.4) while the in vivo antidiabetic properties were investigated in alloxan-induced diabetic rats. Stable, spherical and smooth SLMs were obtained. Loading of MTH into the SLMs had no effect on the surface charge of the particles. The SLMs with 1.0%w/w PEG 4000 resulted in significantly (p < 0.05) higher EE% while those with 2.0%w/w gave the least. The LC values ranged from 20.3 to 29.1 and 14.6 to 24.1 for SLMs containing 500 mg and 250 mg of MTH, respectively. The in vitro release studies revealed significant release of MTH from the SLMs whereas the in vivo antidiabetic studies indicated that novel SLMs containing 500 mg of MTH gave significantly (p < 0.05) higher glucose reduction than glucophage®. This research has shown that SLMs based on SRMS offer a new and better approach of delivering MTH, thus encouraging further development of this formulation.
Introduction
The proven safety and efficacy of lipid-based carriers make them potential alternative drug carrier materials to polymers (Reithermeier et al., Citation2001) as well as attractive candidates for preparing lipid-based formulations (Schwarz et al., Citation1994). These formulations allow hydrophilic and/or hydrophobic drugs to be incorporated (Hu et al., Citation2002), provide protection of incorporated active compounds against degradation as well as offer the possibility of improved bioavailability, controlled drug release and drug targeting (Muller et al., Citation2000). Solidified reverse micellar delivery systems are lipid-based biodegradable matrix drug delivery systems (Friedrich & Muller-Goymann, Citation2003), that have been widely investigated as potential drug delivery systems for drugs which encounter low EE%, penetration and absorption problems (Friedrich et al., Citation2000, Citation2005).
Metformin hydrochloride (MTH) is a most widely prescribed oral antihyperglycemic agent especially in the management of type 2 diabetes mellitus. Despite its widespread clinical utility, MTH is associated with several problems including poor absorption, low bioavailability, frequent dosage and GIT side effects (Momoh et al., Citation2011). By tactical engineering of lipid drug delivery systems, such as solidified reverse micellar solution (SRMS)-based solid lipid microparticles (SLMs), these problems could be surmounted.
Homolipids and heterolipids have gained renewed interests as excipients for different drug delivery systems (Attama & Muller-Goymann, Citation2007). The rapid growth in the use of lipid-based drug delivery systems is primarily due to the diversity and versatility of pharmaceutical grade lipid excipients and drug formulations, and their compatibility with liquid, semi-solid and solid dosage forms (Attama & Muller-Goymann, Citation2006). The widening availability of lipidic excipients with specific characteristics offer flexibility of application with respect to improving the bioavailability of hydrophilic as well as hydrophobic drugs (Gursoy & Benita, Citation2004). Homolipids are esters of fatty acids with various alcohols. Previous studies on drug delivery systems based on a homolipid (goat fat) from Capra hircus containing either hydrophilic or lipophilic drugs demonstrated positive results (Attama & Muller-Goymann, Citation2006; Attama et al., Citation2009). Similarly, Phospholipon® 90 H (P90H) has been shown to be a good excipient in the formulation of SLMs based on SRMS and has successfully been employed to achieve controlled release of incorporated drugs (Nnamani et al., Citation2010).
Consequently, the objectives of this study were to formulate SRMS (lipid matrices) consisting of P90H and a homolipid from C. hircus, and SRMS-based SLMs containing MTH using the melt-emulsification technique. The lipid matrices were characterized by differential scanning calorimeter (DSC) while the SLMs were evaluated for in vitro and in vivo release of MTH from such a delivery system.
Experimental
Materials
The following materials were used; goat fat (a biodegradable homolipid obtained from C. hircus and purified in our laboratory), Phospholipon® 90H (Nattermann, Cologne, Germany), Poloxamer 188® (BASF, Germany), polyethylene glycol 4000 (Cary Roth, Karlsruhe, Germany), monobasic potassium phosphate, sodium hydroxide and concentrated hydrochloric acid (BDH, Poole, England), distilled water (Lion Water, University of Nigeria, Nsukka, Nigeria). Metformin hydrochloride pure sample was obtained as a gift from Farmex Meyer Pharma Ltd. (Ikeja, Lagos State, Nigeria). Other reagents were of analytical grade and used without further purification.
Extraction and purification of homolipid from C. hircus
The homolipid was extracted from the adipose tissue of C. hircus by wet rendering (Attama et al., Citation2003). Briefly, the adipose tissue was grated and subjected to moist heat by boiling with about half its weight of water in a water bath for 45 min. The molten fat was separated from the aqueous phase after filtering with a muslin cloth. The extracted fat was further subjected to purification by passing it through a column of activated charcoal and bentonite (2:1) at 100 °C at a ratio of 10 g of the fat and 1 g of the column material. The fat was stored in a refrigerator until used.
Preparation of lipid matrices
Lipid matrices consisting of a mixture of 70%w/w goat fat (homolipid) and 30%w/w Phospholipon® 90H (P90H) were prepared by the fusion method. Briefly, 35 g of goat fat and 15 g of P90H were weighed using an electronic balance (Mettler H8, Switzerland), poured into a crucible and melted together at 75 °C on a thermo-regulated water bath shaker (Heto, Allerod, Denmark) and stirred thoroughly to obtain an adequate mixing. Thereafter, the lipid matrix was allowed to cool and solidify at room temperature.
Differential scanning calorimetry
Melting transitions and changes in heat capacity of the lipid matrix together with the component lipids were determined using a calorimeter (DSC) (NETZSCH DSC 204 F1, Phoenix®, Germany). Approximately 5 mg of the lipid matrix was weighed into an aluminum pan, sealed hermetically and the thermal behavior determined in the range of 20–220 °C at a heating rate of 5 °C/min and then cooled back to 20 °C. The baselines were determined using an empty pan, and all the thermograms were baseline-corrected.
Preparation of drug unloaded and loaded SLMs
In this study, the melt homogenization technique (Jaspart et al., Citation2007) was adopted. In each case, the lipid matrix was melted at 70 °C, and MTH was introduced into the melted lipid and stirred thoroughly. The aqueous phase containing PEG-4000 and Poloxamer 188® at the same temperature was added to the molten lipid matrix with gentle stirring using a magnetic stirrer (SR 1 UM 52188, Remi Equip., India), and the mixture was further dispersed with a mixer (T 25 digital Ultra-Turrax®; IKA, Staufen, Germany) at 8000 rpm for 5 min to produce the hot primary emulsion. The SLMs suspension obtained after cooling at room temperature was then lyophilized using a freeze-dryer (Amsco/Finn-Aqua® Lyovac GT3, Germany) in order to get water-free SLMs. The above procedure was repeated using increasing amount of PEG (0.5, 1.0, 1.5 and 2.0 g), decreasing amount of lipid matrix (4.5, 4.0, 3.5 and 3.0 g); and increasing the concentrations of MTH (250 and 500 mg) to obtain MTH-loaded SLMs (batches A1–A4 and B1–B4). The unloaded–loaded SLMs (without drug) were similarly prepared (batches C1–C3). The formulation compositions are shown in .
Table 1. Quantities of material used for SLMs formulation.
Characterization of SLMs formulations
Particle size analysis, zeta potential and morphological characterization of SLMs
The particle size of the SLMs was determined by the photon correlation spectroscopy (PCS) using a Zetasizer nano (ZEN 3600; Malvern Instruments, Malvern, UK). For the particle size analysis, the samples were measured in suspension after particle preparation and further necessary dilutions using double purified water. Measurements were carried out at 25 °C at a light-scattering detection angle of 90 °C.
The morphology of the SLMs was determined by the computerized image analysis. Approximately 3.0 mg of the SLMs from each batch was dispersed in distilled water and smeared on a slide (Marinfield, San Francisco, CA) using a glass rod. Each of the batches was covered with a cover slip, mounted and observed under a light photomicroscope (Lieca Camera AG, Solms, Deutschland, Germany). With the aid of the software in the photomicroscope, the particle morphologies were observed and photomicrographs were taken. All these were done in a time-dependent manner (24 h, 1 month and 2 months).
pH analysis as a function of stability of the formulation
With the aid of a pH meter (Digital pH Meter, Labtech, UK), the pH values of the different batches of the SLMs were measured. This was also carried out in a time-dependent manner (24 h, 1 month and 2 months).
Encapsulation efficiency (EE%)
The encapsulation efficiency of each formulation was determined. A 6 ml volume of each SLM dispersion was placed in a centrifuge tube and centrifuged for 60 min at an optimized speed of 2000 rpm in order to obtain two phases (the aqueous and lipid phases). A 1 ml volume of the aqueous phase was measured with the aid of a syringe and then diluted 1000-fold using distilled water. The absorbances of the dilutions were taken using a UV-spectrophotometer (Jenway 6405, UK) at a wavelength of 278 nm and the EE % was calculated using the formula below:
Loading capacity
Loading capacity (LC) is expressed as the ratio between the entrapped drug by the lipid and the total quantity of the lipids used in the formulation. It was calculated using Equation (2):
In vitro drug release studies
The USP XXII rotating paddle apparatus (Erweka, GmbH Germany) was employed for this release study. The dissolution medium consisted of 500 mL of freshly prepared phosphate buffer maintained at 37 ± 1 °C by means of a thermostated water bath. The polycarbonate dialysis membrane used as a release barrier was pre-treated by soaking it in the dissolution medium for 24 h prior to the commencement of each release experiment. In each case, 0.3 g of SLMs was placed in the dialysis membrane containing 5 mL of the dissolution medium, securely tied with a thermo-resistant thread and then immersed in the dissolution medium under agitation provided by the paddle at 200 rpm. At predetermined time intervals (10, 30, 60, 90, 120, 180 and 240 min), 5 mL portions of the dissolution medium were withdrawn and replaced with equal volume of the medium to maintain a sink condition, filtered with a pore size of 0.22 µm (Millipore filter, Delhi, India) and analyzed spectrophotometrically (Jenway, UK) at 238 nm. The amount of drug released at each time interval was determined with reference to the standard Beer’s plot for MTH in phosphate buffer. This test was carried out in triplicate for all the batches.
Kinetic analysis of in vitro release profiles
In order to investigate the mechanism of drug release from SLMs, the release data were analyzed using the following mathematical models: zero-order, first-order, Higuchi equation, Korsmeyer–Peppas and Hixson–Crowell models.
where Q is the percent of drug released at time t, Q0 is the percent of drug remaining and K0, K1 and KH are the coefficients of the equations. Kp is a constant incorporating structural and geometric characteristics of the release device, and n is the release exponent indicative of the mechanism of release.
In vivo studies
Albino Wistar rats of both sexes weighing about 210–230 g were housed in a 12–12-h light–dark cycle and constant temperature environment of 22 °C, which are monitored periodically using a thermometer. All animal experimental procedures were reviewed and approved by the Committee for Animal Research according to the Department of Pharmaceutics, University of Nigeria, Nsukka, and were in compliance with the Federation of European Laboratory Animal Science Association and the European Community Council Directive of November 24, 1986 (86/609/EEC). Diabetes was induced with a single intraperitoneal injection of 50 mg/kg alloxan in isotonic saline solution. After 8–10 d of the alloxan monohydrate treatment, rats with frequent urination, loss of weight and blood glucose levels higher than 250 mg/dL were selected and randomly divided into six groups. Before testing, animals were fasted overnight with free access to water. To minimize the diurnal blood glucose fluctuations, experiments were performed in the morning (Mao et al., 2005).
Based on the preliminary evaluation in our earlier work and the encapsulation efficiency, drug loading and the in vitro release in this work, batches A1, B1 (loaded SLMs) and C1 (unloaded SLMs) were selected for the in vivo studies. The rats in group 1 were received 1.5 ml of normal saline (NS) orally as negative control. The rats in group 2 received 2 ml of pure metformin HCl (PM) dispersed in distilled water in a dose of 2 mg/kg as a positive control. The rats in groups 3 and 4, were given MTH-loaded SLMs (A1 and B1), respectively, while rats in groups 5 and 6 received unloaded SLMs (C1) (i.e. without metformin HCl) and marketed MTH sample (MS), respectively, in the form of oral solution of MTH according to the body weight of the rats. The above formulations were in the medium of physiological saline. The oral administration volume of solution of SLMs was in the range of 1–2 ml. Blood samples were collected from the tail of each rat at different time intervals. Blood glucose was determined using an Accu-check machine (ACCU-CHECK, Roche, San Francisco, CA). Results were presented as the mean values of blood glucose levels of animals at each group.
Results and discussion
Thermal properties of lipid matrices
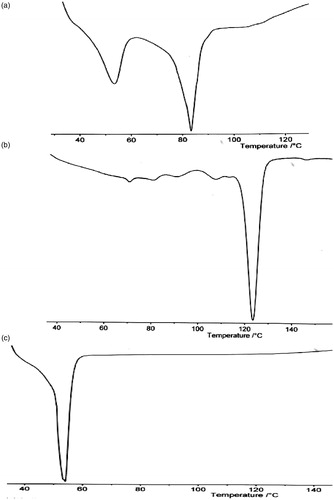
The DSC profiles of P90H, goat fat and lipid matrix are shown in . The thermogram of the lipid matrix showed a sharp endothermic peak corresponding to melting at 82.18 °C, while that of P90H and goat fat showed endothermic peaks at 122.10 °C and 53.2 °C, respectively. Goat fat alone () presents a slightly narrowed base endothermic peak as compared to the endotherm of P90H alone () and the lipidic blend (). The (DSC) melting endotherm of P90H was 122.10 °C with an enthalpy of −2.0 mW/mg. This melting point value deviated from what was found on the product sheet or the certificate of analysis probably due to a variation in sensitivity of the DSC machine. The DSC trace of goat fat shows a peak at 53.2 °C with an enthalpy value of −5.0 mW/mg. However, the lipid matrix showed a peak at 82.18 °C and an enthalpy of −3.0 mW/mg. This shows that the matrix is less crystalline than the individual components due to its lower enthalpy value suggesting that the lipid matrix possessed a lower crystallinity. This means that the lipid matrix generated had an imperfect matrix (due to distortion of crystal arrangement of the bulk lipid after melting and solidification), which would have created numerous spaces for drug localization.
Figure 1. DSC thermogram of (a) goat fat/Phospholipon® 90H blend, (b) Phospholipon® 90H and (c) goat fat.
Physicochemical properties of SLMs
The particle size, zeta potential and entrapment efficiency of the SLMs formulation are presented in and . The results showed that the particle size of unloaded SLMs (C1–C4) were in the range of 34.0 ± 0.3–57.1 ±0.1 µm. This was slightly greater than the particle size range of MTH-loaded SLMs (23.0 ± 0.2–44.0 ± 0.1 µm) and (25.0 ± 0.3–43.0 ± 0.0 µm) for sub-batches in A and B, respectively. In all the formulations, sub-batches A1, B1 and C1 possessed the lowest mean particle sizes when compared to other batches. However, when sub-batches A1, B1 and C1 were compared, it was observed that A1 possessed the least mean particle size. There was a slight increase in particle size between 24 h and 2 months for lipospheres from all the batches containing varying quantities of PEG-4000 and the active pharmaceutical ingredient (API) (). Increase in particle size is usually as a result of aggregation and subsequent growth by the Ostwald ripening or sintering. Because of the apparent particle size stability obtained after 2 months, these systems could be adjudged to be relatively stable.
Figure 2. Time-resolved particle size analysis of the SLMs. A1–A4 contain 500 mg of MTH, B1–B4 contain 250 mg of MTH while C1–C4 contain no API. Points represent mean ± SD (n = 3).
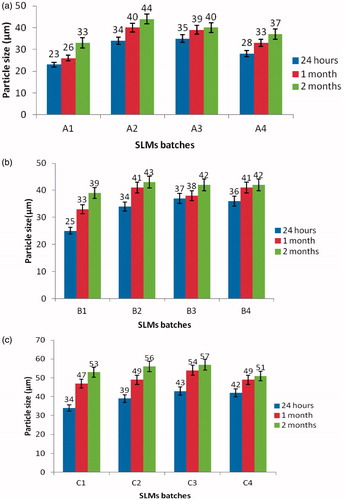
Table 2. Results of characterization of SLMs.
The polydispersity index (PDI) of the particles sizes are: 0.388, 0.367, 0.400 and 0.379 for batches A1–A4, respectively, 0.390, 0.366, 0.392 and 0.394 for batches B1–B4, respectively, while that of batch C1–C4 gave 0.498, 0.510, 0.547 and 0.569, respectively. These results showed an unimodal size distribution of the particle sizes, implying that the formulations are stable. The particle sizes of the unloaded and MTH-loaded SLMs as determined by the photon correlation spectroscopy were found to be 23.0 and 34.0 µm, respectively, within 24 h of the formulation. The particle sizes increased to 33.0 and 53.0 µm upon storage for 2 months, which may be due to crystallization of the formerly molten matrices. The growth of the particles did not affect their shapes (). The zeta potential measurements revealed that the loaded and unloaded SLMs in sub-batches of A, B and C had a mean surface charge of between −28.0 to −38, −23 to −41 and −18 to −29 mV at pH 7.0, respectively (). The zeta potentials of the SLMs formulations were all negative. However, the zeta potential for drug-loaded SLMs in sub-batches A and B was slightly higher than the unloaded SLMs, the surface charges were in the range of −26 to −48 and −30 to −41 for A and B, respectively, whereas the unloaded SLMs in sub-batch C showed −18 to −29. The observed increase in the zeta potential in the loaded SLMs could be attributed to drug incorporated into the formulation. However, the incorporated drug did not change the surface charge of the formulation. In other words, loading of MTH into the SLMs had no effect on the surface charge of the particles, because the unloaded SLMs have the same surface charges as the loaded SLMs. Study has shown that higher zeta potential is a key determinant in the stability of colloidal formulation (Banerjee et al., Citation2008), it is stipulated that zeta potential greater than or equal to +30 to −30 mV is an indication of good stability. Furthermore, negative surface charge obtained here may have been imparted or to the SLMs by the type of lipids used in the formulations. The high zeta potential, apart from stabilizing the particles, also reduces the particles aggregation which minimizes the coalescence and flocculation (Banerjee et al., Citation2008). Biologically, the study has shown that positively charged zeta potentials have a higher potency for interaction with biological membranes than negatively charged particles. However, the negatively charged zeta potential observed in this study may interact with the positively charged D-glucosamine residue of the mucin in the mucosa wall thereby causing alterations in the permeability and ease of transport through electrostatic attraction. This is an indication that particle surface charge is a vital factor in manipulating the process of particle entry into the biological system (Chung et al., Citation2010). The encapsulation efficiency of the drug-loaded SLMs () were all high. The drug-loading efficiency increases with an increase in the concentration of the drug, such that the maximum percentage drug EE% was obtained with sub-batch A1 and the least was obtained with sub-batch A3. It shows that the solubilizer together with the lipid matrix promoted concentration-dependent drug solubilization. The lipid matrix accommodated more drugs at a higher drug loading due to the low crystalline nature of the excipients. In addition, the incorporation of P90H in SLMs might have resulted in the formation of structured lipid matrices, which invariably enhanced the incorporation of the drug into the core of the SLMs and increased the drug-loading and encapsulation efficiency. Furthermore, PEG-4000 being a hydrophilic surfactant improved the solubilization of the drug within the core lipids. Moreover, P90H further enhanced the percent drug entrapment and promoted the achievement of smaller particle sizes due to increased hydrophobicity, which resulted to a decrease in the sizes of the particles obtained (Azeem et al., Citation2009).
The pH of the different batches of SLMs () was measured 24 h, 1 and 2 months after preparation to ascertain the variation of pH with time, which could be a function of degradation of the API or excipients. A priori-stable API may be affected by the degradation of excipients with storage through the generation of unfavorable pH (increase or decrease) or reactive species for the API. It is necessary to know the pH of maximum stability of an API or its stability profile, and utilize that in designing a suitable formulation for the API. This will inform the formulation scientist whether to include a stabilizer or not in the new formulation. The results of the time-dependent pH analysis carried out on the various batches of the MTH-loaded and unloaded SLMs are presented in . The pH values varied and were in the range of 4.7–6.2, 3.9–4.8 and 4.2–5.2 for batches A, B and C, respectively, within 24 h of preparation. After one month of storage, all the sub-batches in batch A had pH in the range of 4.7–7.2, the sub-batches in batch B had pH in the range of 3.9–6.9, while the pH of the unloaded batches were found to be in the range 4.9–5.7. Similarly, the pH varied between 6.2–7.2, 4.3–6.9 and 4.9–5.7 for batches A, B and C, respectively, after 2 months of storage of the formulations. It is discernible from that there was a gradual increase in pH value of SLMs containing MTH (API) as well as for the unloaded SLMs. The data obtained indicated that SLMs loaded with 500 mg MTH (batches A1–A4) recorded the greatest increase in pH values. The slight increase in the pH values which varied from acidity through neutrality to alkalinity in most of the SLMs could not be attributed to drug degradation since there was also a rise in the pH of the unloaded SLMs.
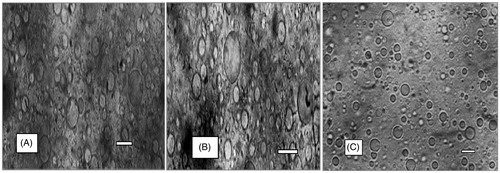
Representative photomicrographs of the loaded and unloaded SLMs prepared with homolipid and P90H are presented in . The morphological features of the various batches of the SLMs showed that the formulations were fairly smooth, irregularly shaped and remained stable in suspension form after storage for 1 month. The unloaded and the loaded SLMs showed similar morphological features, indicating that the incorporation of drug into the SLMs did not alter the shape of the particles. The reason for the irregularly shaped SLMs is uncertain, but may be due to lyophilization of the microparticles without a cryoprotectant.
Figure 3. Representative of the morphology of the SLMs. A1, B1 and C1 contain 500 mg of MTH, 250 mg of MTH and no API, respectively.
In vitro drug release properties
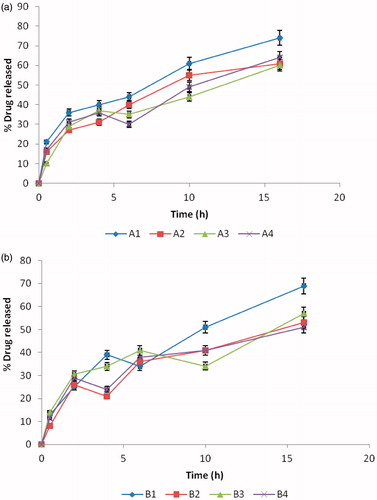
shows the release profiles of MTH from all the batches of SLM formulation in phosphate buffered solution (PBS, pH 7.4). The in vitro release profiles of MTH in PBS indicate significant release of MTH from all batches of the formulation. In batch A formulations, sub-batch A1 gave a maximum release of 74%, while sub-batch A3 gave the least (maximum release of 60%). Similarly, in batch B formulations, sub-batch B1 released the highest amount (i.e. 69%) of the drug, while sub-batch B4 released the least amount (51% of the drug). However, batch C was not subjected to this evaluation, since it was not loaded with MTH (i.e. batch C contains no drug). It is evident that MTH release in vitro underwent a rapid initial burst followed by a slow dissolution. The effect of the initial burst in the formulations was less pronounced. MTH release from the SLMs increased with decrease in particle sizes of the SLMs, consistent with earlier report (Wong et al., Citation1992). For instance, in batch A formulations, sub-batch A1 with the least particle size (33 µm) gave a maximum release of 74%, while sub-batch A3 with the highest particle size (47 µm) gave a maximum release of 64%. Similarly, in batch B formulations, sub-batch B1 with the least particle size (39 µm) released 69% of the drug, while sub-batch B2 with the highest particle size (43 µm) released 57% of the drug. There was a sustained release of MTH from all the batches of SLMs formulations. Furthermore, the steady release noticed in batch A was not significant at p > 0.001. The reason for this observed effect in sub-batch A may be attributed mainly to the amount of drug (500 mg) in the formulations as compared to formulation B (250 mg). The sizes of the SLMs were all within the micrometer range, indicating that the production process was able to achieve the intended end point. Particle size of microparticles is a very important parameter, since it affects drug release and pharmacokinetics (Berchane et al., Citation2007). For SLMs engineered for parenteral administration, large particles will find it difficult to pass through the syringe. However, the SLMs evaluated in this study are intended for oral administration and particle size will influence only the rate of drug release and subsequent pharmacokinetics.
Figure 4. Percentage drug release from SLMs, (a) Batch A formulations containing 500 mg of MTH; (b) batch B formulations containing 250 mg of MTH. Points represents mean ± SD (n = 3).
Kinetic analysis of in vitro release profiles
Four different mathematical models were used to describe the kinetics of metformin release from the SLMs-based formulations. The criterion for selecting the most appropriate model was chosen on the basis of goodness-of-fit test. Results revealed that all the prepared formulations follow the Higuchi kinetics as shown in . In other words, all the SLMs formulations predominantly followed the diffusion mechanism of drug release. The Higuchi square root equation describes the release from systems where the solid drug is dispersed in an insoluble matrix and the rate of drug release is related to the rate of drug diffusion. The results indicate that for the drug release to occur, the surface of the SLMs would either ruptured or get solvated and this would create pores via which the entrapped drug could diffuse out of the lipidic micro-matrix.
Table 3. Kinetics of release of MTH from SLMs in phosphate buffer.
In vivo antidiabetic properties
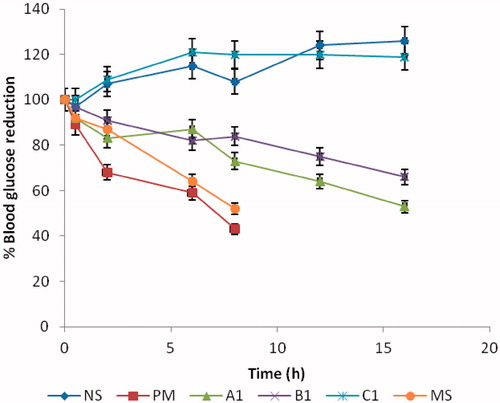
shows the behavior of different formulations administered orally to alloxan-induced diabetic rats. The efficacy of the formulation was assessed by measuring the blood glucose concentration. Results indicate an equivalent hypoglycemic effect with significant blood glucose decrease for all the MTH-loaded formulations. In other words, the various batches of MTH-loaded SLMs effectively lowered the fasting blood sugar levels in the rats as presented in . The glucose reduction profiles indicate that all the loaded SLMs and the MTH dispersed in solution showed a good hyperglycemic control. The rats that received NS and sub-batch C1 continued to have elevated blood glucose levels throughout the 24-h sampling period. This was because there was no drug in the administered samples. However, the formulations that were loaded with MTH (sub-batches A1 and B1) dose-dependently exhibited blood glucose levels of 47% and 43%, respectively. The pure sample (PM) and the marketed sample (MS) also showed a maximum blood lowering effect of 57% and 47%, respectively. Studies have shown that lipid-based excipients can influence oral absorption via various physiological effects, such as retarded gastric emptying (Porter & Trevaskis, Citation2007), stimulating bile flow and secretion of pancreatic juice, increasing the membrane lipid fluidity or acting directly onto enterocytes-based drug transport and disposition (Guruswami et al., Citation2006). The glucose reduction effect was fast within 0.5–1 h after an oral administration of the loaded SLMs. The possible reason for this action may not be unconnected with early release of the MTH that adsorbed to the surface of the SLMs (burst effect). The anti-hyperglycemic effect lasted for 16 h in the drug-loaded SLMs (batches A and B). This prolonged action may be due to the association of the drug in the core of the lipid that was not immediately released from the lipids, which might account for the lasting hypoglycemic effect of the drug-loaded SLMs. In addition, the effect can be attributed mainly to their stability in the acidic conditions of the stomach (Hauss, 2009). The dispersed MTH and the marketed sample lowered the basal glucose level slightly higher at the early stage as compared to the drug-loaded SLMs with maximum effect achieved in 8 h. This effect was not significant at p > 0.005. However, the loaded SLMs maintained a steady effect up to 16 h with maximum lowering effect of 57% at 10 h. However, there was no record of glucose lowering effect associated with the unloaded SLMs and NS-treated groups throughout the study. The reason for this is that the two (unloaded SLMs and NS) contain no drug. The implication of this is that the drug-loaded SLMs actually released the incorporated MTH, an indication that the release of metformin HCl from the SLMs stimulated the production of insulin from the islet cells of Langerhans in a much more controlled manner than the marketed samples, hence, the observed glucose reduction effect in the animal groups that received sub-batches A1 and B1 of the SLMs. Based on the duration of action of the MTH-loaded SLMs, marketed sample and the dispersed drug on the hyperglycemic rats, it is discernible that the formulated SLMs demonstrated their ability to release the incorporated drug in a much more controlled manner than the dispersed and the marketed sample. It also showed that the frequency of administration may reduce in drug-loaded SLMs formulations as compared to the marketed sample whose effect lasted for only 8 h.
Figure 5. Changes in blood glucose levels after oral administration of control and the SLMs, NS = normal saline, PM = pure metformin HCl, A1 = MTH-loaded SLMs (500 mg), B1 = MTH-loaded SLMs (250 mg), C1- unloaded SLMs and MS = marketed sample (mean ± SD, n = 5).
Conclusions
The design and preparation of SRMS-based SLMs is a new and exciting field of research that seeks to exploit the attractive properties of lipid carriers to improve the delivery of therapeutic molecules. To date, SRMS-based SLMs have been shown to be able to protect labile molecules, control drug release, increase drug solubility, increase bioavailability and reduce patient variability. Furthermore, it has proven possible to formulate preparations suitable for most routes of the administration. To improve the bioavailability and prolonged delivery of MTH, SRMS-based SLMs loaded with MTH were prepared by a simple and reproducible method using a cheap and easily available homolipid (goat fat) from C. hircus, which occur abundantly in sub-Saharan Africa. In this study, we have demonstrated that SRMS-based SLM containing MTH would offer a better and more reliable approach of delivering MTH orally than the commercial MTH formulation, thus encouraging further development of this formulation.
Declaration of interest
The authors state no conflicts of interest and have received no funding for the research or in the preparation of this manuscript.
Acknowledgements
We thank Phospholipid GmbH, Koln, Germany and BASF AG, Ludwigshafen, Germany for providing samples of Phospholipon® 90G.
References
- Attama AA, Muller-Goymann CC. (2007). Investigation of surface-modified solid lipid nanocontainers formulated with a heterolipid-templated homolipid. Int J Pharm 334:179–89
- Attama AA, Muller-Goymann CC. (2006). A critical study of novel physically structured lipid matrices composed of a homolipid from Capra hircus and theobroma oil. Int J Pharm 322:67–78
- Attama AA, Nzekwe IT, Nnamani PO, et al. (2003). The use of solid self-emulsifying systems in the delivery of diclofenac. Int J Pharm 262:23–8
- Attama AA, Okafor CE, Builders PF, Okorie, O. (2009). Formulation and in vitro evaluation of a PEGylated microscopic lipospheres delivery system for ceftriaxone sodium. Drug Deliv 16:448–57
- Azeem A, Anwer MK, Talegaonkar S. (2009). Niosomes in sustained and targeted drug delivery: some recent advances. J Drug Target 17:671–89
- Banerjee A, Roychoudhury J, Ali N. (2008). Stearylamine-bearing cationic liposomes kill leishmania parasites through surface exposed negatively charged phosphatidylserine. J Antimicrob Chemother 61:103–10
- Berchane NS, Carson KH, Rice-Ficht AC, Andrews MJ. (2007). Effect of mean diameter and polydispersity of PLG microspheres on drug release: experiment and theory. Int J Pharm 337:118--26
- Chung YI, Kim YC, Kim YH, et al. (2010). The effect of surface functionalization of PLGA nanoparticles by heparin- or chitosan-conjugated pluronic on tumor targeting. J Control Rel 143:374–82
- Friedrich I, Muller-Goymann CC. (2003). Characterization of solidified reverse micellar solutions (SRMS) and production development of SRMS-based nanosuspensions. Eur J Pharm Biopharm 56:111–19
- Friedrich I, Papantoniou I, Muller-Goymann CC. (2000). Physicochemical characterization of a reverse micellar solution after loading with different drugs. Pharmazie 55:755–8
- Friedrich I, Reichi S, Muller-Goymann CC. (2005). Drug release and permeation studies of nanosuspensions based on solidified reverse micellar solutions (SRMS). Int J Pharm 305:167–75
- Gursoy RN, Benita S. (2004). Self emulsifying drug delivery systems (SEDDS) for improved oral delivery of lipophilic drugs. Biomed Pharmacother 58:173–82
- Guruswami S, Kumar V, Mishra DN. (2006). Characterization and in vitro dissolution studies of solid systems of valdecoxib with chitosan. Chem Pharm Bull 54:1102–6
- Hauss DS. (2009). Oral lipid based formulations. Adv Drug Del Rev 57:667–76
- Hu FQ, Yuan H, Zhang HH, Fang M. (2002). Preparation of solid lipid nanoparticles with clobetasol propionate by a novel solvent diffusion method in aqueous system and physicochemical characterization. Int J Pharm 239:121–8
- Jaspart S, Bertholet P, Piel G, et al. (2007). Solid lipid microparticles as sustained release system for pulmonary drug delivery. Eur J Pharm Biopharm 65:47–56
- Mao S, Germershaus O, Fischer D, et al. (2005). Uptake and transport of peg-graft-trimethyl-chitosan copolymer–insulin nanocomplexes by epithelial cells. Pharmacol Res 22:2058–68
- Momoh MA, Adikwu MU, Ibezim CE, Attama AA. (2011). Effect of metformin and Vernonia amygdalina leaf extract loaded PEGylated-mucin formulation on haematological, kidney and liver indices of healthy and diabetes rats. J Pharm Res 4:3455–9
- Muller RH, Mader K, Gohla S. (2000). Solid lipid nanoparticles (SLN) for controlled drug delivery: a review of the state of the art. Eur J Pharm Biopharm 50:161–77
- Nnamani PO, Attama AA, Ibezim CE, Adikwu MU. (2010). SRMS 142-based solid lipid microparticles: application in oral delivery of glibenclamide to diabetic rats. Eur J Pharm Biopharm 76:68–74
- Porter NL, Trevaskis WN. (2007). Charman, lipids and lipid-based formulations: optimizing the oral delivery of lipophilic drugs. Nat Rev Drug Disc 6:231–48
- Reithermeier H, Hermann J, Gopferich A. (2001). Development and characterization of lipid microparticles as a drug carrier for somatostatin. Int J Pharm 218:133–43
- Schwarz C, Mehnert W, Lucks JS, Muller RH. (1994). Solid lipid nanoparticles (SLN) for controlled drug delivery. I Production, characterization and sterilization. J Control Rel 30:83–96
- Wong L, Galligan C, Li A, Wan PO. (1992). Preparation and characterization of sustained-release ibuprofen-cetostearyl alcohol microspheres. Int J Pharm 83:95–114