
Abstract
The present investigation was aimed to develop self-nanoemulsifying tablets (SNETs) as novel nanosized solid oral dosage forms for Irbesartan (IRB). In the first part of the investigation, IRB-loaded self-nanoemulsifying drug delivery systems (SNEDDS) were developed using Capryol 90 – Cremophor RH40 – Transcutol P as three component (oil – surfactant – cosurfactant) SNEDDS system. On the basis of ternary phase diagram IRB-loaded SNEDDS were optimized by using Design of Experiments (DoE) and Principal component analysis (PCA) with amount of oil and surfactant: cosurfactant ratio (Km) as factors. The optimized batch of IRB-loaded SNEDDS comprised of 31.62% w/w of Capryol 90 as oil phase, 49.90% w/w Cremophor RH40 as surfactant and 18.48% w/w of Transcutol P as cosurfactant exemplified a mean globule size as 23.94 nm. Further, with an aim to provide enhanced patient compliance the optimized batch of liquid SNEDDS was transformed into SNETs by liquisolid compaction technique. Solid state characterization of IRB-loaded liquisolid mixtures revealed a decrease in the magnitude of crystallinity of IRB. The results of in vitro drug release study of optimized batch of IRB-loaded SNET illustrated a remarkable improvement in the dissolution rate as compared to marketed tablets (Avapro® 75). The results of in vivo pharmacokinetic study on Wister rats revealed 1.78-fold enhancement in oral bioavailability for IRB-loaded SNETs against marketed tablets. The present study proposed SNEDDS as one of the suitable approach for developing nanosized solid oral dosage forms of poorly water soluble drugs like Irbesartan.
Introduction
The oral medication is generally considered as the first avenue of investigation in drug discovery and development of pharmaceutical formulations predominantly because of patient acceptance, convenience in administration and cost-effective manufacturing process. However, oral drug delivery may also get hampered for some of drug molecules that exhibit poor aqueous solubility (Shahiwala, Citation2011). In the present investigation Irbesartan (IRB) was selected as a model drug from Angiotensinogen II type I receptor blockers (ARBs) class of anti-hypertensive medications (Lloyd-Jones et al., Citation2010). The dissolution of IRB is the rate limiting step for bioavailability of IRB. The poor aqueous solubility, high lipophilicity and low oral bioavailability of IRB rendered it as an ideal candidate for the present research work. Although a number of approaches have been established for improving the physicochemical and pharmacokinetic behaviors of poorly water soluble drugs each of them have their own limitations (Horter & Dressman, Citation2001; Laura et al., Citation2012). It is noteworthy that until today only self-emulsifying drug delivery systems (SEDDS) and nanosuspensions could overcome all the challenges associated with development of nanosized formulations and currently being commercialized (Desai et al., Citation2012).
Self-nanoemulsifying drug delivery system (SNEDDS) is an isotropic mixture of lipid (oil), surfactant, cosurfactant and drug substance that rapidly form a nanoemulsion upon dilution with water (Mezghrani et al., Citation2011). The nanosized drug-loaded droplets of SNEDDS provide a large interfacial area thereby promote the rapid release of drugs (Patel & Sawant, Citation2009; Yongjun et al., Citation2011). Regardless of this, SNEDDS are still liquid formulations with several disadvantages such as incompatibilities of drug with capsule material, low drug stability, drugs leakage and capsule ageing (Balakrishnan et al., Citation2009; Dong et al., Citation2012). The solid forms of SNEDDS (S-SNEDDS) are able to offer the advantages of SNEDDS in combination with those of solid dosage forms such as production reproducibility, improved stability and patient compliance (Cannon, Citation2005). The Quality by Design (QbD) paradigm underlying pharmaceutical drug product development relies on multivariate data, both from formulation and the process in order to explain the multi-factorial relationship between formulation variables, process variables and drug product attributes (Ringnér, Citation2008). Design of experiments (DoE), risk assessment, principal component analysis (PCA) and process analytical technology (PAT) are the major tools that can be used in QbD process as and when necessary (Roopwani & Buckner, Citation2011; Garala et al., Citation2013). The majority of scientists now routinely use DoE as a part of scientific approach in order to reduce costs and improve quality within timelines to obtain robust products and processes. Hence, the present investigation was aimed to transform the optimized batch of IRB-loaded liquid SNEDDS into a tablet dosage form as self-nanoemulsifying tablets (SNETs) (Mahmoud et al., Citation2009) by implementation of QbD techniques (Spireas, Citation2002; Nokhodchi et al., Citation2010; Nagabandi et al., Citation2011).
Materials and methods
Materials
IRB was obtained as a gift sample from Torrent Research Center, Bhat, Gandhinagar, India. The materials like; Capmul MCM, Capmul PG8, Captex 355, Acconon E, Acconon CC400, Acconon Sorb 20, Capmul GMO50, Capmul PGE 860, Caprol ET and Capmul MCM C8 were generously donated by Abitec Corporation. Miglyol 812 and Imwitor 742 were kindly gifted from Sasol GmbH, Witten, Germany. Capryol 90, Labrafac CC, Labrafac Lipophile WL1349, Labrafil M 2125CS, Maisine 35-1, Paceol, Lauroglycol 90 and Plurol Oleique CC497 were gifted from Gettefosse Saint-Priest Cedex, France. Sefsol 218 was obtained as a gift sample from Nikko Chemicals, Tokyo, Japan. Cremophor RH40, Cremophor EL, Gelucire 44/14, Labrasol and Solutol HS 15 were donated from BASF Corporation. Acrysol K 140 and Acrysol EL 135 were gifted from Corel Pharma, Gujarat, India. Isopropyl Myristate (IPM), Olive oil, Oleic acid, Castor oil, were procured from Loba Chem, Mumbai, India. Tween 20, Tween 80, Polyethylene glycol (PEG) 400, Propylene glycol (PG), Triacetin, Aerosil 200, Microcrystalline Cellulose (MCC) PH 101, MCC PH 102 and MCC PH 200 were procured from Himedia Labs, Mumbai, India. Fujicalin and Neusilin US2 were obtained as gift samples from Fuji Chemicals, Toyama, Japan. Double distilled water was used throughput the study. Acetonitrile and methanol used in the present study were of high performance liquid chromatography (HPLC) grade. All other chemicals were reagent grade. Empty hard gelatin capsule shells were generously donated by Torrent Research Center, Gujarat, India.
Animals
Male Wister rats with an average weight of 200 ± 20 g and age ∼10 weeks (on the day of study) were probed in order to investigate pharmacokinetic behavior of optimized formulations. The study was approved by Institutional Ethics Committee of Department of Pharmaceutical Sciences, Saurashtra University, Rajkot, Gujarat, India (CPCSEA No: SU/DPS/IAEC/1003, dated: 11/02/2010) and their guidelines were followed throughout the study. All the rats were acclimatized at a temperature 20 ± 2 °C and relative humidity of 45 ± 15%, with a 12-h light/dark cycle over a period of 5 d prior to dose administration. During this acclimatization period, the animals were carefully observed to ensure their good health and suitability for inclusion in the study. For all rats a standard laboratory diet (Pranav Agromart Ltd, Baroda, India) and domestic mains tap water were available ad libitum. The animals were disconnected from diet at least 12 h before dosing. During study periods, rats were housed singly in polypropylene and stainless steel cages (Balakrishnan et al., Citation2009; Patel & Sawant, Citation2009).
Design and development of self-nanoemulsifying drug delivery systems
Formulation and development of IRB-loaded liquid SNEDDS
Selection of SNEDDS components
Selection of oil (solubility studies)
The solubilities of IRB were measured in numerous oils, surfactants and cosurfactants individually by shake flask method. An excess amount of drug was introduced into 2 mL of each excipient and these mixtures were sealed in glass vials. Each of the sample was subjected to vortex mixing on a vortexer (GeNei, Bangalore, India) for 5 min in order to facilitate initial mixing. Further, vials were charged on an environmental shaker bath (Tempo Instruments and Equipments Pvt. Ltd., Mumbai, India) for a period of 72 h at 37 °C with 300 rpm speed. After an equilibrium for additional 72 h at 25 °C temperature, each vial was centrifuged at 10 000 rpm for 10 min using a centrifuge (Remi Laboratory Instruments, Mumbai, India). The supernant of each sample was filtered through a membrane filter (0.45 μm) to remove any undissolved drug if present. The amount of drug in all samples was determined by their subsequent dilution with suitable solvent using double beam UV Visible spectrophotometer (Pharmaspec – 1700, Shimadzu Corporation, Tokyo, Japan) against blank at 244 nm. The study was repeated in triplicate and their mean values were documented (Feng et al., Citation2011; Singh et al., Citation2011).
Selection of surfactant (emulsification study)
Fifteen non-ionic surfactants (Acrysol K140, Acrysol EL135, Acconon E, Acconon CC400, Acconon Sorb20, Capmul GMO50, Caprol PGE 860, Caprol ET, Cremophor EL, Cremophor RH40, Solutol HS15, Labrasol, Gelucire 44/14, Tween 80 and Tween 20) were screened to evaluate their propensity to emulsify optimized oil phase. Following constraints were designated for surfactant selection on the basis of their role in final formulations (Date & Nagarsenker, Citation2007; Emad et al., Citation2010). The study was performed in triplicates and the average values were documented.
For each surfactant 10 mL of 10% w/v solution was prepared in distilled water. Previously optimized oil was added to each of these solutions with an increment of 10 μL alongwith vortexing until the system becomes cloudy (Azeem et al., Citation2009; Jia et al., Citation2009).
Each of surfactant was mixed with optimized oil phase (1:1) in separate glass vials. All these mixtures were gently heated on water bath at 50 °C in order to homogenize the components. Each of above mixture was diluted with distilled water (1000 times) in a volumetric flask. Ease of emulsification was judged by the number of flask inversions required to produce a homogenous emulsion. Further, all these samples of emulsions were allowed to stand for 2 h and their percentage transmittance (%T) were evaluated individually at 650 nm by double beam UV spectrophotometer against distilled water as blank at 244 nm. The resultant emulsions were also evaluated for their visually transparency and phase separation after 24 h storage at 25 °C temperature (Yosra et al., Citation2009; Kalhapure & Akamanchi, Citation2012).
Selection of cosurfactant (emulsification study)
Seven cosurfactants [Transcutol P, PEG 400, PG, Triacetin, Plurol Oleique CC497, Lauroglycol 90 and Capmul MCM C8] were screened for their potential to assist previously selected surfactant in terms of emulsification of respective oil phase. The screening of cosurfactant was done by following constraints on the basis of their role in final formulations. The study was performed in triplicates and the average values were documented.
A mixture of surfactant and cosurfactant (1:1) was utilized to prepare 10 mL of 10% w/v solution in distilled water. Previously optimized oil was added to each of these solutions with an increment of 10 μL alongwith vortexing until the system becomes cloudy (Yosra et al., Citation2009; Kalhapure & Akamanchi, Citation2012).
The cosurfactant was mixed with optimized surfactant and oil phases at a ratio of 1:1:2. The mixtures were further treated similar to as mentioned in surfactant optimization and parameters like ease of emulsification and %T were documented (Yosra et al., Citation2009; Kalhapure & Akamanchi, Citation2012).
Construction of ternary phase diagram
The existence of self-nanoemulsifying formulations that could emulsify under gentle agitation was identified by constructing ternary phase diagrams. Based on preliminary optimization, components like oil, surfactant and cosurfactant were utilized as apex of ternary phase diagram. A series of self-emulsifying systems (SEDDS) along with fixed amount of drug were prepared in all possible combinations (0–100%) of each component of the system. Each of the formulation (0.5 mL) was introduced into 500 mL of 0.1 M HCl in a glass beaker at 37 °C and the contents were mixed gently with a magnetic stirrer (Remi Laboratory Instruments, Mumbai, India) at a speed of 50 rpm. Further, all formulations were evaluated for their globule size and size distribution by particle size analyzer (Zetatrac, U2552, NY) (Yinghui et al., Citation2012). Ternary phase diagrams were constructed by identifying the systems with globule size <100 nm, using a demo version of Triplot® V14 software (Todd A. Thomson, Informer Technologies, California, USA) (Kallakunta et al., Citation2012).
Preparation of IRB-loaded liquid SNEDDS
All components of SNEDDS (oil, surfactant and cosurfactant) were premixed in a glass vial and warmed at 37 °C on water bath for a period of 5 min in order to obtain a homogeneous blend. Accurately weighed amount of drug was subsequently added to the respective SNEDDS composition with warming the mixtures at 50–60 °C. For all formulations, the level of drug addiction were kept constant (11.53% w/w) in order to achieve the targeted dose (75 mg IRB) in a “0” size hard gelatin capsule (HGC). Each of mixture was vortexed for further 5–10 min on vortexer and allowed to equilibrate at 25 °C temperature for a period of 48 h before evaluation (Jeoung et al., Citation2010; Nekkanti et al., Citation2010).
Optimization
The optimization of IRB-loaded SNEDDS was conducted using DoE and PCA. On the basis of ternary phase diagrams the levels of oil, surfactant and cosurfactant were decided in terms of maximum possibility of nanoemulsification. 32 full factorial design was implemented for IRB-loaded SNEDDS using concentration of oil and surfactant to cosurfactant ratio (Km) as factors (Singh et al., Citation2005). Critical responses were identified amongst all restrained evaluation parameters by PCA using a trial version of Unscrambler® 10.2 (CAMO AS, Norway, Switzerland). The data of evaluation parameters for all batches of experimental design of drug-loaded SNEDDS were utilized to construct loading plot, scoring plot, agglomerative hierarchy cluster analysis (AHCA) plot, correlation loading plot and scree plot by PCA (Ringnér, Citation2008; Garala et al., Citation2013).
32 Full factorial design for IRB-loaded SNEDDS
A three level two factor full factorial design was employed for systemic study of joint influence of the effect of independent variables [concentration of oil (X1) and surfactant to cosurfactant (Km) ratio (X2)] on critical dependent variables. The design consisted total nine runs (IRB-NE-F1 to IRB-NE-F9) () and each of them was formulated in triplicates in order to estimate reproducibility of the model. A second order quadratic model incorporating interactive and polynomial terms was used to evaluate the responses:
where, Yi was dependent variable, b0 was the arithmetic mean of nine runs and bi was estimated coefficient for factor Xi. The main effects (X1 and X2) represent average result of changing one factor at a time from its low to high value whereas the interaction term (X1X2) prompt change in responses when two factors were simultaneously altered. The polynomial terms
were included to investigate non-linearity of the model developed (Patel et al., Citation2010; Garala et al., Citation2011).
Table 1. Design layout of 32 full factorial design batches for IRB-loaded SNEDDS.
Data were further analyzed by Microsoft Excel® version 2010 (Microsoft Corporation, Washington, USA) for regression analysis. Analysis of variance (ANOVA) study was executed to assure non-significant difference between developed full model and reduced model. Contour, response surface and perturbation plots were generated to study response variations against independent variables using Statastica® 8 (StatSoft Inc., Tulsa, OK) and Design Expert® 8.0.7.1 (Stat-Ease. Inc. Minneapolis, MN) softwares. Additionally the composition of optimized (check point) batch was derived by constructing overlay plots. The percentage relative error of each response was calculated using following equation in order to judge validity of the model (Singh et al., Citation2005; Shah et al., Citation2007):
Evaluation parameters of IRB-loaded SNEDDS
Globule size and size distribution
For all the batches of IRB-loaded SNEDDS globule size and its distribution were measured immediately after diluting the preconcentrates (1000 times) with double distilled water in a volumetric flask. All samples were subjected to a brief period of sonication in order to minimize any aggregation if present using a bath sonicator (Frontline FS-4, Mumbai, India). The samples were analyzed by particle size analyzer at 25 °C with an angle of 90° (Kalhapure & Akamanchi, Citation2012). All studies were repeated in triplicates for confirmation of reproducibility.
Self-emulsification time and precipitation assessment
The emulsification time of all experimental design batches of IRB-loaded SNEDDS was assessed by USP type II (paddle type) dissolution apparatus. Each formulation (0.5 mL) was added dropwise to 500 mL of 0.1 M HCl which was maintained at 37 ± 0.5 °C. Gentle agitation to all systems was provided by a paddle rotating at 50 rpm. The self-emulsifying time was determined as the time when no particulate matter was visually detected in the dissolution apparatus. Precipitation was evaluated by visual inspection of the resultant emulsion after 24 h storage at room temperature. The formulations were then categorized as clear (transparent or transparent with bluish tinge) or non-clear (turbid), stable (no precipitation at the end of 24 h) or unstable (showing precipitation within 24 h) (Singh et al., Citation2010; Bandivadeka et al., Citation2012; Myung et al., Citation2012). All studies were repeated in triplicates.
Zeta potential (ζ)
The zeta potential (ζ) values were evaluated for all experimental design batches of IRB-loaded SNEDDS by determining the particle electrophoretic mobility using particle size analyzer. The method employed for the sample preparation was similar to that of globule size measurement. The analysis was performed in purified water (pH 5.5–6.0) adjusted to a standardized conductivity of 50 µS/cm with sodium chloride solution (0.9% w/v) in order to avoid changes in ζ values due to day-to-day variations occurring in the conductivity of water (Ping et al., Citation2008; Gupta et al., Citation2011). The mean values of ζ for three independent samples were documented.
Refractive index
The isotropicity of all experimental design batches of IRB-loaded SNEDDS (each diluted to 1000 times with distilled water) was determined by refractive index (RI) measurement. RI was measured by placing one drop of the formulation on the slide of refractometer (Bausch and Lomb Optical Company, Rochester, NY) (Jing et al., Citation2009; Yan et al., Citation2009). The study was repeated in triplicates and their mean values were documented.
Percentage transmittance
The optical clarity of all experimental design batches of IRB-loaded SNEDDS was measured spectrophotometrically in terms of %T. The optimized batch of IRB-loaded SNEDDS was diluted (1000 times) with distilled water in a stoppered volumetric flask. All these systems were allowed to stand for 2 h and their %T was evaluated at 650 nm by double beam UV spectrophotometer against distilled water as blank (Yosra et al., Citation2009; Kalhapure & Akamanchi, Citation2012). The study was repeated for three independent samples and the mean values were documented.
Percentage drug content
All the experimental design batches of IRB-loaded SNEDDS were subjected to assay analysis in order to determine their percentage drug content. Accurately weighed samples were dissolved individually in 10 mL of methanol and stirred by vortex mixer for a period of 10 min. Each of the solutions was filtered, using membrane filter (0.45 µm) and the drug content of each filtrate was estimated spectrophotometrically against blank at 244 nm (Patel & Sawant, Citation2009; Singh et al., Citation2010). The study was repeated for three independent samples in order to confirm reproducibility of the results.
In vitro drug release
The in vitro drug release study was conducted for all the experimental design batches of IRB-loaded SNEDDS against their respective pure drug using a “0” size HGC. Dissolution studies were carried out in 900 mL of 0.1 M HCl using USP type II (paddle type) dissolution testing apparatus (TDT 06P, Electrolab, Mumbai, India). The dissolution medium was continuously maintained at 37 ± 0.5 °C with a stirring speed of 50 rpm. At predetermined time intervals, 5 mL of samples were withdrawn and immediately filtered through 0.45 μm membrane filters, individually up to 90 min. Equal volume of respective fresh dissolution medium was used for the replacement of samples withdrawn. The amount of drug dissolved was determined spectrophotometrically after suitable dilution of the samples against blank at 244 nm. The study was repeated in triplicates and the average values were utilized to construct the dissolution profiles in order to confirm the reproducibility of results (Singh et al., Citation2011).
Dilution studies/robustness
Robustness of optimized IRB-loaded SNEDDS was evaluated by varying the extent of dilution (50, 100, 500 and 1000 times) along with pH of dilution media by employing different dilution medias viz; 0.1 M HCl, water, acetate buffer pH 4.5, phosphate buffer pH 6.8 and phosphate buffer pH 7.4. The effect of dilution on IRB-loaded SNEDDS was evaluated in terms of deviation in their globule sizes. All the samples of diluted SNEDDS (nanoemulsions) were stored for 24 h and observed for any signs of phase separation or drug precipitation (Céline et al., Citation2009; Dixit et al., Citation2010; Borhade et al., Citation2012). The study was repeated in triplicates to confirm reproducibility of results.
Cloud point
The optimized batch of IRB-loaded SNEDDS, cloud point temperature (Tc) was determined by visual observation of the samples after their dilution (1000 times) with distilled water. Samples were heated at a constant rate using an isothermal water bath. A close observation was made at the appearance of dispersion with an increase in temperature. The temperature at which the system became cloudy was considered as Tc. Once the temperature exceeds the Tc, sample was cooled and heated again to confirm reproducibility of the measurements in triplicates (Bandivadeka et al., Citation2012).
Thermodynamic stability
The optimized batch of SNEDDS (diluted 1000 times with distilled water) was subjected to different thermodynamic stability tests in order to assess their physical stability. All samples were evaluated in terms of phase separation at the end of analysis (Bandivadeka et al., Citation2012).
Six cycles between refrigerator temperature (2–8 °C) and 45 °C with storage at each temperature not less than 48 h were conducted.
Each of formulation was centrifuged at 10 000 rpm for a period of 10 min using a centrifuge.
Electrical conductivity
Electrical conductivity of the optimized batch of IRB-loaded SNEDDS (diluted to 1000 times with distilled water) was measured with conductometer (CM 180, Elico, Hyderabad, India) by inserting the probe in 10 mL of prepared sample in a beaker. The study was repeated thrice and their average values were documented (Mustafa et al., Citation2009).
Viscosity
The viscosity of the optimized batch of IRB-loaded SNEDDS were determined by using rheometer (Brookfield Engineering Laboratories, Inc., Middleboro, MA) with S61 spindle at 20 rpm speed and 25 °C temperature in triplicates (Azeem et al., Citation2009).
Transmission electron microscopy
The optimized batch of IRB-loaded SNEDDS was subjected to transmission electron microscope (TEM) (H-7000, Hitachi, Ibaraki, Japan) in order to estimate droplet morphology. Briefly, the IRB-loaded SNEDDS was diluted (1000 times) with distilled water and plunged for 10–15 min on a coated carbon grid stained with 2% uranyl acetate solution. The sample was subsequently washed with fresh distilled water before analysis. Radiation generated at 200 kV was utilized as X-ray source with camera length of 100 cm. Two dimensions of X-ray patterns were photographed for each sample studied (Chhabra et al., Citation2011; Singh et al., Citation2011).
Formulation and development of IRB-loaded SNETs by liquisolid compaction
Effect of drug loading
The optimized batch of liquid SNEDDS was further evaluated for their drug loading capacity by preparing a series of SNEDDS with increasing drug concentrations. Each sample was analyzed for deviation in their globule size and size distribution by particle size analyzer as mentioned earlier in section titled “Globule size and size distribution”. All diluted samples were stored at 25 °C temperature for a period of 48 h in order to observe drug precipitation (Borhade et al., Citation2012; Kalhapure & Akamanchi, Citation2012).
Selection of carrier and coating material
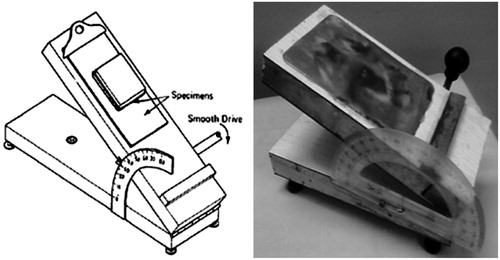
Each of suitably available excipient was subjected to the measurement of flowable liquid retention potential (Φ value) for each of optimized liquid SNEDDS constructed without addition of drug (Spireas, Citation2002; Mahmoud et al., Citation2009). Powder admixtures were prepared by mixing 5 g of either carrier or coating material with increasing quantity of liquid vehicle (SNEDDS) using a mortar and pestle. Each admixture was then placed on a shiny metal plate of an in-house developed lab device for the measurement of angle of slide. The plate was tilted till the admixture slides and the angle formed between the plate and the horizontal surface, at which admixture slides were measured as the angle of slide (θ) (). For each powder admixture the Φ value was calculated using the following equation (Hentzschel et al., Citation2012). The liquid retention potential for each of selected excipient was determined by plotting angle of slide against their Φ values:
Figure 1. In-house model for measurement of liquid retention potential.
Calculation of carrier and coating material amounts
Liquid load factor (Lf) is the mass ratio (w/w) of liquid medication to carrier powder in the liquisolid formulation. From the values of liquid retention potential of optimized carrier material (ΦCa) and coating material (ΦCo), liquid load factor (Lf) was calculated using following equations which again utilized for a further calculation of amount of carrier and coating materials:
where, Lf was the liquid load factor, Φca was the flowable retention potential of carrier material, Φ was the flowable retention potential of coating material, R was the excipient ratio (Q/q), W was the weight of liquid vehicle, Q was the weight of carrier material and q was the weight of coating material.
Preparation of drug-loaded SNETs
The drug-vehicle liquid systems were produced by mixing IRB (75 mg/tablet) to the respective optimized formulations of SNEDDS at a predetermined drug loading. To each of these liquid systems, calculated amount of optimized carrier and coating materials were added by continuous mixing in a mortar until it appears like a dry powder. In the last stage, 5% w/w sodium starch glycollate (SSG) as superdisintegrant, 2% w/w of magnesium stearate as lubricant and 1% w/w of talc as glidant were added to each of the system and mixed further. In order to ensure proper mixing of all added excipients each of powder blend was rotated in a double cone blender (Dolphin, Mumbai, India) for a period of 3–5 min. Direct compression method was adopted for preparation of drug-loaded SNETs. Each of powder blends was compacted into tablets using a rotary tablet compression machine (Mini Press-I, Rimek, India) fitted with 11 mm round, standard concave type B tooling with a compression force that provide acceptable tablet hardness. For comparison purpose conventional tablets (CT) were also prepared by the same procedure except using liquid SNEDDS (Camilla & Per, Citation2009; Hentzschel et al., Citation2012).
Solid state characterization of IRB-loaded liquisolid mixtures
Fourier transform infrared spectroscopy
Fourier transform infrared (FTIR) spectra of optimized batches of SNEDDS-loaded liquisolid mixture and pure drugs were recorded on FTIR spectrophotometer (Nicolet iS10, Thermo Fisher Scientific Inc.). For recording of spectra, ∼1 g of powder was placed on the sample holder and compressed lightly using a pressure clamp. Scanning was performed in the range of 4000–400 cm−1 (Dixit et al., Citation2010).
Differential scanning calorimetry
The samples of optimized batch of SNEDDS-loaded liquisolid mixture and pure drug were subjected to differential scanning calorimeter (DSC-60, Shimadzu Corporation, Japan) which was previously calibrated with indium standard. Sample (∼5–10 mg) was hermetically sealed in an aluminum crucible and subjected to a purging of nitrogen gas at a flow rate of 50 mL/min. The heating was done in between 30 and 300 °C temperature a rate of 10 °C/min (Srinivasan et al., Citation2011; Jun et al., Citation2012).
Powder X-ray diffraction
The crystalline nature of optimized batch of SNEDDS-loaded liquisolid mixture was determined using a powder X-ray diffractometer (PXRD; Philips X’Pert MPD, Eindhoven, Netherlands) with Cu Kα radiation (λ = 1.5406 Å) against their pure drug samples. The tube voltage and amperes were set to 45 kV and 40 mA, respectively. The samples were scanned for 2θ ranging from 5–50° at a speed of ∼0.01 2θ/s (Nekkanti et al., Citation2010; Kallakunta et al., Citation2012).
Scanning electron microscopy
The microscopic structures of optimized batch of SNEDDS adsorbed liquisolid mixture of IRB and pure drug sample were observed by scanning electron microscope (JSM-6380LV SEM and JEOL JFC-1600 Auto Fine Coater, JEOL, UK) with an acceleration voltage of 20 kV. The sample was fixed onto metal stubs using double-sided conductive tape which was previously secured on aluminum stubs and subsequently coated with gold under a vacuum before imaging. The scale bar was calibrated accurately and images were captured from different locations (Tao et al., Citation2008).
Evaluation parameters for IRB-loaded SNETs
Flowability of precompressed blends
Flow properties of ready for compression (RFC) blend of IRB-loaded SNETs was evaluated by determining angle of repose, Carr’s Index (CI) and Hausner Ratio (HR) in triplicates. Static angle of repose was measured according to the fixed funnel method. A glass funnel with end of the stem cut perpendicular to the axis of symmetry is secured with 2 cm height (H) above a graph paper on a flat horizontal surface. The RFC was carefully poured through the funnel until the apex of the conical pile so formed just reaches the tip of the funnel. The mean diameter (2R) of base of the powder cone was determined and the angle of repose was given by following equation:
The CI and HR values were calculated from the bulk and tapped densities of RFC blends. Tapped density was determined by tapping the fixed weight of each sample into a 50-mL measuring glass cylinder using a tapped density apparatus (ETD-1020, Electrolab, Mumbai, India). Following equations were utilized to calculate CI and HR values (Carr, Citation1965; Martin, Citation1993):
Physical characterization
IRB-loaded tablet formulations (both SNETs and CT) were subjected to following physical characterization tests (Banker, Citation1987; IP, Citation2010).
Randomly selected tablet from was positioned horizontally in contact with lower plunger of tablet Monsanto hardness tester (Janki Impex Pvt. Ltd., Ahmedabad, India) and zero reading was adjusted. The tablet was subsequently compressed by forcing the upper plunger until it breaks. The test was repeated in triplicates and the average value was recorded.
Randomly selected three tablets were introduced to the separate tubes of tablet disintegration test apparatus (ED-2L, Electrolab, Mumbai, India) containing 0.1 M HCl, previously maintained at 37 ± 2 °C. The time taken for complete disintegration of all tablets was documented.
Twenty tablets were selected at random and weighed individually. The individual weights were compared with the average weight for determination of percent deviation.
Accurately weighed tablets were charged in friability test apparatus (EF-2, Electrolab, Mumbai, India) for 4 min at a speed of 25 rpm. The % friability was determined in triplicates using following formula:
Reconstitution potential
A randomly selected tablet of IRB-loaded SNETs was dispersed in 10 mL of distilled water by vortex mixing, with subsequent incubation of systems for 30 min at 25 °C. Each of these sample was analyzed for deviation in their globule size, polydispersibility, ζ value, %T and emulsification time with respect to the optimized batch of IRB-loaded liquid SNEDDS (Tao et al., Citation2008). The study was repeated thrice in order to confirm reproducibility of results.
Percentage drug content
The percentage drug content of IRB-loaded SNETs was calculated by addition of a randomly selected tablet in a volumetric flask containing 100 mL methanol. The samples were mixed thoroughly and centrifuged at 5000 rpm for 10 min on a centrifuge. The supernants were suitably diluted and subjected to the estimation of drug amounts by spectrophotometric method against blank at 244 nm (Dixit et al., Citation2010). The study was repeated in triplicates and the results were documented.
In vitro drug release
Dissolution studies of IRB-loaded SNETs were accomplished to estimate its drug release patterns in 900 mL of 0.1 M HCl as dissolution medium. For comparison, respective formulations of optimized drug-loaded liquid SNEDDS, marketed tablets and conventional tablets were implemented for dissolution studies. All other test parameters were kept similar as mentioned earlier for drug-loaded SNEDDS in section titled “In vitro drug release”. Further, dissolution profiles of IRB-loaded SNETs was carried out in each of 900 mL of pH 6.8 phosphate buffer, pH 7.4 phosphate buffer and water exclusively in order to estimate the effect of physiological pH on dissolution behavior of final formulations (Mahmoud et al., Citation2009). The study was repeated in triplicates for three independent samples and their average values were utilized for constructing dissolution profiles.
In vitro pharmacokinetic study
Male Wister rats were probed to estimate pharmacokinetic behavior of drug-loaded SNETs as test against their respective marketed tablets (Avapro® 75) (Bridgewater, NJ, USA) as reference. Twenty-four rats were randomly divided into two groups (n = 12). Each rat of group I and group II was treated with test and reference formulation, respectively. Samples for group I were prepared by dispersing IRB-loaded SNETs as test and samples of group II were prepared by dispersing marketed tablets as reference individually, in 2 mL of distilled water. All these samples were administered as oral formulations at a dose of 6.75 mg/kg (Ghosh, Citation2008) in a single dose by curved gastric gavage tubes directly into the stomach. The dose volume for all administration was maintained at 5 mL/kg (Patel & Sawant, Citation2009). Serial blood samples (500 µL) were collected from retro-orbital venous plexus with hematocrit over a period of 72 h. Rats of each group were further divided into two subgroup (n = 6) for convenient blood sampling over entire study periods as recommended by the experts of IAEC (Institutional Animal Ethics Committee). Blood samples from each group were collected at predetermined time intervals alternatively from each subgroup into heparinized plastic tubes. All these samples of whole blood were kept in refrigerated cold conditions (2–8 °C) until separation of plasma. Prior to sample analysis, 100 µL of each solution was extracted using 300 µL of diethylether: dichloromethane (60:40% v/v) for protein precipitation. Further, each of the mixtures was vortexed for a period of 5 min in a vortexer with subsequent centrifugation at 10 000 rpm, for a period of 10 min at 4 °C using a centrifuge. For each sample, an aliquot of a supernatant was isolated and subjected to dryness in a vacuum drier. The residue was reconstituted in 100 µL of mobile phase [Methanol and acetonitrile (70:30% v/] and subsequently centrifuged at 10 000 rpm for 10 min at 4 °C in a centrifuge. The supernatant was finally collected and directly injected into the HPLC system (Shimadzu Corporation, LC-20AD, Tokyo, Japan) fitted with Phenomenex Luna® (Hyderabad, India) C8 column with a pore size 100 Å, length 300 mm and internal diameter (i.d.) 4.6 mm. The mobile phase was injected to the system using binary pumping mode at a flow rate of 1 mL/min. For all samples, injection volume and run time were fixed as 20 µL and 10 min, respectively (FDA, Citation2001; Li et al., Citation2005; Christel et al., Citation2006). This bio-analytical method was developed and validated in-house with linearity between 10–1000 ng/mL concentrations with high value of regression co-efficient (0.9913). The pharmacokinetic calculations were performed on the basis of plasma concentration–time data using Kinetica® version 5.1 (Thermo Scientific, Waltham, MA, USA) pharmacokinetics and pharmacodynamics software. Parameters like maximum plasma concentration (Cmax), time to reach maximum concentration (tmax), area under the plasma concentration–time curve (AUC0−∞), area under the first moment curve (AUMC0−∞), terminal half-life (t1/2), mean residence time (MRT), clearance (Cl) and half value duration (HVD) (Brahmankar & Jaiswal, Citation1987; Dixit et al., Citation2010). The relative bioavailability was calculated as the ratio of the mean oral AUC0−∞ for test formulation against the mean oral AUC0−∞ of reference formulation (Nepal et al., Citation2010; Minghui et al., Citation2011).
Stability study
The stability study of IRB-loaded SNETs (n = 6) was carried out by charging the samples in HDPE bottle with 2 g desiccant for a period of 180 days under accelerated stability conditions (40 ± 2 °C/75 ± 5% RH) in a stability chamber (Nova Instruments Pvt. Ltd., Ahmedabad, India). Parameters like physical appearance, globule size, %T, emulsification time, hardness and drug content were evaluated for each of SNET at predetermined time intervals (Nazzal et al., Citation2002).
Results and discussion
Design and development of self-nanoemulsifying drug delivery systems
Formulation and development of IRB-loaded liquid SNEDDS
Selection of SNEDDS components
Selection of oil (solubility studies)
One of the critical steps in the formulation of SNEDDS is selection of oil phase, since the oil is digested in the GI tract and may play a major role in determining rate and extent of dissolution (Lawrence & Rees, Citation2000). In the present study, selection of oil for the preparation of SNEDDS was done on the basis of their aptitude to solubilize maximum amount of respective drug. This might be attributed to the fact that in SNEDDS drug should be in its dissolved state, as this form have been reported to possess greater concentration of drug. The high concentration gradient provides driving force for the permeation of drug through GI tract (Feng et al., Citation2011). Maximum solubility of IRB (210.32 mg/g) was observed in Capryol 90 (). To observe the part of surfactants and cosurfactant in drug solubilization the solubility studies of IRB was accompanied in different surfactants and cosurfactants individually and their results are summarized in . Highest solubility for IRB was found in Acrysol K140 (284.12 mg/g). From numerous cosurfactants selected, Transcutol P exhibited highest solubility (300.28 mg/g). However, the selection of surfactant and cosurfactant for SNEDDS was not done on the basis of solubility studies since it was strongly believed that both of them play a crucial role in emulsification of oil phase. Good solubility of drug in surfactant and cosurfactant was considered as an additional advantage as this feature may prevent drug precipitation during storage (Gupta et al., Citation2011; Borhade et al., Citation2012).
Table 2. Solubility of IRB in various oils, surfactants and cosurfactants.
Selection of surfactant (emulsification study)
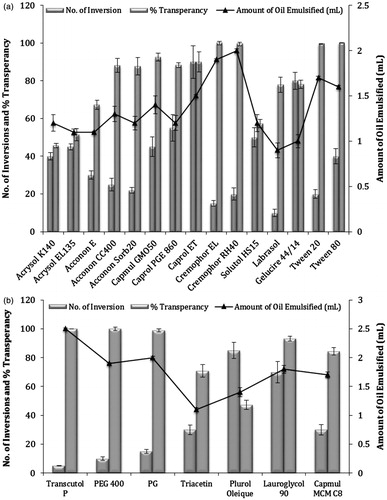
The surfactant selected must be able to lower the interfacial tension to a very small value to aid the dispersion process during the formulation of nanoemulsions. The selected surfactant should be of the appropriate lipophilic character to provide the correct curvature at the interfacial region (Lawrence & Rees, Citation2000). In the present study, non-ionic surfactants were selected since they are known to be less affected by pH change, generally regarded as safe and are biocompatible. Ionic surfactants were excluded from the study due to toxicological concerns (Shafiq et al., Citation2007). In this study, 15 different non-ionic surfactants which are usually accepted for oral ingestion were probed for emulsification of previously optimized oils (Capryol 90) (Pouton & Porter, Citation2008). The surfactant screening was done on the basis of their emulsification potential which was measured in terms of amount of oil emulsified by each surfactant. Further, it has been reported that a well-formulated SNEDDS should disperse into a nano-sized transparent emulsion within few seconds under gentle agitations. Evaluation of these characteristics of SNEDDS was done by perceiving quantitative parameters like %T and ease of emulsification (no. of flask inversions) after their subsequent emulsification in distilled water (Azeem et al., Citation2009). The data of emulsification study of Capryol 90 recommended that both grades of Cremophor (Cremophor EL and Cremophor RH40) were excellent emulsifier among all surfactants (). As per the literature, Cremophor RH40 has been utilized in one of the few marketed SEDDS products; Neoral® (St. Louis, MO, USA). Also Cremophor RH40 is a known inhibitor of P-gp and CYP3A (Chen, Citation2008). Although Cremophor EL have been also reported to possess similar bioactive effect, the use of Cremophor RH40 for oral ingestion appears more advantageous due to slightly larger polyethylene oxide content of Cremophor RH40. This additional feature of Cremophor RH40 might more effectively mask the approach of pancreatic enzymes compared to Cremophor EL (Porter et al., Citation2008). In addition to this, drug precipitation and decreased solubilization have been reported for systems with Cremophor EL on digestion and hydrolysis in vivo (Cuiné et al., Citation2007). Hence, in the present investigation Cremophor RH40 was selected as surfactant for the emulsification of IRB-loaded SNEDDS. The results of emulsification studies of other surfactants like Acrysol K140, Acrysol EL135, Acconon E, Acconon Sorb20, Acconon CC400 and Capmul GMO50 demonstrated poor emulsification potential for oil studied, even though they had very good solubility for IRB. Hence, it has been concluded that it was not necessary that surfactants with good drug solubility also provides good emulsification of the selected oil. The superior performance of Cremophor RH40 might be due to its higher affinity for oil phase (Date & Nagarsenker, Citation2007; Nepal et al., Citation2010). This observation was in line with the earlier investigations which concluded that emulsification of oil phase is influenced by the structure and chain length of the surfactant (Yosra et al., Citation2009; Emad et al., Citation2010).
Figure 2. Emulsification study of Capryol 90 for (a) surfactant selection and (b) for cosurfactant selection, error bars represents SD (n = 3).
Selection of cosurfactant (emulsification study)
The incorporation of suitable cosurfactant lowers the interfacial tension, fluidizes the hydrocarbon region of interfacial film and decreases the bending stress of interface which ultimately results into the improvement in spontaneity of emulsification, reduction in globule size and polydispersity (Nepal et al., Citation2010; Parmar et al., Citation2011). In view of these, seven cosurfactants were mixed individually with previously optimized surfactant phase (Cremophor RH40) at a fixed (1:1) surfactant: cosurfactant (Km) ratio. Hydrophilic cosurfactants (Transcutol P, PEG 400, PG and Capmul MCMC8) exploited better emulsification of selected oil phases in comparison to the lipophilic cosurfactants (Plurol oleique CC 497, Lauroglycol 90 and Triacetin) (Gupta et al., Citation2011). The data clearly illustrated that selected oil phase (Capryol 90) undergone highest emulsification with Transcutol P as cosurfactant (). Further, the system exploited relatively higher values of %T and ease of emulsification as compared to their respective systems with surfactant alone. This explained importance of cosurfactant addition to SNEDDS. Moreover, as depicted in the result of solubility studies for cosurfactant, IRB revealed excellent solubility in Transcutol P which was considered to be an added advantage in terms of providing higher drug loading to the final formulations (Borhade et al., Citation2012). Hence, for all further trials, Transcutol P was selected as cosurfactant for IRB.
Construction of ternary phase diagram
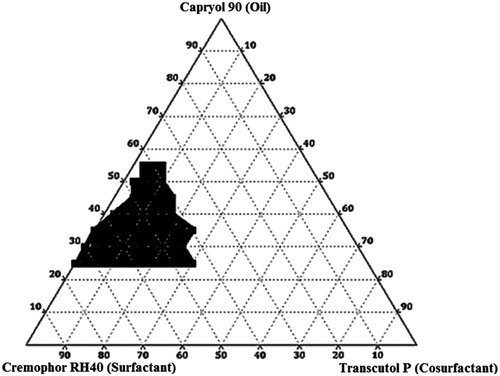
On the basis of preliminary trials Capryol 90 – Cremophor RH40 – Transcutol P was selected as three component system for preparation of IRB-loaded SNEDDS and the phase diagram IRB-loaded samples have been illustrated in . The shaded areas illustrate nanoemulsification regions alongwith with highest probability to form nanoemulsions of <100 nm globule size whereas the part surrounding this areas illustrate formulations with poor emulsion forming ability with higher globule size (Singh et al., Citation2010). It has been reported that the drug substances incorporated in SNEDDS effect the performance of SNEDDS (Xuemei et al., Citation2011). Thus, the construction of ternary phase diagram was done in presence of IRB (Jeoung et al., Citation2010). Due to low aqueous solubility of IRB the drug molecules were likely to orient at the interface of resulting nanoemulsions. This may be attributed to drug influenced interaction of surfactant and cosurfactant with selected oil (Patel & Sawant, Citation2009). For IRB-loaded SNEDDS, maximum solubilized oil amount was 55% w/w, in addition to minimum surfactant requirement as 45% w/w. It was noteworthy that the ternary phase diagram for SNEDDS formulated without cosurfactant were difficult to emulsify which signified the importance of cosurfactant in the formulations (Yosra et al., Citation2009). Further, the effect of individual components such as oil, surfactant and cosurfactant have been summarized as follows.
Effect of Concentration of Oil: The results recommended greater probabilities of nanoemulsification of IRB-loaded SNEDDS at intermediate concentrations of oil. In order to estimate effect of concentration of oil, globule size of diluted formulations constructed without cosurfactant were plotted against the oil concentrations The data illustrated an increase in globule size from 43.54–97.43 nm at 25–55% w/w of Capryol 90. A remarkable increase in globule size above and below this concentration range was observed. The increase in globule size above these concentration ranges could be explained by relative decrease in surfactant amount which may had resulted into coalescence of oil globules and loss of emulsification potential of systems (Azeem et al., Citation2009). There was an increase in globule size below these concentration ranges which might be attributed to loss of solubilization capacity of formulation at lower levels of oil.
Effect of Surfactant Concentration: The effect of surfactant concentrations on drug-loaded SNEDDS was estimated by plotting globule size of SEDDS formulations constructed without cosurfactants with different amounts of surfactants. The efficiency of nanoemulsification was excellent when concentration of surfactants was >45% for IRB-loaded SNEDDS. Relative increase in globule size below these concentrations could be justified by the inability of surfactants to emulsify the amount of oil present. Further, with increasing the surfactant concentration spontaneity of systems was increased. There was a linear decrease in the globule size with increase in surfactant concentrations from 45–75% w/w. This could be explained by the fact that more amount of surfactant would stabilize the oil–water interface more and thus minimize the globule size (Azeem et al., Citation2009). Moreover, above the surfactant concentration of 75% w/w, there was a remarkable increase in globule size. This might be attributed to the excess penetration of water into bulk oil causing massive interfacial disruption and ejection of globules from aqueous phase. The increase in globule size could further explained in terms of possible condensation phenomenon and multi-layer formation of additional surfactant molecules.
Effect of Cosurfactant Concentration: The effect of cosurfactant concentration on drug-loaded SNEDDS was estimated by plotting globule size of diluted SEDDS formulations containing different amounts of cosurfactants at fixed concentration of oil (25% w/w). It was observed that with increasing the concentration of cosurfactant the spontaneity of the self-emulsification of SNEDDS was increased. This might be attributed to a relative decrease in viscosity of the SNEDDS as Transcutol P had very low viscosity than their respective surfactant counterparts (Cremophor RH40). With increase in cosurfactant concentration reduction in globule sizes were observed. This could be explained by the ability of Transcutol P as cosurfactant to lower the interfacial tension between the oil and water interface and increase flexibility of interface around oil globules (Lawrence & Rees, Citation2000). However, there was an increase in globule size at an excess amount of cosurfactant (>30% w/w). This might be credited to the fact that at high concentrations, cosurfactant not only stay into the interfacial film but also enter into the inner oil phase, leading to the expansion of interfacial film and increase in globule size (Azeem et al., Citation2009).
Figure 3. Ternary phase diagram for IRB-loaded SNEDDS.
Optimization
In order to ascertain the optimum formulation, it is necessary to evaluate the effect of formulation parameters and their interactions on the properties of the final product. Design of an immaculate SNEDDS requires rational blends of diversely behaving oils, surfactants and cosurfactants which cannot be achieved using a traditional OVAT approach. Systematic optimization of such isotropic delivery systems using DoE on the other hand offers numerous advantages including high degree of precision and prognosis alongwith economic advantages (Singh et al., Citation2005; Yan et al., Citation2009; Garala et al., Citation2011). In addition to this, multivariate approach by using PCA is a mathematical algorithm that reduces the dimensionality of the data while retaining most of the variation in the data set (Rajalahti & Kvalheim, Citation2011). It allows the results to be simplified into latent variables (principal components) that explain the main variance in the data (Haware et al., Citation2009) alongwith using fewer components (Ringnér, Citation2008; Garala et al., Citation2013). Thus, the present study was persisted with 32 full factorial design for IRB-loaded SNEDDS with concentration of oil and surfactant: cosurfactant ratio (Km) as two crucial factors followed by PCA in order to scrutinize critical responses among all parameters studied.
32 Full factorial design for IRB-loaded SNEDDS
There are numerous research work related to SNEDDS in which surfactant to cosurfactant (Km) ratio exerted major effect on globule size (Kalhapure & Akamanchi, Citation2012). Hence, apart from applying three factor design the present study involved only two factors as X1 – concentration of oil and X2 – surfactant: cosurfactant ratio at three levels each (Mezghrani et al., Citation2011). The actual values of each of selected factor has been summarized against their respective coded values in . The results of responses like globule size, emulsification time (ET), polydispersibility index (PI), zeta potential (ζ), RI, %T and % drug content for experimental design batches of IRB-loaded SNEDDS have been summarized in .
Table 3. Responses of 32 full factorial design for optimization of IRB-loaded SNEDDS.
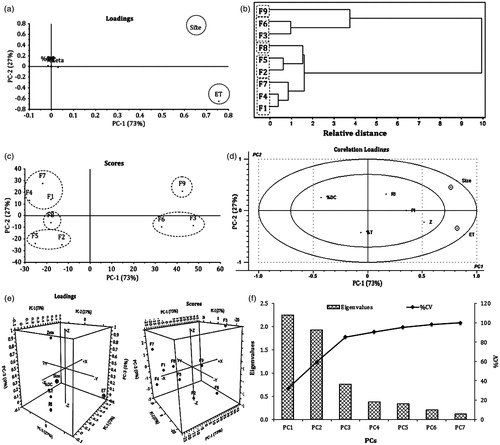
The loading plot () depicts that PC1 was responsible for 73% of the total variance in the data set and PC2 was responsible for a further 27%. The results of all nine batches were further treated with agglomerative hierarchy cluster analysis (AHCA) and its graphical display is shown in as dendrogram. The results of dendrogram demonstrated clustering of the formulations into five major groups; group I (F9), group II (F3 and F6), group III (F8), group IV (F2 and F5) and group V (F1, F4 and F7). Further, all the five groups were found to be relatively distant and substantially different from one another. Clusters of all formulations were correlated by PCA score plot in a similar way (). Correlation loading plot was constructed to decide most important variables for further optimization. The results scrutinized globule size and emulsification time as two critical responses on the basis of their retention between two eclipses (). Further, both of these responses were plotted on the same side of PC1 which suggested positive correlation between them. This result implies that if the globule size of SNEDDS is improved, the emulsification time would also increase. Moreover, all other variables were plotted on correlation loading plot near to origin and hence, they were not discussed. As displayed in 3D plots () the third principal component (PC3), had no additional variation in the data, against PC1 and PC2 and hence it was not considered for further studies. The scree plot for IRB-loaded SNEDDS () illustrates that the eigenvalues for each component were in descending order. The plot analysis depicted that the rate of decline tends to be fast first and then levels off with one large gap/break in the data between components 1 and 2 which indicated significance of first two components (PC1 and PC2). All other components (PC3 to PC7) which appeared after the break were assumed to be trivial and hence removed from the study. This separation was further supported by the calculation of %CV for all components. The data for %CV of PC3 to PC7 account for almost 100% variation which justified removal of these terms (Zhu & Ghodsi, Citation2006; Garala et al., Citation2013). At the end, it was speculated that globule size and emulsification time were most important variables in the preparation of IRB-loaded SNEDDS and hence, they were further selected for the optimization.
Figure 4. PCA study showing (a) loading plot, (b) dendrogram, (c) scoring plot, (d) correlation loading plot (e) 3D Loading and score plot and (f) scree plot for IRB-loaded SNEDDS.
For all 9 batches both selected dependent variables, globule size (Y1) and emulsification time (Y2) exhibited wide variations from 20.12 to 98.21 nm and 14.30 to 90.12 s, respectively (). The data clearly indicate strong influence of selected factors (X1 and X2) on both responses (Y1 and Y2). A stepwise multivariate linear regression was performed to evaluate the observations. The equations representing the quantitative effect of the formulation variables on the measured responses are shown below:
The fitted polynomial equations (full and reduced model) relating the responses to the transformed factors are shown in the following . For globule size (Y1) coefficient b12 whereas for emulsification time (Y2) coefficient b22 were found to be insignificant (p > 0.05) and hence, these terms were separated from their respective full model in order to develop reduced model (Singh et al., Citation2005; Shah et al., Citation2007). The removal of insignificant terms was further justified by executing ANOVA test (). The high value of correlation coefficients for globule size (Y1) and saturation solubility (Y2) illustrates goodness of fit. The critical value of F for Y1 and Y2 were found to be 10.13 (df = 1, 3). For both responses, calculated F values [2.94 (Y1), 0.4662 (Y2)] were less than their respective critical values which supported non-significant difference between full and reduced model. The final reduced model equations for both responses could be summarized as follows:
The data of all the nine batches of experimental design were used to generate interpolated values with the assistance of response surface, contour and perturbation plots (Mennini et al., Citation2012).
Table 4. Regression analysis of 32 full factorial design batches of IRB-loaded SNEDDS.
Table 5. Results of ANOVA study for IRB-loaded SNEDDS.
A lowest globule size of 20.12 nm was observed with Batch IRB-NE-F5. The results of response surface, contour and perturbation plots are illustrated in . A relative decrease in globule size with decrease in oil concentration could be explained by the increase in relative concentration of surfactants which can emulsify the oil phase more easily and hence, minimize globule size of system. Further, the increase in globule size at low levels of Km might be attributed to lower levels of surfactants which were not able to emulsify the oil phase whereas, at high values of Km increase in globule size might be due to a relative decrease in cosurfactant concentration. The role of cosurfactants in minimizing globule size has already been explained earlier (Date & Nagarsenker, Citation2007; Jun et al., Citation2012).
Figure 5. Influence of formulation factors of IRB-loaded SNEDDS by response surface plot for (a) Y1 and (b) Y2; Contour plot for (c) Y1 and (d) Y2; Perturbation plot for (e) Y1 and (f) Y2.
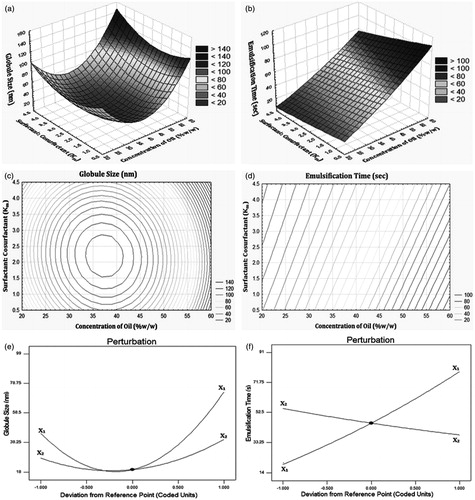
A lowest emulsification time of 14.30 s was observed with Batch IRB-NE-F7. The results of response surface, contour and perturbation plots are illustrated in . A relative increase in emulsification time with increase in oil concentration could be explained by unavailability of emulsifier for emulsification of increased oil amount. Further, the values of emulsification time were favorable only at intermediate levels of Km. This could be attributed to at low levels of Km there was a lower amount of surfactant present in the formulation which might had produced poor emulsification of oil whereas at high levels of Km the insufficient amount of cosurfactant in the system might be the reason for increase in emulsification time (Date & Nagarsenker, Citation2007; Azeem et al., Citation2009).
Criterias for selection of optimized batch were arbitrarily selected as minimum globule size and minimum emulsification time. Check point/optimized batch of IRB-loaded SNEDDS was prepared practically according to the levels of factors illustrated in (Shah et al., Citation2007). The results depicted non-significant (p > 0.05) difference and lower percent relative error between experimentally obtained and theoretically computed data of globule size and emulsification time which suggested suitability of design applied (Singh et al., Citation2005).
Table 6. Formulation composition and results of check point batch for IRB-loaded SNEDDS.
Evaluation parameters of IRB-loaded SNEDDS
Globule size and size distribution
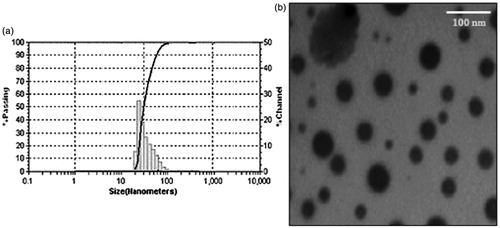
The nano size of drug molecules is considered to be an ideal form for the enhancement of oral absorption (Bandyopadhyay et al., Citation2012). Globule size of drug-loaded SNEDDS for all experimental design batches was probed as one of the crucial response in course of optimization and their values are summarized in . The globule size of the optimized batch of IRB-loaded SNEDDS was found to be 23.94 nm which confirmed nanometer size of developed formulation (). The estimation of globule size distribution for SNEDDS was done in terms of polydispersibility index (PI) (Peng et al., Citation2011; Toshiyuki et al., Citation2011) and their values are exemplified in . However, this parameter was not included as a crucial response during the optimization which could be attributed to non-significant difference in their values with respect to the factors selected. The PI of the optimized batch of IRB-loaded SNEDDS was found to be 0.12 which illustrated narrow size distribution of systems (Villar et al., Citation2012).
Figure 6. (a) Globule size analysis and (b) TEM photomicrograph for the optimized batch of IRB-loaded SNEDDS.
Self-emulsification and precipitation assessment
The rate of emulsification is an important parameter for the assessment of spontaneity of emulsification for the systems. The SNEDDS should disperse completely and quickly when subjected to aqueous dilution under mild agitation of GI tract. Emulsification time of drug-loaded SNEDDS for experimental design batches was probed as one of the crucial response in course of optimization and their values are summarized in . All experimental design batches of IRB-loaded SNEDDS exhibited a rapid rate of emulsification (<2 min). The emulsification time of the optimized batch of IRB-loaded SNEDDS was found to be 28.9 s, which portrayed spontaneity of system. In addition to this, none of the system had resulted into formation of precipitates at the end of 24 h which rendered stability of formulations (Parmar et al., Citation2011; Xuemei et al., Citation2011).
Zeta potential (ζ)
It is necessary to assess ζ values of IRB-loaded SNEDDS in order to identify the charge of oil globules (Gupta et al., Citation2011). Zeta values of all experimental design batches of IRB-loaded SNEDDS are summarized in . However, similar to PI this parameter was also not incorporated as a critical response during the course of optimization. The positive values of ζ for all batches were solely attributed to the presence of free fatty acids in the oil phase of SNEDDS since both surfactant and cosurfactant used were non-ionic in nature (Ping et al., Citation2008; Bandivadeka et al., Citation2012). The ζ value of the optimized batch of IRB-loaded SNEDDS was found to be 2.37 mV. This might results into enhanced interaction of drug-loaded oil globules with the negative surface of gastric mucosa and facilitate drug absorption in vivo (Gershanik & Benita, Citation2000).
Refractive index
RI, being an optical property is used to characterize the isotropic nature of nanoemulsion which is to be produce form SNEDDS. The results of RI for all batches of experimental design for IRB-loaded SNEDDS () confirmed isotropic nature of the systems even after their transformation to nanoemulsions (Gupta et al., Citation2011; Parveen et al., Citation2011). The RI values of all formulations were in the range of 1.45–1.60. The RI value of the optimized batch of IRB-loaded SNEDDS was found to be 1.47.
Percentage transmittance
In order to characterize isotropic nature of SNEDDS, transmittance study was conducted and the results of %T for all batches have been summarized in . The data illustrated nearly 100% transmittance for all batches (Yosra et al., Citation2009; Kalhapure & Akamanchi, Citation2012). The %T value of the optimized batch of IRB-loaded SNEDDS was found to be 100.03.
Percentage drug content
The percentage drug contents of all batches of experimental design are summarized in . The values of percent drug content were almost 100% alongwith very low standard deviations, suggested uniform dispersion of drug in developed formulations (Patel & Sawant, Citation2009). The value of percent drug content for the optimized batch of IRB-loaded SNEDDS was found to be 100.02.
In vitro drug release
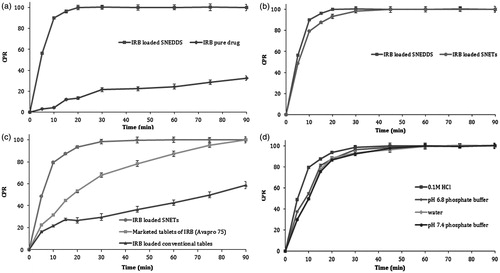
All experimental design batches of IRB-loaded SNEDDS exemplified significant enhancement in the dissolution rate as compared to pure IRB. The dissolution pattern of the optimized batch of IRB-loaded SNEDDS released 96.43% of IRB within 15 min compared to only 12.2% for pure IRB (). The increase in dissolution velocity of drug-loaded SNEDDS could be attributed to reduction in particle size, increase in surface area and decrease in diffusion distance (Noyes & Whitney, Citation1987; Lawrence & Rees, Citation2000; Venkatesh et al., Citation2010).
Figure 7. Comparison of in vitro dissolution profiles of (a) IRB-loaded SNEDDS and pure IRB in 0.1 M HCl; (b) IRB-loaded SNEDDS and IRB-loaded SNEDDS in 0.1 M HCl; (c) IRB-loaded SNETs in 0.1 M HCl, marketed tablets of IRB and conventional tablets in 0.1 M HCl and (d) IRB-loaded SNETs in at various physiological pH, error bar represents SD (n = 3).
Dilution studies/robustness
It is important to ensure that uniform nanoemulsions are formed upon self-emulsification of SNEDDS at different dilution conditions (Gupta et al., Citation2011). In a view of this, the effect of extent of dilution and pH of dilution media on optimized batch of drug-loaded SNEDDS was evaluated and the results are summarized in . All the diluted systems exhibited a globule size of <50 nm irrespective of pH and volume of dilution medium. Furthermore, the optimized system was considered to be robust against dilution as it did not show any signs of phase separation and drug precipitation even after 24 h of storage (Bandivadeka et al., Citation2012).
Table 7. Robustness to dilution for optimized batches of IRB-loaded SNEDDS.
Cloud point
The Tc is a critical parameter especially for non-ionic surfactants containing SNEDDS in terms of their stability. When the temperature of the system is higher than its cloud point, an irreversible phase separation occurs. Hence, the Tc for SNEDDS should be >37 °C, in order to avoid phase separation of formulations in GI tract. The Tc of the optimized batch of IRB-loaded SNEDDS was found to be 67.5 °C which revealed stability of system at physiological temperature in vivo (Ping et al., Citation2008; Kallakunta et al., Citation2012).
Thermodynamic stability
The objective of thermodynamic stability study was to evaluate the phase separation and effect of temperature variation on developed SNEDDS in order to exclude the possibility of metastable formulations. The study revealed excellent stability of optimized batch of IRB-loaded SNEDDS with no signs of phase separation or precipitation at various stress conditions studied (Shafiq et al., Citation2007; Azeem et al., Citation2009).
Electrical conductivity
The electrical conductivity of optimized batch of IRB-loaded SNEDDS was carried out to estimate the type of nanoemulsion, formed upon dilution. The value of conductivity was found to be 346.65 μS/cm for IRB-loaded systems which proposed O/W type formulations (Parveen et al., Citation2011).
Viscosity
The viscosity of SNEDDS is crucial in terms of their ability for filling in capsules. There are reports indicating that SNEDDS having lower viscosity tend to form o/w type of nanoemulsion system and follow Newtonian type of flow behavior. The viscosity of the undiluted optimized batch of IRB-loaded SNEDDS was found to be 287.43 cps at 25 °C. This value implied that the developed SNEDDS can be filled in capsules by commercial liquid filling equipments and it may produce an O/W type of nanoemulsion in vivo (Bandyopadhyay et al., Citation2012).
Transmission electron microscopy
Morphological and structural examination of the optimized batches of IRB-loaded SNEDDS was carried out using transmission electron microscope. TEM images illustrated formation of spherical micelles with size range of 10–50 nm (). These results were in accordance to that of globule size analysis (Jia et al., Citation2009; Emad et al., Citation2010).
Formulation and development of drug-loaded solid SNEDDS –SNETs by liquisolid compaction
Considering significant drawbacks of liquid SNEDDS such as high production costs, incompatibilities of drug with capsule material, low drug stability, drugs leakage and capsule ageing the present study was forwarded in form of S-SNEDDS. With an aim of providing highest degree of patient compliance the optimized batch of drug-loaded SNEDDS was transformed into SNETs by liquisolid compaction technique (Nazzal et al., Citation2002; Myung et al., Citation2012).
Effect of drug loading
With respect to lower drug loading of liquid SNEDDS, it was not possible to convert the optimized batch directly into SNETs since it exceeds the patient acceptability in terms of size of dosage form. Hence in the first part, optimized batch of SNEDDS was further evaluated for its drug loading capacity. Drug incorporation, especially for highly hydrophobic drug like IRB, necessities prime consideration to its influence on globule size of systems. There was a linear increase in globule size with increase in drug loading (Venkatesh et al., Citation2010). The data revealed a drastic increase in globule size and PI values after 25% w/w drug loading for IRB. All IRB-loaded SNEDDS formulations with ≤25% w/w drug loading for IRB depicted a globule size <100 nm with no signs of precipitation even after 24 h storage at 25 °C (Kumar & Mittal, Citation1999). Hence, the maximum drug loading capacity for optimized batches of IRB-loaded SNEDDS was designated as 25% w/w for all further trials.
Selection of carrier and coating material
Each material has a specific liquid retention potential (Φ) value and in the present study it was determined by plotting their Φ values against respective angle of slide for optimized formulation of liquid SNEDDS. The Φ value of a powder admixture is the maximum amount of a given non-volatile liquid that can be retained inside powder bulk (w/w) while maintaining acceptable flowability. The Φ value which corresponded to an angle of slide of 33° was reported to represent the flowable liquid retention potentials (Φ) of material (Nazzal et al., Citation2002; Mahmoud et al., Citation2009). The material with maximum Φ value was selected as carrier and coating substances (Akinlade et al., Citation2010; Elkordy et al., Citation2012). The solvent system selected was comprised of drug free optimized liquid SNEDDS which was previously optimized (31.62% w/w of Capryol 90, 49.9% w/w of Cremophor RH40 and 18.48% w/w of Transcutol P). The results demonstrated suitability of Neusilin US2 as carrier and Aerosil 200 as coating materials among all materials studied (). This might be attributed the larger surface area of Neusilin US2 and Aerosil 200 compared to the other materials (Myung et al., Citation2012).
Table 8. Liquid retention potential of carrier and coating material.
Preparation of drug-loaded SNETs
The major concern for liquisolid system is the requirement of higher amount of carrier and coating material for solidification of drug-loaded vehicle phase, which ultimately increase the total size of final formulation and results into patient non-compliance. In the present investigation, this issue was successfully resolved by selecting a SNEDDS with highest drug loading capacity (25% w/w) alongwith best suitable carrier and coating materials which had highest liquid retention potential for SNEDDS. All the batches of IRB-loaded SNETs were composed of 5% w/w SSG as disintegrant, 2% w/w of magnesium stearate as lubricant and 1% w/w of talc as glidant.
Solid state characterization of IRB-loaded liquisolid mixtures
Fourier transform infrared spectroscopy
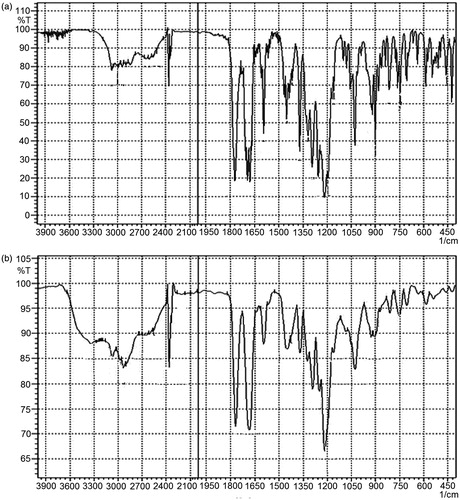
FTIR study was conducted to characterize any possible interaction between drug and excipients utilized. The spectra of pure drug illustrated all characteristic peaks according to the functional groups present in its chemical structure. On comparing the spectra of pure drug with SNEDDS-loaded liquisolid mixtures, all major drug characteristic peaks were observed with broadening (). This might be attributed to possible hydrogen bonding formation between excipients and drug molecules.
Figure 8. FTIR Spectras of (a) IRB and (b) SNEDDS-loaded liquisolid mixture of IRB.
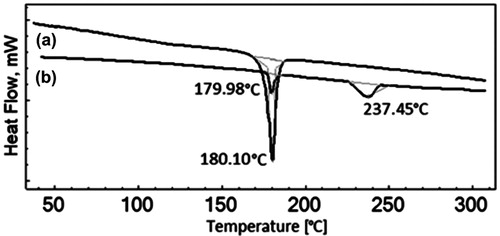
Differential scanning calorimetry
DSC thermograms for SNEDDS-loaded liquisolid mixture and pure drug have been summarized in . The pure drug samples of IRB had sharp endothermic peak at 180.3 °C which corresponded to its melting point. SNEDDS-loaded liquisolid mixtures illustrated reduction in the magnitude of endothermic peak which was an indicative of conversion of IRB to its amorphous forms. This might be due to presence of drug molecules in a molecularly dissolved state in SNEDDS formulations. Additionally, the DSC thermograms of SNEDDS-loaded liquisolid mixture for illustrated minor endothermic peak near 237 °C which might be attributed to the presence of neusilin US2 in the systems (). These results were in line with other reports of solid state conversion of SNEDDS (Tao et al., Citation2008; Jun et al., Citation2012; Kallakunta et al., Citation2012).
Figure 9. DSC thermograms of (a) IRB and (b) SNEDDS-loaded liquisolid mixture of IRB.
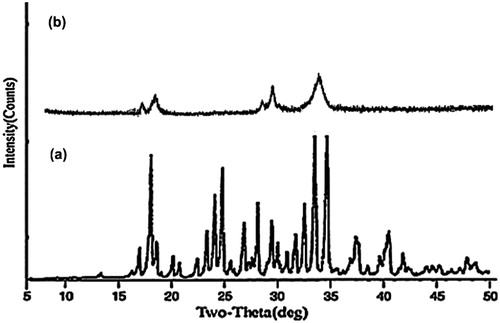
Powder X-ray diffraction
The results of PXRD of SNEDDS-loaded liquisolid mixture and pure drug samples have been summarized in . The X-Ray patterns of pure IRB sample displayed presence of numerous distinct peaks at 5.54°, 10.22°, 11.82°, 14.18°, 17.24°, 22.16° and 27.48° which suggested highly crystalline nature of IRB. However, PXRD patterns of SNEDDS-loaded liquisolid mixtures were characterized by diffuse spectra and reduction of characteristic drug peaks. These results recommended reduction of crystallinity in SNEDDS samples similar to that of DSC. The results of PXRD studies were in line with other reports on solid SNEDDS (Nekkanti et al., Citation2010; Kallakunta et al., Citation2012).
Figure 10. PXRD patterns of (a) IRB (b) SNEDDS-loaded liquisolid mixture of IRB.
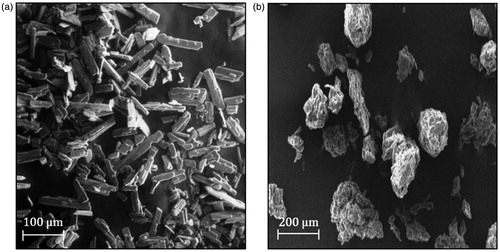
Scanning electron microscopy
The scanning electron microscopy (SEM) images of liquisolid mixtures loaded with optimized SNEDDS and pure drug are summarized in . The surfaces of liquisolid mixtures were appeared as rough with adsorption of liquid SNEDDS (Myung et al., Citation2012). In comparison, pure drug powder illustrated irregular shaped, flat crystals. From the SEM observation, it was confirmed that the optimized batch of liquid SNEDDS had effectively retained in the micropores of carrier and coating materials as well as surface of the porous carriers (Srinivasan et al., Citation2011).
Figure 11. SEM photographs of (a) IRB (b) SNEDDS-loaded liquisolid mixture of IRB.
Evaluation parameters for drug-loaded SNETs
Flowability of precompressed blends
The present study involved direct compression as a method for preparing drug-loaded SNETs and hence, good flow property of the blend before compression was a prerequisite criterion. The results of flowability study of ready for compression blends of IRB-loaded SNETs have been illustrated in which revealed excellent flowability (Carr, Citation1965; Martin, Citation1993).
Table 9. Characterizations of drug-loaded SNETs with respect to conventional tablets.
Physical characterization
The results of all physical characterization tests have been summarized in . The data revealed that all batches of prepared tablets complied with the pharmacopoeial specifications (IP, Citation2010). The lower values of hardness and higher values of friability for SNETs as compared to their conventional tablets could be justified by the presence of liquid SNEDDS. Liquisolid formulations with higher R value (carrier to coat ratio) exhibits higher hardness and compactness compared to the one with low R value. This might be attributed to the higher amount of carrier material may leads to plastic deformation of powder admixtures and formation of more hydrogen bonding between its molecules. However, in the present investigation the R value has to be fixed at 20 since increasing R values were resulting in a relative increase in total weight of dosage form (Elkordy et al., Citation2012).
Reconstitution potential
IRB-loaded SNETs formulations should disperse quickly and completely when subjected to aqueous environment under mild agitation (Tao et al., Citation2008; Mahmoud et al., Citation2009). The results of reconstitution potential of IRB-loaded SNETs have been summarized in . The data illustrated non-significant difference between all the parameters evaluated as compared to that of the optimized batch of IRB-loaded SNEDDS. The optimized batch exhibited reasonable homogeneity with no significant differences in globule sizes. This suggested capability of lipid components of SNETs to retain its emulsification properties irrespective of change in physical form (Kallakunta et al., Citation2012).
Table 10. Reconstitution potential of optimized batch of SNETs with respect to optimized batch of SNEDDS.
Percentage drug content
The values of percent drug content were almost 100% alongwith very low standard deviations, suggested uniform dispersion of drug in developed formulations. The value of % drug content for the optimized batch of IRB-loaded SNETs was found to be 98.45.
In vitro drug release
IRB-loaded SNETs revealed slightly lower rate of dissolution as compared to the optimized batch of IRB-loaded liquid SNEDDS (). This might be attributed to higher drug loading of SNETs formulation as well as effect type of dosage form (compressed tablets). The results of comparison of in vitro drug release for IRB-loaded SNETs, with marketed tablets (Avapro® 75) and conventional tablets have been illustrated in . The batches of IRB-loaded SNETs resulted into remarkable improvement in dissolution rate as compared to other two formulations (marketed tablets and conventional tablets) which again could be attributed to decrease in particle size and decrease in drug crystallinity. Further, for the optimized batch of IRB-loaded SNETs dissolution profiles have been summarized in various dissolution media composed with different pH in order to prove the robustness of dissolution enhancement of the developed formulation (). The results suggested that IRB-loaded SNETs exhibited slightly higher rate of dissolution in 0.1 M HCl as dissolution media as compared to the other three dissolution media. This might be attributed to the fact that IRB possess a pH-dependent release pattern with highest solubility at acidic pH (Cagigal et al., Citation2001). However, there was no significant difference in the dissolution profiles of all four media.
Stability study
Stability studies of the IRB-loaded SNETs were carried out as per the ICH guidelines at 40 ± 2 °C and 75 ± 5% RH for a period of 6 months. The results illustrated no significant change in all parameters evaluated at predetermined time intervals compared to the samples which have been stored initially (). This proposed stability of the final dosage forms (drug-loaded SNETs) for atleast 6 months under the accelerated storage conditions (Nazzal et al., Citation2002; Yinghui et al., Citation2012).
Table 11. Results of accelerated stability study for IRB-loaded SNETs.
In vivo pharmacokinetic study
The plasma concentrations-time profiles of IRB-loaded SNETs and their marketed tablets are summarized in . The absorption profile of IRB-loaded SNETs was higher than that of marketed tablets at each time point which might be attributed to very low aqueous solubility and poor dissolution properties of IRB in its pure form. The peak plasma concentrations (Cmax) of IRB after oral administration of IRB-loaded SNETs (734.95 ± 142.16 ng/mL) was 2.53-fold higher than that of marketed tablets (290.25 ± 95.1 ng/mL). The time of occurrence of the highest concentration (tmax) were found to be 1.62 ± 0.21 h for IRB-loaded SNETs which was much faster as compared to their respective marketed tablets (2.01 ± 0.25 h). Similarly, values of AUC0−∞, in rats treated with IRB-loaded SNETs (8336.89 ± 1032.16 ngh/mL) was 1.78-fold higher than that of their marketed tablets comprising pure drug (4666.38 ± 680.35 ngh/mL). The developed IRB-loaded SNETs formulations exhibited lower values of MRT, clearance, t1/2 and HVD compared to that of marketed tablets (data not shown). Hence, as compared with marketed tablets comprising pure drug, developed IRB-loaded SNETs were more effective to improve rate and extent of oral absorption of IRB. This could be explained by the potential of SNEDDS to deliver drug molecules in nanometer size with a simultaneous increase in surface area for oral absorption. These findings were consistent with results from dissolution study advocating that the differences in absorption were primarily attributed to the dissolution behavior of drug with different particle sizes.
Figure 12. Comparison of in vivo pharmacokinetic profiles of (a) IRB-loaded SNETs and (b) marketed tablets of IRB (Avapro 75), error bar represents SD (n = 6).
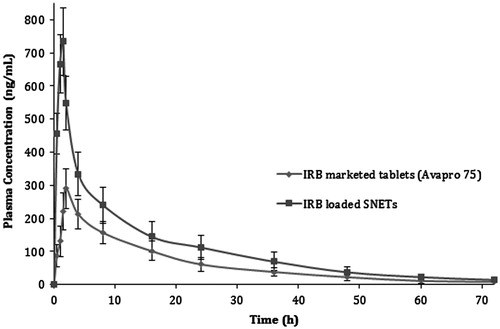
Conclusions
The results designated successive utilization of SNEDDS as a vehicle for oral drug delivery of IRB. The in vitro and in vivo enhancement by developed nanosized dosage forms is attributed to reduction in size of drug molecules and increase in effective surface area. The selected approach illustrated efficacious conversion of optimized formulation into most patient compliable solid oral dosage forms, tablets which suggests productive amalgamation of novel drug delivery systems with the conventional dosage form. The developed formulations exhibited a significant improvement in the results of both in vitro and in vivo studies as compared to their marketed tablets (Avapro® 75). However, the developed formulation further requires extensive clinical trials before commercialization for human use.
Declaration of interest
The authors report no conflicts of interest. The authors alone are responsible for the content and writing of this article.
Acknowledgements
We would like to thank Torrent Research Center for providing gift sample of IRB.
References
- Akinlade B, Elkordy AA, Essa EA, Elhagar S. (2010). Liquisolid systems to improve the dissolution of furosemide. Sci Pharm 78:325–44
- Azeem A, Rizwan M, Ahmad FJ, et al. (2009). Nanoemulsion components screening and selection: a technical note. AAPS PharmSciTech 10:69–76
- Balakrishnan P, Lee B, Hoon DO, et al. (2009). Enhanced oral bioavailability of dexibuprofen by a novel solid self-emulsifying drug delivery system (SEDDS). Eur J Pharm Biopharm 72:539–45
- Bandivadeka MM, Pancholi SS, Kaul-Ghanekar R, et al. (2012). Self-microemulsifying smaller molecular volume oil (Capmul MCM) using non-ionic surfactants: a delivery system for poorly water-soluble drug. Drug Dev Ind Pharm 38:883–92
- Bandyopadhyay S, Katare OP, Singh B. (2012). Optimized self nano-emulsifying systems of ezetimibe with enhanced bioavailability potential using long chain and medium chain triglycerides. Colloids Surf B 100:50–61
- Banker GS. (1987). Tablets. In: Lachman L, Liberman HA, eds. The theory and practice of industrial pharmacy, 3rd ed. Mumbai, India: Varghese Publishing House, 293–345
- Borhade V, Pathak S, Sharma S, Patravale V. (2012). Clotrimazole nanoemulsion for malaria chemotherapy. Part I: preformulation studies, formulation design and physicochemical evaluation. Int J Pharm 431:138–48
- Brahmankar DM, Jaiswal BS. (1987). Biopharmaceutics and pharmacokinetics: a treatise. 1st ed. New Delhi: Vallabh Prakashan
- Cagigal E, González L, Alonso RM, Jiménez RM. (2001). pKa determination of angiotensin II receptor antagonists (ARA II) by spectrofluorimetry. J Pharm Biomed Anal 26:477–86
- Camilla S, Per H. (2009). Porous magnesium aluminometasilicate tablets as carrier of a cyclosporine self-emulsifying formulation. AAPS PharmSciTech 10:1388–95
- Cannon JB. (2005). Oral solid dosage forms of lipid-based drug delivery systems. Am Pharm Rev 8:108–15
- Carr RL. (1965). Evaluating flow properties of solids. Chem Eng 72:163–8
- Céline D, Roberto B, Georgios I, Martin K. (2009). A systematic dilution study of self-microemulsifying drug delivery systems in artificial intestinal fluid using dynamic laser light backscattering. Drug Dev Ind Pharm 35:199–208
- Chen M. (2008). Lipid excipients and delivery systems for pharmaceutical development: a regulatory perspective. Adv Drug Deliv Rev 60:768–77
- Chhabra G, Chuttani K, Mishra AK, Pathak K. (2011). Design and development of nanoemulsion drug delivery system of amlodipine besilate for improvement of oral bioavailability. Drug Dev Ind Pharm 37:907–16
- Christel H, Liane G, Ulricsssh K, Uwe K. (2006). Determination of telmisartan in human blood plasma Part II: liquid chromatography-tandem mass spectrometry method development, comparison to immunoassay and pharmacokinetic study. Anal Chim Acta 560:41–9
- Cuiné JF, Charman WN, Pouton CW, et al. (2007). Increasing the proportional content of surfactant (Cremophor EL) relative to lipid in self emulsifying lipid-based formulations of danazol reduces oral bioavailability in beagle dogs. Pharm Res 24:748–57
- Date AA, Nagarsenker MS. (2007). Design and evaluation of self-nanoemulsifying drug delivery systems (SNEDDS) for cefpodoxime proxetil. Int J Pharm 329:166–72
- Desai PP, Date AA, Patravale VB. (2012). Overcoming poor oral bioavailability using nanoparticle formulations – opportunities and limitations. Drug Discov Today Tech 9:87–95
- Dixit AR, Rajput SJ, Patel SG. (2010). Preparation and bioavailability assessment of SMEDDS containing valsartan. AAPS PharmSciTech 11:314–21
- Dong WK, Jun HK, Dong HO, et al. (2012). Development of novel flurbiprofen-loaded solid self-microemulsifying drug delivery system using gelatin as solid carrier. J Microencapsul 29:323–30
- Elkordy AA, Essa EA, Dhuppad S, Jammigumpul P. (2012). Liquisolid technique to enhance and to sustain griseofulvin dissolution: effect of choice of non-volatile liquid vehicles. Int J Pharm 434:122–32
- Emad BB, Nevine S, Shaimaa MB. (2010). SNEDDS containing bioenhancers for improvement of dissolution and oral absorption of lacidipine. I: development and optimization. Int J Pharm 391:203–11
- FDA guidance for industry: bioanalytical method validation. US Department of Health and Human Services, Food and Drug Administration, Center for Drug Evaluation and Research; 2001
- Feng G, Haijun Z, Jing H, et al. (2011). Self-microemulsifying drug delivery system for improved oral bioavailability of dipyridamole: preparation and evaluation. Arch Pharm Res 34:1113–23
- Garala KC, Patel JM, Dhingani AP, Dharamsi AT. (2013). Preparation and evaluation of agglomerated crystals bycrystallo-co-agglomeration: an integrated approach of principal component analysis and Box–Behnken experimental design. Int J Pharm 452:135–56
- Garala K, Patel J, Patel A, Dharamsi A. (2011). Enhanced encapsulation of metoprolol tartrate with carbon nanotubes as adsorbent. Appl Nanosci 1:219–30
- Gershanik T, Benita S. (2000). Self-dispersing lipid formulations for improving oral absorption of lipophilic drugs. Eur J Pharm Biopharm 50:179–88
- Ghosh MN. (2008). Fundamentals of experimental pharmacology, 3rd ed. Calcutta: SK Ghosh & Others
- Gupta S, Chavhan S, Sawant KK. (2011). Self nanoemulsifying drug delivery system for adefovir dipivoxil: design, characterization, in vitro and ex vivo evaluation. Colloid Surface A 392:145–55
- Haware RV, Tho I, Bauer-Brandl A. (2009). Application of multivariate methods to compression behavior evaluation of directly compressible materials. Eur J Pharm Biopharm 72:148–55
- Hentzschel CM, Alnaief M, Smirnova I, et al. (2012). Enhancement of griseofulvin release from liquisolid compacts. Eur J Pharm Biopharm 80:130–5
- Horter D, Dressman JB. (2001). Influence of physicochemical properties on dissolution of drugs in the gastrointestinal tract. Adv Drug Deliv Rev 46:75–87
- Indian Pharmacopoeia (2010). Government of India, Ministry of Health and Family Welfare, Indian Pharmacopoeia Commission. Ghaziabad, India
- Jeoung HY, Srinivasan S, Pritam T, et al. (2010). Novel self-nanoemulsifying drug delivery system for enhanced solubility and dissolution of lutein. Arch Pharm Res 33:47–56
- Jia X, Qi C, Chak KC, et al. (2009). Formulation development and bioavailability evaluation of a self-nanoemulsified drug delivery system of oleanolic acid. AAPS PharmSciTech 10:72–82
- Jing C, Bo Y, Yu Z, et al. (2009). Enhancement of oral absorption of curcumin by self-microemulsifying drug delivery systems. Int J Pharm 371:148–55
- Jun HK, Dong HO, Yu-Kyoung O, et al. (2012). Effects of solid carriers on the crystalline properties, dissolution and bioavailability of flurbiprofen in solid self-nanoemulsifying drug delivery system (solid SNEDDS). Eur J Pharm Biopharm 80:289–97
- Kalhapure RS, Akamanchi KG. (2012). Oleic acid based heterolipid synthesis, characterization and application in self-microemulsifying drug delivery system. Int J Pharm 425:9–18
- Kallakunta VR, Bandari S, Jukanti R, Veerareddy PR. (2012). Oral self-emulsifying powder of lercanidipine hydrochloride: formulation and evaluation. Powder Technol 221:375–82
- Kumar P, Mittal KL. (1999). Handbook of microemulsion science and technology. New York: Marshal Dekker
- Laura ME, Richard C, Justin H. (2012). Oral drug delivery with polymeric nanoparticles: the gastrointestinal mucus barriers. Adv Drug Deliv Rev 64:557–70
- Lawrence MJ, Rees GD. (2000). Microemulsion-based media as novel drug delivery systems. Adv Drug Deliv Rev 45:89–121
- Li PF, Wang YW, Wangi Y, et al. (2005). Determination of telmisartan in human plasma by liquid chromatography–tandem mass spectrometry. J Chromatogra B 828:126–9
- Lloyd-Jones D, Adams RJ, Brown TM. (2010). Heart disease and stroke statistics – 2010 update: a report from the American Heart Association. Circulation 121:46–215
- Mahmoud EA, Bendas ER, Mohamed MI. (2009). Preparation and evaluation of self-nanoemulsifying tablets of carvedilol. AAPS PharmSciTech 10:183–92
- Martin A. (1993). Physical pharmacy, 4th ed. Philadelphia: Lippincott Williams & Wilkins
- Mennini N, Furlanetto S, Cirri M, Mura P. (2012). Quality by design approach for developing chitosan-Ca-alginate microspheres for colon delivery of celecoxib-hydroxypropyl-β-cyclodextrin-PVP complex. Eur J Pharm Biopharm 80:67–75
- Mezghrani O, Ke X, Bourkaib N, Xu BH. (2011). Optimized self-microemulsifying drug delivery systems (SMEDDS) for enhanced oral bioavailability of astilbin. Pharmazie 66:754–60
- Minghui S, Luqin S, Xuezhen Z, et al. (2011). The influence of co-solvents on the stability and bioavailability of rapamycin formulated in self-microemulsifying drug delivery systems. Drug Dev Ind Pharm 37:986–94
- Mustafa G, Khan ZI, Bansal T, Talegaonkar S. (2009). Preparation and characterization of oil in water nano-reservoir systems for improved oral delivery of atorvastatin. Curr Nanosci 5:428–40
- Myung JK, Hyung SK, Ho SJ, et al. (2012). In situ intestinal permeability and in vivo absorption characteristics of olmesartan medoxomil in self microemulsifying drug delivery system. Drug Dev Ind Pharm 38:587–96
- Nagabandi V, Ramarao T, Jayaveera K. (2011). Liquisolid compacts: a novel approach to enhance bioavailability of poorly soluble drugs. Int J Pharm Bioall Sci 3:89–102
- Nazzal S, Zaghloul AA, Khan MA. (2002). Effect of extra-granular microcrystalline cellulose on compaction, surface roughness and in-vitro dissolution of a self-nanoemulsified solid dosage form of ubiquinone. Pharm Technol 26:86–98
- Nekkanti V, Karatgi P, Prabhu R, Pillai R. (2010). Solid self-microemulsifying formulation for candesartan cilexetil. AAPS PharmSciTech 11:9–17
- Nepal PR, Han H, Choi H. (2010). Preparation and in vitro–in vivo evaluation of Witepsol® H35 based self-nanoemulsifying drug delivery systems (SNEDDS) of coenzyme Q10. Eur J Pharm 39:224–32
- Nokhodchi A, Aliakbar R, Desai S, Javadzadeh Y. (2010). Liquisolid compacts: the effect of cosolvent and HPMC on theophylline release. Colloids Surf B 79:262–9
- Noyes A, Whitney W. (1987). The rate of solution of solid substances in their own solutions. J Am Chem Soc 19:930–4
- Parmar N, Singla N, Amin S, Kohli K. (2011). Study of cosurfactant effect on nanoemulsifying area and development of lercanidipine loaded (SNEDDS) self nanoemulsifying drug delivery system. Colloids Surf B 86:327–38
- Parveen R, Baboota S, Ali J, et al. (2011). Oil based nanocarrier for improved oral delivery of silymarin: in vitro and in vivo studies. Int J Pharm 413:245–53
- Patel D, Sawant KK. (2009). Self microemulsifying drug delivery system: formulation development and biopharmaceutical evaluation of lipophilic drugs. Curr Drug Deliv 6:419–24
- Patel J, Dhaingani A, Dabhi M, et al. (2010). Design and development of sustained release microspheres of quetiapine fumarate using 32 full factorial design. J Pharm Res 3:2871–5
- Peng L, Xinyu R, Johanna L, et al. (2011). Nanosuspensions of poorly soluble drugs: preparation and development by wet milling. Int J Pharm 411:215–22
- Ping Z, Ying L, Nianping F, Jie X. (2008). Preparation and evaluation of self-microemulsifying drug delivery system of oridonin. Int J Pharm 355:269–76
- Porter CJ, Pouton CW, Cuine JF, Charman WN. (2008). Enhancing intestinal drug solubilisation using lipid-based delivery systems. Adv Drug Deliv Rev 60:673–91
- Pouton CW, Porter CJH. (2008). Formulation of lipid-based delivery systems for oral administration: materials, methods and strategies. Adv Drug Deliv Rev 60:625–37
- Rajalahti T, Kvalheim OM. (2011). Multivariate data analysis in pharmaceutics: a tutorial review. Int J Pharm 417:280–90
- Ringnér M. (2008). What is principal component analysis? Nat Biotechnol 26:303–4
- Roopwani R, Buckner IS. (2011). Understanding deformation mechanisms during powder compaction using principal component analysis of compression data. Int J Pharm 418:227–34
- Shafiq S, Shakeel F, Talegaonkar S, et al. (2007). Development and bioavailability assessment of ramipril nanoemulsion formulation. Eur J Pharm Biopharm 66:227–43
- Shah TJ, Amin AF, Parikh JR, Parikh RH. (2007). Process optimization and characterization of poloxamer solid dispersions of a poorly water-soluble drug. AAPS PharmSciTech 8:E1–7
- Shahiwala A. (2011). Formulation approaches in enhancement of patient compliance to oral drug therapy. Expert Opin Drug Deliv 8:1521–9
- Singh B, Khurana L, Bandyopadhyay S, et al. (2011). Development of optimized self-nano-emulsifying drug delivery systems (SNEDDS) of carvedilol with enhanced bioavailability potential. Drug Deliv 18:599–612
- Singh B, Kumar R, Ahuja N. (2005). Optimizing drug delivery systems using systematic “design of experiments.” Part I: fundamental aspects. Crit Rev Ther Drug 22:27–105
- Singh SK, Ranjan P, Verma P, Razdan B. (2010). Glibenclamide-loaded self-nanoemulsifying drug delivery system: development and characterization. Drug Dev Ind Pharm 6:933–45
- Spireas S. (2002). Liquisolid systems and methods of preparing same. US Patent 6423339B1
- Srinivasan S, Rengarajan B, Prabagar B, et al. (2011). Solid self-nanoemulsifying drug delivery system (S-SNEDDS) containing phosphatidylcholine for enhanced bioavailability of highly lipophilic bioactive carotenoid lutein. Eur J Pharm Biopharm 79:250–7
- Tao Y, Jiangling W, Huibi X, Xiangliang Y. (2008). A new solid self-microemulsifying formulation prepared by spray-drying to improve the oral bioavailability of poorly water soluble drugs. Eur J Pharm Biopharm 70:439–44
- Toshiyuki N, Satoru M, Kazumi D. (2011). Universal wet-milling technique to prepare oral nanosuspension focused on discovery and preclinical animal studies – development of particle design method. Int J Pharm 405:218–27
- Venkatesh G, Majid MIA, Mansor SM, et al. (2010). In vitro and in vivo evaluation of self-microemulsifying drug delivery system of buparvaquone. Drug Dev Ind Pharm 36:735–43
- Villar AMS, Naveros BC, Campmany ACC, et al. (2012). Design and optimization of self-nanoemulsifying drug delivery systems (SNEDDS) for enhanced dissolution of gemfibrozil. Int J Pharm 431:161–75
- Xuemei W, Jianhua X, Xiuwang H, Caixia W. (2011). Self-microemulsifying drug delivery system improves curcumin dissolution and bioavailability. Drug Dev Ind Pharm 37:15–23
- Yan G, Yuqiang W, Yukun M, et al. (2009). Formulation optimization and in situ absorption in rat intestinal tract of quercetin-loaded microemulsion. Colloids Surf B 71:306–14
- Yinghui W, Xiaoli Y, Xiaoguang S, et al. (2012). Enhanced oral bioavailability of silybin by a supersaturatable self-emulsifying drug delivery system (S-SEDDS). Colloid Surfaces A 396:22–8
- Yongjun W, Jin S, Tianhong Z, et al. (2011). Enhanced oral bioavailability of tacrolimus in rats by selfmicroemulsifying drug delivery systems. Drug Dev Ind Pharm 37:1225–30
- Yosra SRE, Magda AE, Ossama YA. (2009). Self-nanoemulsifying drug delivery systems of tamoxifen citrate: design and optimization. Int J Pharm 380:133–41
- Zhu M, Ghodsi A. (2006). Automatic dimensionality selection from the scree plot via the use of profile likelihood. Comput Stat Data An 51:918–30