
Abstract
Modeling and simulation are aimed at achieving information about the behaviors of the drugs without the actual measurements and determination. The purpose of this study was to characterize the in vivo behavior of exenatide microspheres using model-based methods. Exenatide is a glucagon-like peptide-1 agonist medication, belonging to the group of incretin mimetics, approved for the treatment of diabetes mellitus type 2. An oil-in-water solvent evaporation method was used to prepare the exenatide microspheres and their physicochemical features were investigated. After subcutaneous injection of exenatide microspheres to streptozotocin-induced diabetic rats, the exenatide concentrations increased and kept increasing and the blood glucose decreased in all diabetic rats. The in vivo release behavior of exenatide from microspheres was described by a transit compartment model. Based on the transit compartment model, the simulation method was proposed for the description of in vivo release. The in vitro and in vivo correlation (IVIVC) was established by the model-based simulation (R2 = 0.903) and deconvolution (R2 = 0.922) methods successfully. Using a transit compartment model to characterize the in vivo exenatide release from microspheres is an acceptable approach, and the IVIVC can be estimated reliably with the model-based simulation method.
Introduction
Exenatide (glucagon-like peptide-1 (GLP-1) analog) is a naturally occurring 39-amino acid peptide originally isolated from the salivary secretions of the Gila monster (Heloderma suspectum) (Eng et al., Citation1992). GLP-1 and exenatide have the potential to contribute to glycemic control in patients with diabetes. The mechanism includes the glucose-dependent stimulation of insulin secretion, the modulation of glucose trafficking in peripheral tissues, the suppression of glucagon secretion, the slowing down of the gastric emptying, the inhibition of food intake and the enhancement of β-cell mass (Goke et al., Citation1993; Parkes et al., Citation2004). Compared with GLP-1 in preclinical studies, exenatide has a 20–30-fold longer half-life and 5500-fold greater potency in decreasing plasma glucose (Young et al., Citation1999; Parkes et al., Citation2001). Byetta® (exenatide injection) is the first FDA-approved GLP-1 receptor agonist for the treatment of type 2 diabetes. Furthermore, Bydureon® (exenatide extended-release microspheres), the first once-weekly therapeutic drug for type 2 diabetes was authorized for marketing in January 2012 by FDA. However, the manufacture of Bydureon® involves a complex process (the water-in-oil-in-oil coacervation method). In addition, the pharmacokinetic profile is inadequate in Sprague-Dawleys (SD) rats and the weekly dose of exenatide in Bydureon® (i.e. a single dose of 2 mg/human) is much higher (14–28-fold) than that of Byetta® (i.e. 5–10 µg/human twice a day, which corresponds to a total weekly dose of 70–140 µg/human). To improve the potential drawbacks of Bydureon®, an improved sustained release microsphere of exenatide was developed (Kwak et al., Citation2009). To get a more complete in vivo release of exenatide from the microsphere, polymer PLGA RG 502 H with lower molecular weight was selected as the carrier instead of RG 503 H. A simple oil-in-water (O/W) emulsion solvent evaporation method was adopted to the simple manufacturing process. The plasma concentrations of exenatide, as well as the efficacy (plasma insulin and non-fasting blood glucose), were evaluated, respectively, in Zucker diabetic fatty rats following the treatment with these microspheres.
The absorption process of oral dosage forms through the whole gastro-intestinal tract can be described by the transit compartment model (Kagan & Hoffman, Citation2008; Lehto et al., Citation2011). Owing to the closeness to the real process, the transit compartment model is a better choice to estimate drug oral absorption rather than the simple first-order rate constant. Furthermore, the delayed drug effects due to the signal transduction processes can also be well described by the transit compartment model (Sun & Jusko, Citation1998), and an increasing number of researchers are paying more attention to this kind of model (Hamberg et al., Citation2007; Li et al., Citation2012a). A transit compartment model may be extended to other aspects, such as drug release from the microspheres.
The FDA defines the in vitro and in vivo correlation (IVIVC) as “a predictive mathematical model describing the relationship between an in vitro property of a dosage form and a relevant in vivo response”. The main objective of developing and evaluating an IVIVC is to enable the dissolution test to serve as a surrogate for in vivo bioequivalence studies (for example, in the case of the changes in formulation, equipment, preparation and manufacturing site). This may reduce the number of bioequivalence studies required for approval during scale-up and post-approval changes as well. Wanger–Nelson, Loo–Riegelmanor and deconvolution methods can be used to calculate the in vivo release of drug (Sun et al., Citation2008; Jantratid et al., Citation2009). Direct measurement (Zolnik & Burgess, Citation2008) and differential equation-based IVIVC approach (Buchwald, Citation2003) as alternative methods are also proposed. Our previous study indicated that model-based simulation was a reliable method to establish the IVIVC of exenatide double-walled microspheres (Li et al., Citation2012b).
Accordingly, in the present study, a transit compartment model was used to characterize the in vivo release of exenatide from microspheres, and the blood glucose-lowering effects of exenatide microspheres were evaluated. The correlation between in vitro release and in vivo absorption was established by both deconvolution and simulation methods.
Materials and methods
Materials
Exenatide (purity >99%) was obtained from Taishi Biotechnology Co., Ltd (Shanghai, China). Exenatide enzyme immunoassay (EIA) kits were purchased from Phoenix Pharmaceuticals, Inc. (Burlingame, CA). Poly(d,l-lactide-co-glycolide) (PLGA, DG-50DLGH 025, 50:50, Inherent visc. 0.15–0.25 dl/g) was supplied by Daigang Biotechnology Co., Ltd (Jinan, China). Micro BCATM protein assay kit (Pierce, IL) and Streptozotocin (STZ, Sigma No. S0130, St. Louis, MO) were purchased from Sigma-Aldrich (St. Louis, MO). Poly vinyl alcohol-124 (PVA-124, 98.8% hydrolyzed) was the product of East Ring Union Chemical Plant (Beijing, China). Sodium carboxymethyl cellulose (CMC-Na), Tween 20, phosphate-buffered saline (PBS) and other chemicals were of reagent grade. High-fat diet was produced by Keaoxieli Co. Ltd. (Beijing, China). All solutions were prepared with distilled water.
Preparation of exenatide microspheres
PLGA microspheres were prepared using oil-in-water (O/W) emulsion solvent evaporation, as previously reported (Kwak et al., Citation2009) with some modifications. Briefly, 100 mg of PLGA and 4 mg of exenatide were dissolved in 2.0 ml of mixed solvent (dichloromethane:methanol = 2:1, v/v) as the oil phase. One percent PVA and 0.9% NaCl in water for injection was the water phase. The water phase was stirred using a mechanical stirrer at 400 rpm in ice bath and the oil phase was quickly injected to the water phase (O:W = 1:25, v/v) by a 27 gauge needle. After 4 h, the ice bath was replaced by room temperature for 4 h to evaporate the solvent completely. The resulting exenatide microspheres were washed three times with distilled water and dried in vacuum for 24 h. In addition, the blank microspheres were prepared using the same technique in the absence of exenatide.
Physicochemical characterization
The morphology of exenatide microspheres was examined using a field emission scanning electron microscopy (SEM, JEOL JSM-5600LV, Tokyo, Japan). The size distribution of microspheres was determined by a light-scattering particle size analyzer (BT-9300 H, BETTER, Dandong, China) with a circulation disperser (BT-600, BETTER, Dandong, China). To determine the drug loading (DL) of the microspheres, exenatide microspheres (about 10 mg), accurately weighed, were added into a test tube to which 1 ml of DMSO was added, then 10 ml of 0.05 M NaOH solution containing 0.5% (w/v) SDS was added to the test tube and gently mixed. Blank microspheres were also subjected to the same procedure (Sah, Citation1997). After incubated for 1 h at room temperature, the Micro BCATM protein assay kit was used to determine the exenatide concentration of incubation solution (Kwak et al., Citation2009). The encapsulation efficiency (EE) was calculated as the ratio of actual-to-theoretical DL.
The secondary structure of exenatide entrapped in microspheres was compared with native exenatide using circular dichroism (CD) spectroscopy (J-810 spectropolarimeter, Jasco, Japan). Exenatide in microspheres were extracted as follows: About 11 mg of microspheres were dissolved in 0.5 ml of DCM, and 2 ml of distilled water was added. After vortexed for 2 min, the mixture was centrifuged at 4250 g for 10 min, and the supernatant liquid was decanted into a separate container for later analysis. The measurements were performed using a 0.1 cm path cuvette at 100 nm/min scanning speed. The samples were scanned in the range of 185–250 nm for triplicate analyses. CD spectra of the blank reference were subtracted from the exenatide spectra, and the final spectrum is the average of the three scans.
In vitro release study
In vitro release was performed using the previously reported method (Kwak et al., Citation2009). In this study, about 30 mg of exenatide microspheres were dispersed in 1.0 ml of PBS (pH = 7.4, containing 0.02% (w/v) Tween 20). The suspension was kept under continuous agitation at 100 rpm and 37 °C for 40 days. Samples were withdrawn (centrifuged at 3500 g for 3 min, 0.8 ml of supernatant was carefully withdrawn) at a regular time intervals and replenished with equal volume of fresh medium. The amount of exenatide in the supernatant was analyzed using Micro BCATM protein assay kit. The cumulative release amount was calculated by the following equation:
(1)
where Ci and Ci-1 represent exenatide concentrations in supernatant at the ith and i − 1th sampling, respectively. Mr and Mex are used to characterize the amount of cumulative release and the total amount of exenatide in microspheres, respectively.
Animal study
Induction of diabetic rats
All experimental procedures were approved by the Animal Ethics Committee of Peking University Health Science Center. Male SD rats weighting 200 ± 20 g were obtained from the Experimental Animal Center at the Peking University Health Science Center, Beijing, China. The diabetes was induced using a high-fat diet/STZ treatment method, as previously reported (Reed et al., Citation2000). Male SD rats were allowed to acclimate to their new environment for one week before experiment. All animals were housed under an ambient temperature (22–25 °C) and standard conditions (12-h dark/light cycle). They were provided with high-fat diet (67% normal chow diet, 20% sucrose, 10% lard, 2% cholesterol and 1% cholate) and water ad libitum. After eight weeks of the high-fat diet, experimental diabetes was induced by a single intraperitoneal injection of 45 mg/kg body weight of STZ dissolved in 0.1 M citric acid buffer (pH 4.3). Three weeks after STZ injection, all rats were fasted for 12 h and their blood glucose was measured by ACCU-CHEK® Advantage II (Roche Diagnostics, Mannheim, Germany). In our study, the rats with fasting blood glucose above 16.7 mmol/l were considered as diabetic.
Regimen design
Twenty diabetic rats weighting 300–350 g were randomly divided into four groups. About 1.0 ml of aqueous suspension of exenatide microspheres with different final exenatide concentrations of 0.25, 0.5 and 1 mg/ml was subcutaneously (sc) injected to three separate treatment groups, leading to the exenatide dose in each group was 0.25, 0.5 and 1 mg/rat, respectively. About 1.0 ml of suspension of blank microspheres was sc administered to the rats of the control group. The aqueous vehicle was composed of 0.87% NaCl, 1% CMC-Na and 0.1% Tween 20. About 0.25 ml of blood samples were collected from the orbit vein of rats into tubes at different time intervals for 25 days (0 (predose), 1, 2, 4, 10 h and 1, 2, 4, 7, 10, 12, 16, 18, 20, 22 and 25 days after injection). The serum was harvested by centrifugation at 8500 g for 5 min and then stored at −20 °C pending analysis. Non-fasting blood glucose concentrations were measured using ACCU-CHEK® Advantage II, and the average blood glucose and standard deviation (SD) were calculated.
Pharmacokinetic analysis
Analysis of serum exenatide and pharmacokinetic model
In this study, serum exenatide was determined using Exendin-4 EIA kit, following the manufacturer’s instruction. General procedures followed the manufacturer’s protocol. Plates were read at OD450 on an enzyme-linked immune sorbent assay plate reader (iMarkTM microplate reader, BIO-RAD, Hercules, CA, USA.).
To reach the absorption site, exenatide entrapped in microspheres needs to pass through the barrier of microspheres. This process can be viewed as a flow through a series of segments and each segment was simulated using a single compartment with linear kinetics. Therefore, transit compartments were used to characterize the in vivo release of exenatide from microspheres. To simplify the release model, all the compartments have the same transit rate constant ktr. Through optimization, two transit compartments were employed into the final pharmacokinetic model. The absorption compartment simulated the absorption site of exenatide. A burst release is consistent with a rapid release of drug at the microsphere surface; therefore, this fraction of exenatide can reach the absorption compartment without flowing through the transit compartment. A scaling factor Fra was used to indicate the percentage of burst release, and Fra·Dose represented the initial value of the absorption compartment. In our previous study, exenatide aqueous solution was sc injected to STZ-induced diabetic rats and two-compartment model with first-order absorption could describe the in vivo behavior nicely. Therefore, the pharmacokinetic parameters were fixed as the values we previous estimated (Li et al., Citation2012c). Finally, six compartments were employed in the pharmacokinetic model () and differential equations were expressed as follows:
(2)
(3)
(4)
(5)
(6)
(7)
(8)
(9)
where XMS, Xtr1, Xtr2 and Xa represent microspheres, the first transit, the second transit and the absorption compartment, respectively. ktr is the transit rate constant. D means the dose of exenatide microspheres. XMS0 and Xa0 are the initial values of the microsphere compartment and the absorption compartment, respectively. The values of fixed pharmacokinetic parameters such as ka, Cl, Vc, Q and Vp are listed in .
Figure 1. The schematic pharmacokinetic model of the exenatide microspheres. Solid lines with arrows represent the transit, elimination or distribution of the pharmacokinetic indices. The model is described by Equations (2)–(9). Definitions of parameters are provided in .
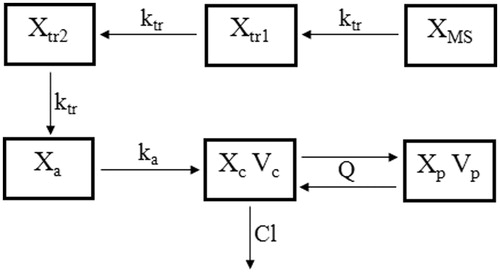
Table 1. Parameter estimates obtained from exenatide concentrations-time profiles after sc injection to diabetic rats with the two-compartment pharmacokinetic model.
Data analysis and model validation
A population approach was applied to quantify the pharmacokinetics of exenatide microspheres. All the data from treatment groups were fitted simultaneously. All computer fittings and simulations were done using a Non-linear Mixed-Effect Model program (Version 72, ICON Development Solution, Ellicott, MD, USA) with the first-order conditional estimation with the η–ɛ interaction method. The population typical values of parameters, the inter-individual variability on these parameters, and the residual error were estimated.
Using the final pharmacokinetic model, visual predictive check (VPC) was conducted separately for different dose regimens by simulating 2000 times to evaluate the adequacy of the model by comparing the distribution of the observed concentrations with the distribution of the simulated concentrations.
In vitro and in vivo correlation
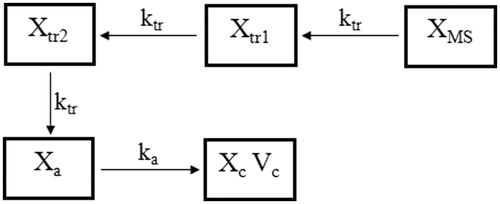
The exenatide concentration-time profiles were deconvoluted to the fraction drug absorbed (Fa) profiles using WinNonlin® IVIVC Toolkit™ (Version 5.2, Pharsight Corporation, St. Louis, MO, USA). The unit impulse response was determined from the data obtained following the sc administration of exenatide solution to diabetic rats (Li et al., Citation2012c). The proposed in vivo release model for the model-based simulation method is shown in . Parameters ktr, Fra and ka were fixed as the estimated values, and the other pharmacokinetic parameters and peripheral compartment were deleted from the final pharmacokinetic model, then the amount of drug flowing into the central compartment was simulated. The simulated data indicated the amount of drug absorbed in vivo, so Fa could be calculated (divided by doses). Linear regression analysis was applied to the IVIVC plots and correlation coefficient (R2) was calculated.
Figure 2. The proposed in vivo release model with two transit compartments.
Results
Physicochemical characterization
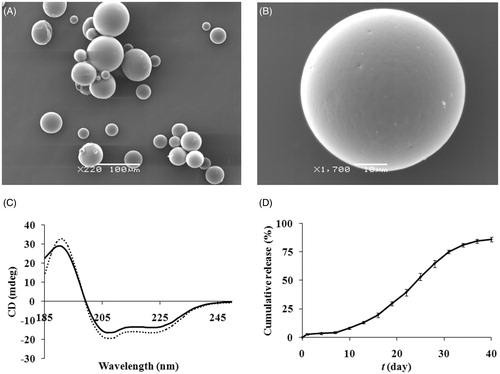
The mean particle size, DL and EE were 45 ± 6.7 μm, 3 ± 0.1% (w/w, n = 3) and 78 ± 2.5% (n = 3), respectively. The SEM images showed that the microspheres have spherical, non-porous and smooth morphology (). The CD spectra of native exenatide and exenatide extracted from the microspheres are shown in (C). Both of them have two minima around 208 and 222 nm, which are typical of predominantly α-helices proteins like exenatide. As expected, peaks observed for exenatide encapsulated into microspheres or free in solution were observed at similar wavelengths, suggesting that there was no difference in exenatide structure between the two states.
Figure 3. SEM photographs of the surface morphology ((A): magnification of 220; (B): magnification of 1700) of exenatide microspheres. (C) CD spectra of native exenatide sample (solid line) and exenatide extracted from microspheres (dotted line). (D) In vitro release of exenatide microspheres in PBS at 37 °C for 40 days (mean ± SD, n = 3).
In vitro release profiles
The cumulative in vitro release profile of exenatide from microspheres is shown in . The profile exhibited distinct three-phase release: burst release phase, lag phase and sustained release phase. Here, an initial exenatide burst release of about 2.6% was observed within the first day, which should be attributed to the presence of exenatide on or near the surface of microspheres. Afterwards, a period of slightly increasing exenatide release occurred up to day 7, followed by an elevated exenatide release phase for 40 days. At the end of 40 days, approximately 86% of exenatide released from the microspheres, inferring possible good release of exenatide in vivo (Kwak et al., Citation2009).
Pharmacokinetic model
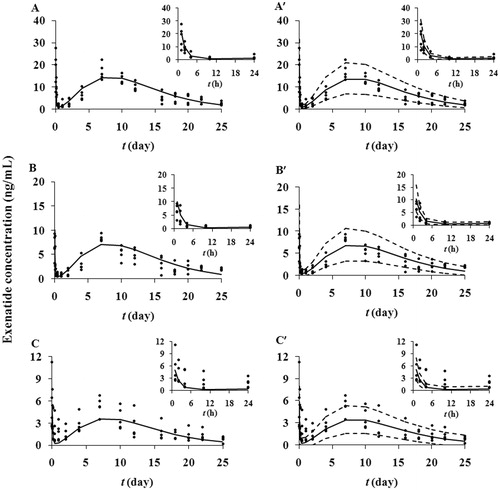
Pharmacokinetic parameters (ka, Cl, Vc, Q and Vp) were previously evaluated with diabetic rats at a single dose of exenatide solution. The main objective of the pharmacokinetic study was to characterize the in vivo release of exenatide from microspheres. The observed and predicted serum exenatide concentrations after sc administration of exenatide microspheres at three doses are shown in . There are two peaks in the plots: a shorter primary peak as well as a taller secondary peak. After sc injection of exenatide microspheres suspensions, drug was absorbed rapidly due to burst release. The levels of exenatide increased and reaching their initial peaks within 1 h. After that, exenatide declined rapidly through day 1 as a result of the lag phase. One day later, exenatide concentrations increased again, which was the result of sustained release. Exenatide reached their second peaks at about day 7. Following the decreased release, the exenatide concentrations decreased slowly until day 25, which was the end of determination. The pattern of concentration-time profiles implied the three-phase release in vivo. The concentrations were dose-dependent under sc injection doses from 0.25 to 1 mg/rat, and the proposed pharmacokinetic model nicely captured the experimental data. All parameters () were estimated with good precision (RSE% < 30%). Approximately 1.44 ± 0.82% of exenatide existed in the absorption compartment and was directly absorbed into the circulation. Present microspheres neither have a high burst release nor an extended period of lag phase, and this release pattern may have clinical significance due to the relatively stable exenatide concentration. The VPC is a valuable and supportive instrument for evaluating model performance. A VPC with the proposed pharmacokinetic model confirmed the goodness-of-fit of the model to the observed data as shown in . About 14.2% of the measured concentrations were located outside of the 90% predictive intervals of simulations, indicating the measured concentrations mostly fit well within the 5th–95th percentiles of the simulated values.
Figure 4. Observed and predicted serum exenatide concentrations-time profiles after a single administration of microspheres at the exenatide dose of 1 (A), 0.5 (B) and 0.25 (C) mg/rat in diabetic rats. The solid dots represent individual data from rats and the solid lines represent the model fit lines. VPC of the proposed pharmacokinetic model (exenatide dose: 1 (A′), 0.5 (B′) and 0.25 (C′) mg/rat). The ranges between the dotted lines depict the 90% confidence intervals. The solid lines present the medians of simulated data. The solid dots are the observed concentrations. The insets show the concentration versus time curves from 1 to 24 h.
In vitro and in vivo correlation
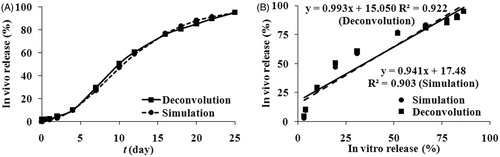
The in vivo release profiles ()) calculated by both deconvolution and simulation approaches were similar, implying the model-based simulation method was reliable. The in vivo release profiles showed an initial burst release of approximately 1.7% and 2.0% for deconvolution and simulation methods, respectively. At the end of the determination (25 days), about 95% of exenatide was released from the microspheres. As shown in and , the time to reach a plateau was different for the in vitro (40 days) and in vivo (25 days) data. The time required to reach a plateau needed to be normalized for in vitro and in vivo data, so a scale factor 1.6 (40 day divided by 25 day) was employed here to normalize the time (Li et al., Citation2012b). Since the sampling schemes for the in vitro release and in vivo absorption data were not coincident, linear interpolation was used where necessary to obtain the missing data (Balan et al., Citation2001). Because the burst release of microspheres should be investigated separately (Burgess et al., Citation2002), only the lag phase and the sustained release phase were used to establish IVIVC. A plot of the percentage of in vivo absorption versus the percentage of in vitro dissolution at various time points was constructed to examine if the IVIVC could be developed. The results of IVIVC were presented in , and the relative regression equations were also inserted. The good linear correlation (Deconvolution: R2 = 0.903, Simulation: R2 = 0.921) was demonstrated. Based on the results, it seems to be reasonable to predict the drug absorption in vivo through the release test in vitro.
Figure 5. (A) Exenatide in vivo release percentage obtained from exenatide microspheres. Circle for the simulation method, square for the deconvolution method. (B) In vitro and in vivo correlation model linear regression plots of cumulative absorption versus the percentage release of exenatide from microspheres: Circle for the simulation method, square for the deconvolution method.
Blood glucose-lowering effects
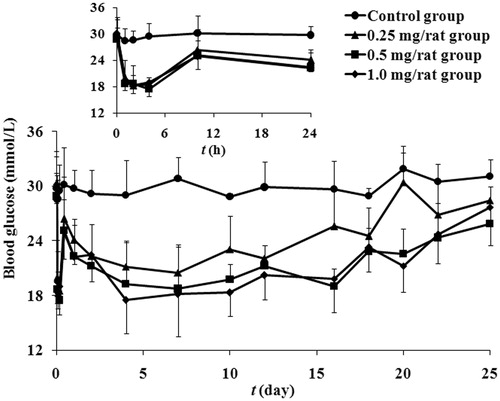
To investigate the potential application in therapy of diabetes mellitus, hypoglycemic effect of exenatide microspheres on STZ-induced diabetic rats was evaluated. demonstrates the time courses of measured blood glucose of diabetic rats in each group after administration within 40 days. Single injection of exenatide microspheres with doses ranging from 0.25 to 1 mg/rat significantly decreased non-fasting glucose comparing with the injection of vacant microspheres. There are two valleys in the blood glucose profiles of exenatide microspheres, the first and the second are due to the burst release and the sustained release of exenatide microspheres, respectively. The time to reach the first maximal hypoglycemic effects is about 2–4 h after administration, showing the delay of pharmacological effect of exenatide.
Figure 6. The observed blood glucose concentrations-time profiles after a single subcutaneous administration of microspheres at the exenatide dose of 1 (rhombus), 0.5 (square), 0.25 (triangle) and 0 (circle) mg/rat in diabetic rats. The inset shows blood glucose versus time curves from 1 to 24 h (mean ± SD, n = 5).
Discussion
Comparing with the literature (Kwak et al., Citation2009) in which PLGA RG 502 H (molecular weight: 8–12 kDa) was used as the carrier material, PLGA DG-50DLGH025 (molecular weight: 10–23 kDa) was selected as the matrix, therefore, a modified method was applied to prepare the exenatide microspheres. The higher molecular weight PLGA and bigger particle size of microspheres resulted in a longer release time in vitro. A burst release of protein at the initial period (<24 h) is mostly due to the protein release from the proteinaceous film on the particle surface (Ye et al., Citation2010). When drying in vacuum, volatilizing solvent can pull some of protein in microspheres toward to the surface. About 2.6% of burst release was observed in our microspheres, whereas there was no initial burst release of exenatide from PLGA RG502H microspheres (Kwak et al., Citation2009). That might be the results of different materials or drying conditions.
The in vitro release (40 days) of exenatide microspheres was slower than the in vivo release (25 days), which was due to the foreign body response (Spenlehauer et al., Citation1989; Tracy et al., Citation1999). This phenomenon has also been reported for many PLGA-based release injectable delivery systems (Soriano et al., Citation1996; Machida et al., Citation2000; Jiang et al., Citation2002, Citation2003; Zolnik & Burgess, Citation2008). The in vivo conditions involve a great deal of complexity which is impossible to simulate in vitro, such as the presence of hydrolytic enzymes, the effect of plasma proteins on the polymer degradation and the pH gradient (Jiang et al., Citation2002). Despite these inconsistencies, with the use of IVIVC model, it may be possible to optimize the dosage forms or predict the in vivo performance of the exenatide microspheres based on the in vitro release data.
The delay of oral drug absorption (Yu et al., Citation1996; Savic et al., Citation2007; Haruta et al., Citation2002; Kagan & Hoffman, Citation2008) and the delayed effects of pharmacodynamic responses due to the signal transduction process (Sun & Jusko, Citation1998; Li et al., Citation2012a) were described using transit compartment models. Considering the similarity of exenatide release from microspheres and drug flowing through the transit compartments, transit compartments were employed here to describe the in vivo release. Initially, various numbers of transit compartments were tested to link the microsphere compartment to the absorption compartment. Nicely pharmacokinetic profiles were captured using two transit compartments, demonstrating that these were sufficient to account for the drug release from microspheres. In our another study (Li et al., Citation2012b), three transit compartments model characterized the drug release from the double-walled microspheres very well. A transit compartment model offers greater flexibility for modeling the drug release from microspheres.
In our earlier study, exenatide exhibited high dissolution, permeability and rapid absorption (ka = 4.45 h−1). The PLGA microspheres degradation was the determinant step for exenatide release from microspheres. Dissolution and permeability were not the rating-limiting step for its absorption. Therefore, a good IVIVC for exenatide microspheres could be expected and a deconvolution-based IVIVC (R2 = 0.903) was developed. The model-based simulation method was used to predict the in vivo absorption in double-walled microspheres successfully (Li et al., Citation2012b). Here, the in vivo absorption curve obtained by simulation has a good linear relationship (R2 = 0.997) with the curve calculated by the deconvolution method, indicating that is an alternative method to calculate in vivo absorption. The simulation approach may be used more widely for different drugs and formulations. Goodness-of-fit is a key factor for simulation. The concentrations at 10 and 24 h were underestimated by the final pharmacokinetic model (), so the simulated in vivo absorption and burst release were underestimated (1.65% for simulation and 2.05% for deconvolution). Comparing with PBS, the aqueous suspension vehicle (1.0% CMC-Na) had a certain viscosity which slowed the exenatide release. The initial burst release of exenatide was 2.53% in in vitro, whereas it was 2.05% in in vivo.
Conclusion
Exenatide microspheres were prepared using a simple O/W solvent evaporation method, and their physicochemical features were evaluated. After sc administration to diabetic rats, the exenatide concentrations increased and remained elevated for at least 25 days, and the blood glucose decreased. A transit compartment model was suitable for the description of the in vivo release of sustained microspheres; moreover, the amount of burst release was nicely predicted. On the basis of transit compartment model, simulation data imitated the in vivo release, and the in vivo release showed a similar trend to the in vitro release. The simulation data were used to establish the IVIVC, and the final results were nearly the same as those achieved from the deconvolution method.
Declaration of interest
This work was supported by the Ministry of Science and Technology of the People’s Republic of China (Peking University New Drug Research & Development Platform grant number 2009ZX09301-010). The authors report no declarations if interest.
References
- Balan G, Timmins P, Greene DS, et al. (2001). In vitro-in vivo correlation (IVIVC) models for metformin after administration of modified-release (MR) oral dosage forms to healthy human volunteers. J Pharm Sci 90:1176–85
- Buchwald P. (2003). Direct, differential-equation-based in-vitro-in-vivo correlation (IVIVC) method. J Pharm Pharmacol 55:495–504
- Burgess DJ, Hussain AS, Ingallinera TS, et al. (2002). Assuring quality and performance of sustained and controlled release parenterals: workshop report. AAPS PharmSci 4:E7--8
- Eng J, Kleinman WA, Singh L, et al. (1992). Isolation and characterization of exendin-4, an exendin-3 analogue, from Heloderma suspectum venom. Further evidence for an exendin receptor on dispersed acini from guinea pig pancreas. J Biol Chem 267:7402–5
- Goke R, Fehmann HC, Linn T, et al. (1993). Exendin-4 is a high potency agonist and truncated exendin-(9-39)-amide an antagonist at the glucagon-like peptide 1 -(7-36)-amide receptor of insulin-secreting beta-cells. J Biol Chem 268:19650–5
- Hamberg AK, Dahl ML, Barban M, et al. (2007). A PK-PD model for predicting the impact of age, CYP2C9, and VKORC1 genotype on individualization of warfarin therapy. Clin Pharmacol Ther 81:529–38
- Haruta S, Kawai K, Nishii R, et al. (2002). Prediction of plasma concentration-time curve of orally administered theophylline based on a scintigraphic monitoring of gastrointestinal transit in human volunteers. Int J Pharm 233:179–90
- Jantratid E, De Maio V, Ronda E, et al. (2009). Application of biorelevant dissolution tests to the prediction of in vivo performance of diclofenac sodium from an oral modified-release pellet dosage form. Eur J Pharm Sci 37:434–41
- Jiang G, Qiu W, DeLuca PP. (2003). Preparation and in vitro/in vivo evaluation of insulin-loaded poly(acryloyl-hydroxyethyl starch)-PLGA composite microspheres. Pharm Res 20:452–9
- Jiang G, Woo BH, Kang FR, et al. (2002). Assessment of protein release kinetics, stability and protein polymer interaction of lysozyme encapsulated poly (D,L-lactide-co-glycolide) microspheres. J Control Release 79:137–45
- Kagan L, Hoffman A. (2008). Selection of drug candidates for gastroretentive dosage forms: pharmacokinetics following continuous intragastric mode of administration in a rat model. Eur J Pharm Biopharm 69:238–46
- Kwak HH, Shim WS, Hwang S, et al. (2009). Pharmacokinetics and efficacy of a biweekly dosage formulation of exenatide in Zucker diabetic fatty (ZDF) rats. Pharm Res 26:2504–12
- Lehto P, Kortejarvi H, Liimatainen A, et al. (2011). Use of conventional surfactant media as surrogates for FaSSIF in simulating in vivo dissolution of BCS class II drugs. Eur J Pharm Biopharm 78:531–8
- Li L, Li ZQ, Deng CH, et al. (2012a). A mechanism-based pharmacokinetic/pharmacodynamic model for CYP3A1/2 induction by dexamethasone in rats. Acta Pharmacol Sin 33:127–36
- Li XG, Li L, Wang XP, et al. (2012b). Application of model-based methods to characterize exenatide-loaded double-walled microspheres: In vivo release, pharmacokinetic/pharmacodynamic model, and in vitro and in vivo correlation. J Pharm Sci 101:3946–61
- Li XG, Li L, Zhou X, et al. (2012c). Pharmacokinetic/pharmacodynamic studies on exenatide in diabetic rats. Acta Pharm Sin 33:1379–86
- Machida Y, Onishi H, Kurita A, et al. (2000). Pharmacokinetics of prolonged-release CPT-11-loaded microspheres in rats. J Control Release 66:159–75
- Parkes DG, Jodka C, Smith P, et al. (2001). Pharmacokinetic actions of exendin-4 in the rat: comparison with glucagon-like peptide-1. Drug Develop Res 53:260–7
- Parkes DG, Nielsen LL, Young AA. (2004). Pharmacology of exenatide (synthetic exendin-4): a potential therapeutic for improved glycemic control of type 2 diabetes. Regul Pept 117:77–88
- Reed MJ, Meszaros K, Entes LJ, et al. (2000). A new rat model of type 2 diabetes: the fat-fed, streptozotocin-treated rat. Metabolism 49:1390–4
- Sah H. (1997). A new strategy to determine the actual protein content of poly(lactide-co-glycolide) microspheres. J Pharm Sci 86:1315–18
- Savic RM, Jonker DM, Kerbusch T, et al. (2007). Implementation of a transit compartment model for describing drug absorption in pharmacokinetic studies. J Pharmacokinet Pharmacodyn 34:711–26
- Soriano I, Evora C, Llabres M. (1996). Preparation and evaluation of insulin-loaded poly(DL-lactide) microspheres using an experimental design. Int J Pharm 142:135–42
- Spenlehauer G, Vert M, Benoit JP, et al. (1989). In vitro and in vivo degradation of poly(D,L lactide/glycolide) type microspheres made by solvent evaporation method. Biomaterials 10:557–63
- Sun Y, Wang J, Zhang X, et al. (2008). Synchronic release of two hormonal contraceptives for about one month from the PLGA microspheres: in vitro and in vivo studies. J Control Release 129:192–9
- Sun YN, Jusko WJ. (1998). Transit compartments versus gamma distribution function to model signal transduction processes in pharmacodynamics. J Pharm Sci 87:732–7
- Tracy MA, Ward KL, Firouzabadian L, et al. (1999). Factors affecting the degradation rate of poly(lactide-co-glycolide) microspheres in vivo and in vitro. Biomaterials 20:1057–62
- Ye ML, Kim S, Park K. (2010). Issues in long-term protein delivery using biodegradable microparticles. J Control Release 146:241–60
- Young AA, Gedulin BR, Bhavsar S, et al. (1999). Glucose-lowering and insulin-sensitizing actions of exendin-4 Studies in obese diabetic (ob/ob, db/db) mice, diabetic fatty Zucker rats, and diabetic rhesus monkeys (Macaca mulatta). Diabetes 48:1026–34
- Yu LX, Lipka E, Crison JR, et al. (1996). Transport approaches to the biopharmaceutical design of oral drug delivery systems: prediction of intestinal absorption. Adv Drug Deliv Rev 19:359–76
- Zolnik BS, Burgess DJ. (2008). Evaluation of in vivo-in vitro release of dexamethasone from PLGA microspheres. J Control Release 127:137–45