
Abstract
Contexts: Artemisinins and its derivatives are considered the basis in the treatment of Plasmodium falciparum malaria due to their high potency and rapid action. However, they have short half life, low solubility, and poor oral bioavailability, hence the need to formulate sustained release lipid particulate dosage form of these drugs.
Objectives: To formulate and evaluate artesunate-loaded solid lipid microparticles (SLMs) based on structured lipid matrices consisting of soybean oil and dika wax.
Materials and methods: The lipid matrices were characterized by differential scanning calorimetry (DSC), small-angle X-ray diffraction (SAXD), and wide-angle X-ray diffraction (WAXD). The SLMs were prepared by hot melt-homogenization. Time-dependent particle size analysis, time-dependent pH stability studies, encapsulation efficiency (EE%), and in vitro drug release were carried out on the SLMs. In vivo anti-malarial studies were performed using a modified Peter’s 4-day suppressive protocol using Plasmodium berghei infected mice.
Results and discussion: Thermograms of the lipid matrices showed modifications in the microstructure of dika wax as a result of inclusion of soybean oil. SAXD and WAXD diffractograms showed that the lipid matrices were found to be non-lamellar. Particle size of SLM increased with time, while the pH was almost constant. The SLMs had maximum EE% of 80.6% and sustained the release of artesunate more than the reference tablet. In vivo pharmacodynamic studies showed that the SLMs had significant (p < 0.05) reduction in parasitaemia compared with reference tablet.
Conclusion: Artesunate-loaded SLMs could be used once daily in the treatment of malaria.
Introduction
Plant and animal sources of lipids have been explored as potential excipients for lipid-based formulations (Attama et al., Citation2006; Obitte et al., Citation2012; Brown et al., Citation2013). Although chemical specificity and purity may not be optimal, these lipids may be superior to synthetic forms as regards toxicity and biocompatibility (Obitte et al., Citation2012). Natural fats may have better in vivo tolerability than synthetic fats (Kim et al., Citation2005). However, a major concern with the use of animal fats as drug delivery basis for oral or parenteral administration is the possibility of increasing the blood serum cholesterol, hence plant lipids are generally preferred.
The rapid growth in the use of lipid-based drug delivery systems is primarily due to the diversity and versatility of pharmaceutical grade lipid excipients amenable for formulation of liquid, semi-solid, and solid dosage forms. Lipid-based formulations have been shown to enhance the bioavailability of drugs administered orally (Hou et al., Citation2003; You et al., Citation2005; Chime et al., Citation2012, Citation2013a; Brown et al., Citation2013). Structured lipid matrices have been shown to have improved physical properties compared with the individual components and have the ability of combining the beneficial characteristics of component fatty acids. They may lead to increase in solubility of drug candidates, which is one of the prerequisites to obtain high drug loading (Attama et al., Citation2006).
Solid lipid microparticles (SLMs) were developed in early 1990s and have since been considered to be promising drug carrier systems, especially with a view to give the incorporated active substance a sustained release profile (Jaspart et al., Citation2005; Pilaniya et al., Citation2011; Obitte et al., Citation2013).
Malaria remains a tremendous health burden in tropical areas causing up to 24.3 billion episodes of clinical illness and 0.86 million deaths in 2009, with annual death rates of up to 93% of affected severe malaria (WHO, Citation2009; Li & Weina, Citation2010). Artesunate is a semi-synthetic derivative of the natural product artemisinin, from qing hao, the sweet wormwood plant called Artemisia annua. Artesunate is a novel sesquiterpene lactone, extracted from the leaves of the shrub Artemisia annua and possesses an endoperoxide bridge, which is a rare feature in natural products (Shapiro & Goldberg, Citation2006). It is a white crystalline powder that is slightly soluble in water. The water solubility of this drug facilitates absorption and provides an advantage over artemisinin, because it can be formulated as oral, rectal, intramuscular, and intravenous preparations (Li & Weina, Citation2010). Artesunate is rapidly hydrolyzed to dihydroartemisinin, which is the most active schizonticidal metabolite (Li & Weina, Citation2010). However, it has short half life and poor bioavailability of about 30% after oral administration (Shapiro & Goldberg, Citation2006).
Dika wax is an edible vegetable fat derived from the kernel of Irvingia gabonensis Var excelcia (Ofoefule et al., Citation1997; Okore, Citation2000; Chime et al., Citation2012), with the melting point range of 38 °C to 41 °C (Meara & Patel, Citation2006). Soybean oil is also an edible oil derived from Glycine soja and is one of the most important bean sources in the world, providing vegetable protein and oil for millions of people and supplying important functional ingredients to the food, health care, pharmaceutical, and chemical industries (Liu, Citation1999). Dika wax and soybean oil are completely biodegradable physiological lipids, and similar to other lipid excipients, they have generally regarded as safe status informing their use in this study. Therefore, the danger of use of synthetic polymer matrix materials which often goes along with detrimental effects on incorporated drug during manufacturing of formulations or during the erosion of the polymers after application are completely avoided (Reithmeier et al., Citation2001).
Formulation of artesunate with lipid excipients has been found to increase the oral bioavailability of this drug. Artesunate-loaded chitosan/lecithin nanoparticles were prepared by Chadha et al. (Citation2012) and in vivo antimalaria studies showed enhanced parasitaemia reduction. However, until date SLMs have not been employed as delivery system for artesunate. Therefore, the objectives of the study were to formulate novel sustained release artesunate-loaded SLMs using dika wax and soybean oil-based lipid matrices and to evaluate the in vitro properties of the formulations. In vivo, the anti-malarial properties of artesunate-loaded SLMs in Plasmodium berghei infected mice were also studied using optimized formulations.
Experimental
Materials
Artesunate (Emzor Pharmaceuticals Ltd., Lagos, Nigeria), soybean oil (Grand Cereal and Oils, Nigeria), n-hexane, ethyl acetate (Sigma-Aldrich, Germany), hydrochloric acid, sodium hydroxide, monobasic potassium phosphate and Tween 80 (Merck, Darmstadt, Germany), activated charcoal (Bio-Lab. Limited, UK), sorbitol (Across Organics, Germany), distilled water (Lion Water, Nsukka, Nigeria). Dika wax was obtained from a batch processed in our laboratory. All other reagents and solvents were analytical grade and were used as supplied.
Extraction of dika wax
Irvingia gabonensis were purchased from Nsukka market, Enugu State, Nigeria, in the month of March 2010. The seed material was authenticated by Mr. A.O. Ozioko, a consultant taxonomist with the International Center for Ethnomedicine and Drug Development (InterCEDD) Nsukka, Nigeria, and the voucher specimen (No. 151) has been deposited in the herbarium of the Department of Pharmacognosy and Environmental Medicines, University of Nigeria, Nsukka. Dika wax was extracted from the seeds of Irvingia gabonensis by soxhlet extraction. The seeds were milled with a hammer mill (500# grinder/Fuyu Metal, Linyi Fuyu Metal Products Co., Ltd, China) and extracted in a soxhlet extractor using n-hexane (Matos et al., Citation2009; Chime et al., Citation2012). The n-hexane was allowed to completely evaporate at room temperature. The extracted fat was successively depolymerized using boiling water and ethylacetate and further purified by passing it through a column of activated charcoal and bentonite (2:1) at 100 °C at a ratio of 10 g of wax and 1 g of the column material (Attama & Nkemnele, Citation2005; Obitte et al., Citation2013). The wax was stored in a refrigerator until used.
Formulation of structured lipid matrices
The structured lipid matrices were prepared by fusion using mixtures of soybean oil and dika wax at ratios of 1:19, 1:9, 1:6, 1:4, 1:3, and 1:2, respectively. In each case, the lipids were weighed using analytical balance (Adventurer, Ohaus, China), melted together in a crucible using a water bath and stirred with a glass stirrer at a temperature of 70 °C, until a homogenous, transparent yellow melt was obtained. The homogenous mixture was stirred at room temperature until solidification (Umeyor et al., Citation2012; Obitte et al., Citation2013).
Characterization of lipid matrices
Differential scanning calorimetric analysis
Melting transitions and changes in heat capacity of the physically structured lipid matrices were determined using a calorimeter (Netzsch DSC 204 F1, Germany). About 1 mg of each lipid matrix was weighed into an aluminum pan, hermetically sealed, and the thermal behavior was determined in the range of 10–80 °C at a heating rate of 5 °C/min. The temperature was held at 80 °C for 10 min and thereafter, cooled at the rate of 5 to 10 °C/min. Baselines were determined using an empty pan, and all the thermograms were baseline corrected.
Wide-angle X-ray diffraction analysis
Wide-angle X-ray diffraction (WAXD) studies were carried out using an X-ray generator PW3040/60 XPert PRO (Fabr.: DY2171 PANalytical, Almelo, The Netherlands) connected to the tube (PW3373/00 DK147726 Cu LFF) copper anode, which delivered X-ray of wavelength, k = 0.1542 nm at a high voltage of 40 kV and an anode current of 25 mA. WAXD measurements were taken with a Goniometer (PW3050/60 MPD-System, PANalytical, The Netherlands) from 3.0° to 33.0° in 0.015° steps (1 s per step). The interlayer spacing was calculated from the reflections using Bragg’s equation (Equation Equation1(1) ). WAXD diffractograms were obtained for all the lipid matrices as well as the dika wax.
(1)
where λ is the wavelength of the incident X-ray beam, n is a positive integer that describes the order of the interference, and θ is the scattering angle. The parameter d, otherwise called the interlayer spacing, is the separation between a particular set of planes of the crystal lattice structure (Attama et al., Citation2006).
Small angle X-ray diffraction analysis
This technique was used to analyze the long-range order of the crystalline structure of the lipid matrices. Characteristic Cu-Kα radiation with a wavelength of 0.1542 nm was produced by an X-ray tube (PW2213/20, Feinfokus Cu-Anode) connected to a PW1730/10 generator (PANalytical, The Netherlands) and a Goniometer (PW1050/25, PANalytical, The Netherlands) was used to detect the small-angle scattering. To reduce the Kβ radiation, the X-ray beam was passed through a nickel filter. Tube voltage was set to 40 kV with an anode current of 25 mA. Measurement time was set at 600 s for all the lipid matrices and small angle X-ray diffraction (SAXD) reference systems. Lipid samples were put in aluminum cubes and equilibrated for 10 min at 20 °C before taking the measurements. The interlayer spacing was thereafter calculated using Bragg’s equation (Equation Equation1(1) ). SAXD diffractograms were obtained for all the lipid matrices as well as the dika wax (Attama et al., Citation2006).
Formulation of the microparticles
The artesunate-loaded SLMs were prepared using the hot melt homogenization technique (Attama et al., Citation2009) according to the formula presented in . In each case, 10 g of the lipid matrix was melted at 70 °C on a water bath and an appropriate amount of artesunate was incorporated into the lipidic melt. Sorbitol was dissolved in hot distilled water at the same temperature with the lipidic melt together with Tween 80 and thiomersal. The hot aqueous phase was poured into the lipidic melt and immediately subjected to high shear homogenization with Ultra-Turrax (T25 Basic, Digital, Ika Staufen, Germany) at 5000 rpm for 10 min. SLMs containing no drug (unloaded SLMs), which served as negative control were also formulated. Each batch of SLMs were divided into two equal parts and one part was lyophilized using freeze dryer (Amsco/Finn – Aqua® Lyovac GTZ, Germany) (pressure was <0.1 mbar with a corresponding ice temperature ≤40 °C), while the remaining 50 ml was stored as emulsion in order to study the particle size over time. This is because of the possibility of using this preparation parenterally.
Table 1. Formulation compositions of the SLMs.
Particle size and morphology determination
The particle size of the microparticles was determined in a time-dependent manner (1 day, 30 days, and 90 days) by computerized image analysis of at least 50 microparticles. Each of the batches was placed on a microscope slide, covered with a cover slip, and imaged under a binocular microscope (Lieca, Germany) attached with a Motic image analyzer (Moticam, China), at a magnification of ×400. The particle morphologies were also observed and photomicrographs taken.
Time-dependent pH stability studies
The pH of dispersions of drug loaded and unloaded lipid microparticles were determined in a time-dependent manner: 1 day, 30 days, and 90 days using a pH meter (pH ep® Hanna instrument, Padova, Italy) in order to ascertain if there was any form of degradation during the storage.
Drug content and encapsulation efficiency analysis
The drug content was determined by measuring the free drug concentration in the aqueous phase. Microsphere dispersion was separated using a centrifuge (Chem. Lab. Instrument, UK) at 1252 × g for 30 min. The obtained aqueous phase was filtered through a 0.22 μm membrane filter (Sigma–Aldrich, Germany), diluted properly with 0.1 N NaOH and analyzed in spectrophotometer (UNICO 2102 PC UV/Vis Spectrophotometer, USA) at a predetermined wavelength of 291 nm. The drug content was calculated using a calibration curve prepared from standard artesunate in 0.1 N NaOH. All measurements were in triplicates.
The encapsulation efficiency (EE%) of the drug in the microparticles was calculated from the equation:
(2)
where TDC is the weight of drug added to the formulation, while ADC is the analyzed weight of the drug in the SLMs (Brown et al., Citation2013).
Drug loading capacity
Loading capacity (LC) expresses the ratio between the entrapped active pharmaceutical ingredient (API) and the total weight of the lipids (Attama et al., Citation2009; Umeyor et al., Citation2012; Chime et al., Citation2013a, Citation2013b). LC was determined using the relationship:
(3)
where WL is the weight of lipid in the formulation, WD is the weight of drug entrapped by the lipids.
Lyophilization of SLMs
The batches of SLMs with high encapsulation efficiencies were lyophilized using freeze–dryer (Amsco/Finn – Aqua® Lyovac GTZ, Germany), in order to obtain a solidified water-free microparticles. The lyophilized SLMs were employed for the in vitro and in vivo studies.
In vitro release studies
The USP paddle method was adopted in this study. The dissolution medium consisted of 900 ml of freshly prepared simulated intestinal fluid (pH 7.2) maintained at 37 ± 1 °C. The polycarbonate dialysis membrane (MWCO 6000–8000, Spectrum Labs, Brenda, The Netherlands) selected as release barrier was pretreated by soaking in the dissolution medium for 24 h prior to use. A quantity of SLMs equivalent to 100 mg artesunate was weighed from each batch of the artesunate-loaded SLMs and placed in the polycarbonate dialysis membrane containing 2 ml of the dissolution medium, securely tied with a thermoresistant thread and placed in the chamber of the release apparatus. The paddle was rotated at 100 rpm, and at predetermined timed intervals, 5 ml portion of the dissolution medium was withdrawn, appropriately diluted, and analyzed for drug content in a spectrophotometer (UNICO 2102 PC UV/Vis Spectrophotometer, USA) at a predetermined wavelength of 291 nm. The volume of the dissolution medium was kept constant by replacing it with 5 ml of fresh medium after each withdrawal to maintain sink condition. The amount of drug released at each time interval was determined with reference to Beer’s Plot.
In vitro release kinetics
The dissolution data for the SLMs were analyzed to determine the in vitro release kinetic mechanism using four kinetic models including the zero order, first order, Higuchi square root equation, and Ritger-Peppas empirical model as shown in Equations Equation4–7.
(4)
(5)
(6)
(7)
where Q is the release percentage at time, t, and k0,k1, k2, and k3 are the rate constants of zero-order, first-order, Higuchi and Ritger-Peppas models, respectively (Rawat et al., Citation2011; Singh et al., Citation2011; Chime et al., Citation2013a). Mt/M∝ is fraction of drug released at time t, n is diffusion exponent and is an indicator of the mechanism of transport of drug through the polymer, and k is kinetic constant (having units of t−n), incorporating structural and geometric characteristics of the delivery system (Chime et al., Citation2013b).
In vivo pharmacodynamic studies
A modified Peter’s 4-day suppressive test against P. berghei infection in mice was employed (Peters et al., Citation1993). Healthy Wistar mice (30–35 g) of both sexes divided into three groups of five mice per group was used for the study. All animal experimental protocols were carried out in accordance with guidelines of the Animal Ethics Committee of the Faculty of Pharmaceutical Sciences, University of Nigeria, Nsukka and EU Directive 2010/63/EU for animal experiments. Ab initio, the rats were acclimatized to the new experimental environment for 2 weeks at room temperature 28 °C, housed separately in cages. They were allowed free access to food and water throughout this study. An appropriate volume of blood necessary to give 108 P. berghei cells/ml dilution with normal saline was obtained from plasmodium donor mice using the equation:
(8)
where V1 is the volume of blood needed to be withdrawn from the donor mice via cardiac puncture; V2 is the volume of blood/normal saline solution enough to give 0.2 ml to each of the 12 mice (3 ml); C1 is the amount of red blood cell (RBC) parasitized in the donor mice blood [via malaria parasite (MP) cell counting]; C2 is equivalent to 108 cells/ml, a standard quantity of cells equivalent to the 0.2 ml of V2. All the mice in the three groups were inoculated with 0.2 ml of V2 via intra peritoneal route and monitored for 72 h before drug administration. The daily rectal temperature measurement alongside baseline percentage parasitaemia establishment was used to assess the attainment of an appreciable percentage parasitaemia of at least 1% after 72 h. After 72 h when an appreciable percentage parasitaemia was obtained, an amount of artesunate-loaded SLMs equivalent to 4 mg/kg of the drug was reconstituted with 0.5 ml of water and administered orally to the rats using a 1 ml syringe. The control group received normal saline 5 ml/kg while, the reference group received artesunate tablet (MD – artesunate, 100 mg from Globela Pharma Pvt. Ltd, India) equivalent to 4 mg/kg, crushed using mortar and pestle and dispersed in 0.5 ml of water. The animals were treated daily for 4 days. At the end of every 24 h, 1 ml of blood was withdrawn from the retro-orbital venous plexus of the rats. Microscopic determination of the MP in the mice blood was carried out using Giemsa-stained thin film quadruplet field view. Subsequently, the percentage of parasitaemia in the blood was calculated using the expression:
(9)
where P1 is the number of parasitized RBC and P2 is the number of non-parasitized RBC.
In addition, the treated as well as the control animals were checked for a reduction in body temperature by using rectal thermometers (Jindal Med. and Scientific Instrument). This was done every 24 h before each daily drug administration starting from the day prior to drug administration (Dikasso et al., Citation2006).
Statistical and data analysis
Data were analyzed using SPSS Version 16.0 (SPSS Inc. Chicago, IL). All values were expressed as mean ± SD. Data were analyzed by one-way ANOVA. Differences between means were assessed using student’s t-test. p < 0.05 was considered statistically significant.
Results
Characterization of lipid matrices
Differential scanning calorimetry
The results of the differential scanning calorimetry (DSC) thermograms of dika wax and the lipid matrices presented in and showed that the DSC thermograms of dika wax showed a sharp endothermic peak at 44.3 °C. The thermograms of lipid matrices 1:19, 1:9, 1:6, 1:4, and 1:3 also showed sharp endotherms with peaks at 44.7, 44.7, 47.0, 46.3, and 44.8 °C, respectively.
Figure 1. DSC thermograms of: (a) dika wax, (b) lipid matrix 1:19, (c) lipid matrix 1:9, (d) lipid matrix 1:6, (e) lipid matrix 1:4, and (f) lipid matrix 1:3.
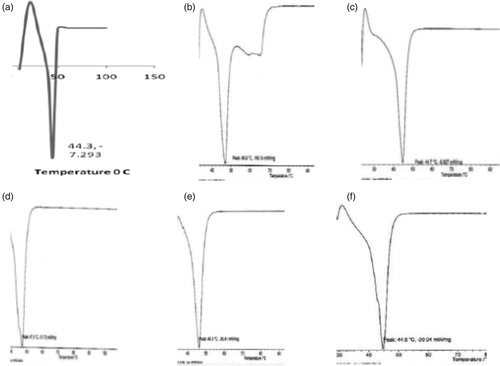
Table 2. DSC results of the lipid matrices.
Small angle X-ray diffractions
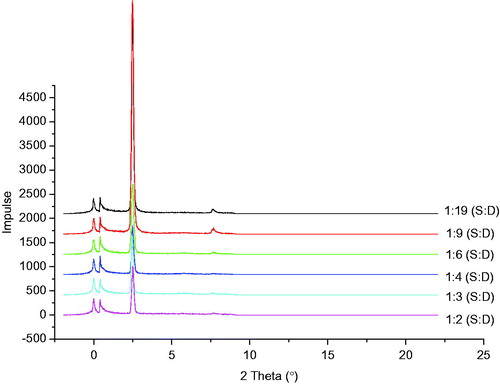
The results of the SAXD analysis of structured lipid matrices containing different ratios of soybean oil and dika wax are shown in . From the diffractograms, two prominent reflections occurred at 2θ = 2.49°, d = 3.55 Å and 2θ = 0.39°, d = 22.70 Å for the lipid matrix 1:19 showing the presence of dika wax at 2θ = 2.49°, d = 3.55 Å and soybean oil at 2θ = 0.39°, d = 22.70 Å. Also, lipid matrix 1:9 exhibited two major reflections at 2θ = 2.47° and d = 0.44 Å and 2θ = 0.39° and d = 0.60 Å. Lipid matrices 1:6 and 1:4 (soybean oil:dika wax) showed two prominent reflections at 2θ = 2.49°, d = 3.55 Å, and 2θ = 0.41° and d = 21.54 Å, respectively. Lipid matrix 1:3 had two prominent reflections at 2θ = 2.44° and d = 3.62 Å and 2θ = 0.41° and d = 21.54 Å, while structured lipid matrix containing lipid ratios of 1:2 (soybean oil: dika wax) also showed two prominent reflections at 2θ = 2.50° and d = 3.53 Å and 2θ = 0.41° and d = 21.54 Å.
Figure 2. SAXD differactograms of different batches of structured lipid matrices formulated with different ratios of soybean oil and dika wax. S:D = soybean oil: dika wax.
Wide angle X-ray diffractions
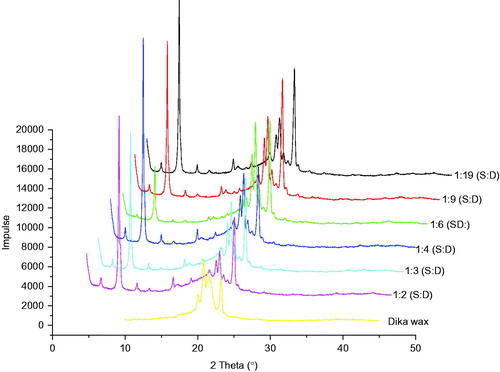
WAXD diffractograms of the lipid matrices are shown in . From the results, the WAXD diffractogram of the dika wax showed a strong reflection at 2θ = 20.83°, d = 0.42 Å, 2θ = 20.96°, d = 0.42 Å, corresponding to the stable β modification with triclinic chain packing. Other reflections of medium and low intensities characteristic of dika wax occurred at 2θ = 23.19°, d = 0.38 Å and 2θ = 20.06°, d = 0.44 Å. These reflections remained unchanged in position when mixed with soybean oil. Thus, these reflections persisted, showing high intensity as other reflections listed earlier as shown in .
Figure 3. WAXD diffractograms of different batches of structured lipid matrices formulated with different ratios of soybean oil and dika wax. S:D = soybean oil: dika wax.
Particle size and morphology of SLMs
The photomicrographs of the loaded and unloaded SLMs presented in showed that the shapes of the artesunate-loaded SLMs formulated were spherical. The results of particle size analysis of the formulated SLMs studied over time are presented in ). From the results, the unloaded SLMs containing no drug generally had particle size significantly lower than the drug-loaded SLMs (p < 0.05). The particle size of artesunate-loaded SLMs formulated with lipid matrix ratio 1:19 (soybean oil:dika wax) ranged from 80.00 ± 0.15 µm to 84.00 ± 0.20 µm for A2 and A3 SLMs containing 1.5 and 2% artesunate at day 1. Also, the particle size of artesunate-loaded SLMs formulated with lipid matrix ratio 1:6 (soybean oil:dika wax) at day 1 ranged from 83.00 ± 0.20 µm to 90.00 ± 0.09 µm for batches B1 to B4, while artesunate-loaded SLMs formulated with lipid matrix ratio 1:3 (soybean oil:dika wax) ranged from 80.00 ± 0.15 µm to 85.00 ± 0.22 µm (). Therefore, batches B1 to B4 formulated with lipid matrix 1:6 generally exhibited higher particles size values than other batches at day 1 as shown in .
Figure 4. Photomicrographs (at day 1) of SLMs formulated with lipid matrices 1:19, 1:6 and 1:3 and containing 2.5 g of artesunate, A4, B4 and C4.
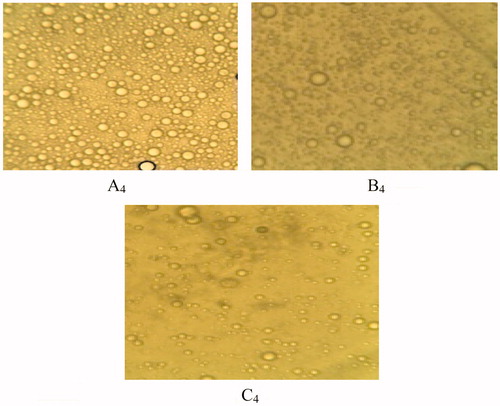
Figure 5. Particle size of artesunate-loaded and unloaded SLMs over time (a): A1 – A5 were formulated with LM 1:19, (b): B1 – B5 were formulated with LM 1:6 and (c): C1 – C5 were formulated with LM 1:3 and different concentrations of artesunate, while A5, B5, and C5 contain no API; □, day 1; ▪, 30 days and ▪, 90 days for a, b and c, respectively.
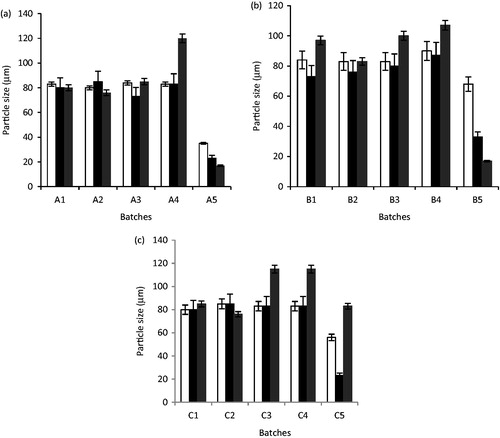
The effect of aging on the particle size of the SLMs showed that the particle size of the unloaded SLMs significantly decreased from 1 to 90 days as shown in (p < 0.05). For the artesunate-loaded SLMs, the particle size of the microparticles increased with time in most of the formulations; however, a few formulations containing artesunate had a decrease in the particle size of the SLMs (batches A1, A2, and C2). Also, contrary to the the particle size results obtained at day 1, the SLMs showed the highest particle size of 120.00 ± 0.42, 115.00 ± 0.64, and 115.00 ± 0.64 µm, respectively, at 90 days.
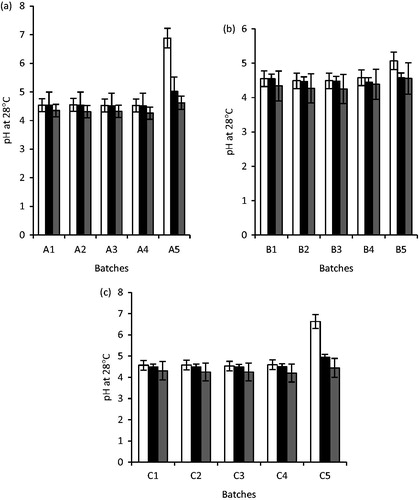
Time-dependent pH stability studies of the formulations
The results of the pH studies of the artesunate-loaded SLMs as well as the unloaded SLMs are presented in . From the results, the pH of the unloaded SLMs ranged from 5.07 ± 0.01 to 6.88 ± 0.02 at day 1, for A3 and A1 SLMs and decreased significantly from 30 to 90 days (p < 0.05). For the artesunate-loaded SLMs, the pH of the formulations at day 1 ranged from 4.53 ± 0.01 to 4.59 ± 0.02 in all the formulations. However, the pH of the artesunate-loaded SLMs also declined over time as shown in .
Figure 6. The pH of unloaded and artesunate-loaded SLMs (a): A1 – A5 were formulated with LM 1:19, (b): B1 – B5 were formulated with LM 1:6 and (c): C1 – C5 were formulated with LM 1:3 and different concentrations of artesunate, while A5, B5 and C5 contain no API; □, day 1; ▪, 30 days and ▪, 90 days for a, b and c, respectively.
EE% and loading capacity
The results of EE% and LC of artesunate-loaded SLMs are shown in . From the results, the formulations generally exhibited high EE% of 79.0 to 80.60% for C4, B4, and A4 SLMs, containing 2.5% w/w of artesunate, respectively. The EE% and LC increased with increase in the amount of artesunate loaded into the formulations. Also, maximum LC of 32 mg of drug/100 mg lipid was obtained for artesunate-loaded SLMs containing 2.5% w/w drug (A4, B4, and C4).
Table 3. Some properties of artesunate-loaded SLMs.
In vitro release of artesunate
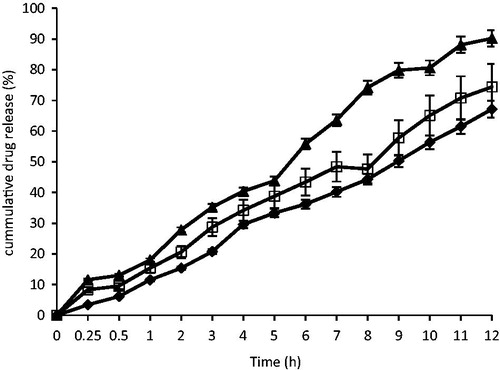
The in vitro dissolution profiles of the optimized artesunate-loaded SLMs and the market brand of artesunate tablets (100 mg artesunate tablet) are shown in . From the results, at T0.5 (0.5 h) 3.43, 8.33, and 11.6% of artesunate were released from batches A4, B4 and the standard artesunate tablet (STD). At T4 (4 h), about 29.6, 34.2, and 40.4% of artesunate were released from batches A4, B4, and the standard artesunate tablet (STD). Also, at T7 (7 h), about 40.2, 48.4, and 63.6% of artesunate were released from batches A4, B4, and the standard artesunate tablet (STD) and at T12 (12 h), 67.13, 74.4, and 90.2% of artesunate were released from batches A4, B4, and the standard artesunate tablet (STD). The formulations exhibited good sustained release properties required for once daily administration.
Figure 7 In vitro release profile of artesunate from SLMs; ♦ - A4, □-B4, ▴ – STD, batches A4 and B4 were formulated with lipid matrices 1:19 and 1:6 and contain 2.5% artesunate, respectively; STD is the artesunate tablet (reference).
In vitro release kinetics
The results of the in vitro drug release kinetics of artesunate from the SLMs formulated with lipid matrices 1:19 and 1:6 (A4 and B4, respectively) are shown in and show that the zero-order and first-order release kinetics gave linear regression coefficient (r2). Also, Higuchi models also showed high level of linearity and had the highest release rate constants for both formulations, showing that diffusion was the predominant release mechanism. Ritger-Peppas model was also linear for both batches of SLMs and also gave n values of 0.736 and 0.578 for A4 and B4, respectively.
Table 4. Drug release kinetics of artesunate-loaded SLMs.
Pharmacodynamic properties
Anti-malarial properties
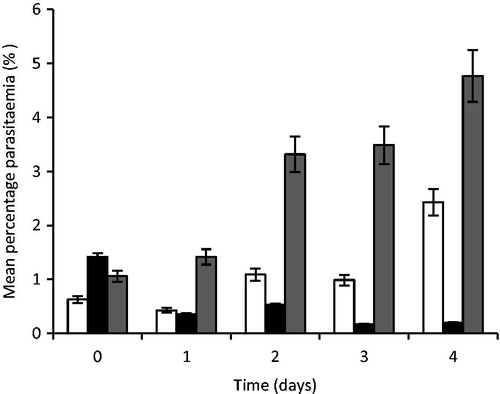
The results of the anti-malarial properties of artesunate-loaded SLMs are shown in . From the results, the artesunate-loaded microparticles exhibited good anti-malarial properties significantly different from the control in the entire mouse used for the study (p < 0.05). On day 1 of treatment, the mouse had mean percent parasitaemia of 0.43 ± 0.62, 0.36 ± 0.42, and 1.42 ± 0.77% for the groups that received standard artesunate tablet used as the reference (STD), artesunate-loaded SLMs (TARF), and the control (CTL), respectively. On the second day of treatment, the mouse also exhibited percent parasitaemia of 1.09 ± 0.46, 0.53 ± 0.67, and 3.32 ± 1.26%, respectively, for the standard (STD), artesunate–loaded SLMs (TARF), and the control (CTL). Also on day 3, the mouse exhibited 0.99 ± 0.49, 0.17 ± 0.33, and 3.55 ± 1.02% parasitaemia for the standard (STD), artesunate–loaded SLMs (TART), and the control (CTL), respectively, while on the fourth day, 2.43 ± 0.50, 0.20 ± 0.40, and 4.77 ± 0.43% parasitaemia were obtained for the standard (STD), artesunate –loaded SLMs (TARF), and the control (CTL), respectively. Therefore, the mice that received the artesunate tablets (STD) exhibited an increase in the percentage of parasitaemia just like the control while, the group that received the artesunate-loaded SLMs (TARF) exhibited significant (p < 0.05) reduction in parasitaemia level over the study period as shown in .
Figure 8. Percent parasitaemia of mouse treated with artesunate-loaded SLMs. Significant at p < 0.05 compared to control. Values shown are mean ± SD (n = 5). □, STD; ▪, TARF; ▪, CTL; TARF representents group that received the artesunate-loaded SLMs the artesunate-loaded SLMs; STD received the standard artesunate tablet, while group CTL (control) received normal saline.
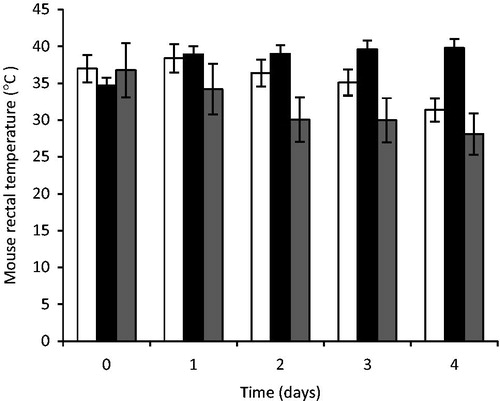
Rectal temperature
The rectal temperatures of the mouse measured during the treatment period are shown in . From the results, it was observed that the rectal temperature of mice in the group that received artesunate-loaded SLMs (TARF) increased with a corresponding decrease in percentage parasitaemia while the group that received the standard artesunate tablets had a decrease in the rectal temperature with an increase in the percentage of parasitaemia especially on day 4. There was also an appreciable decrease in the daily rectal temperature of the mice in the control group with a consistent increase in percentage parasitaemia. However, the mouse treated with TARF had their rectal temperatures maintained very near to the normal rectal temperature of mice unlike the standard and the control groups.
Figure 9. Rectal temperature of mouse treated with artesunate-loaded SLMs. Significant at p < 0.05 compared to control. Values shown are mean ± SD (n = 5). □, STD; ▪, TARF; ▪, CTL; TARF representents group that received the artesunate-loaded SLMs the artesunate-loaded SLMs; STD received the standard artesunate tablet, while group CTL (control) received normal saline.
Discussions
Characterization of lipid matrices
Differential scanning calorimetry
The DSC results of the dika wax showed that it is a high purity lipid because of the sharp melting peak exhibited by this lipid. Also, the DSC results of the lipid matrices showed that the structuring of dika wax with soybean oil generally produced matrices with minor changes in the melting enthalpies. This shows that there was only a minor modification of the microstructure of dika wax as a result of inclusion of soybean oil. Consequently, two separate transitions were not obtained as the soybean oil was uniformly dispersed in the dika wax. However, minor shift in transition temperature as observed would occur in addition to minor change in enthalpy of the transition in accordance with the thermotropic behavior of lipid mixtures (Attama et al., Citation2006). This may be due to the fatty acid composition of the lipids. The minor increase in the enthalpy suggested that the lipid matrices generated imperfect matrices due to distortion of crystal arrangement of dika wax after melting and solidification (Sanna et al., Citation2004; Jaspart et al., Citation2005; Attama & Muller-Goymann, Citation2006; El-Kamel et al., Citation2007; Umeyor et al., Citation2012). The varied fatty acid contents of these lipids may have interacted in such a manner as to slightly disorder the crystal arrangement of the dika wax, which may have created spaces for drug localization (Attama & Muller-Goymann, Citation2007; Umeyor et al., Citation2012).
Small angle X-ray diffractions
Many lipids are known to arrange themselves in layered structures with a repeat distance of few nanometers, thus giving rise to Bragg reflections in the small angle region. The repeat distances correspond to the thickness of the lipid bilayer (Attama et al., Citation2006). Rational combination of dika wax and soybean oil could provide an array of lipid matrices for the drug formulator considering the increasing interest in lipid drug delivery system and the natural origin of these two lipids. Natural lipids have been shown to be better tolerated than semi-synthetic lipids (Kim et al., Citation2005). From the results of the SAXD studies, incorporation of soybean oil into the dika wax provided structured lipid matrices that were found to be nonlamellar, thus highlighting the fact that the crystal arrangement of the dika wax was disorganized. Lipid matrices with a certain degree of disorder are considered to be ideal for formulation of microparticulate lipid carriers due to their high active ingredient payload capacity (Attama et al., Citation2006). Therefore, lipid matrices 1:3 and 1:6 (soybean oil:dika wax) having very high amount of soybean oil can be used in formulating microparticles in order to solve this problem.
Wide angle X-ray diffractions
WAXD analysis of lipid matrices gives information on the crystalline state of the matrices, as it reveals the dimensions of the short spacing of the unit cells. WAXD analysis gives further insights on the preferred orientation and crystallinity of the samples with emphasis on the orderliness of the crystal arrangement (preferred orientation) and the ratio of the crystalline properties to the non-crystalline properties (Attama et al., Citation2006). From the WAXD results of the dika wax and the lipid matrices presented in , all the lipid matrices presented sharp reflections in the wide-angle region, indicating that some of the hydrocarbon chains of the matrices are stiff and fully extended (Moghimi et al., Citation1996). The reflections at 2θ = 23.19°, d = 0.38 Å and 2θ = 20.06°, d = 0.44 Å may be due to the crystalline nature of the lipids and are characteristically produced by crystalline lipids with an orthorhombic perpendicular alkyl chain packing arrangement (Bouwstra et al., Citation1992; Attama et al., Citation2006). Mixtures of dika wax and soybean oil resulted in increase in the reflection intensity of dika wax as a result of increase in the amount of similar fatty acids present. Combination of dika wax and soybean oil thus resulted in lipid matrices where pockets of oils are present in the bulk crystalline dika wax. Presence of pockets of oil and distortion of crystal arrangement of dika wax resulted in some disorder that would increase drug incorporation and holding capacity of lipid matrices as drugs would be entrapped in different sites within the structured lipid matrix (Attama et al., Citation2006). The liquid oil would also solubilize more oil soluble APIs. The overall solid nature of the lipid matrices would permit easy handling and also support preparation of particulate drug delivery system that would prolong and also control drug release. Lipid matrices containing 1:19, 1:6, and 1:3 (soybean oil:dika wax) possess crystal characteristics that will favor drug incorporation.
Particle size and morphology of SLMs
From , it was observed that the particle sizes of the formulations increased over 90 days such that formulations with higher drug concentration had greater increase. This behavior referred to as Ostwald ripening was due to particle aggregation. Ostwald ripening is a spontaneous process that occurs because larger crystals are more energetically favored than smaller crystals. It is so because the formation of many small crystals is kinetically favored (i.e. they nucleate more easily) while, large crystals are thermodynamically favored. Thus, from a standpoint of kinetics, it is easier to nucleate many small crystals. However, small crystals have a larger surface area to volume ratio than large crystals. Molecules on the surface are energetically less stable than the ones already well ordered and packed in the interior. Large crystals, with their greater volume to surface area, represent a lower energy state. Thus, many small crystals tend to attain a lower energy state if transformed into large crystals and this is actually what happens with Ostwald ripening (Boistelle & Astier, Citation1988). The principle behind the aggregation of the particles over time may be further explained by the DLVO theory, which describes the interacting forces existing between particles to include electrical repulsion forces (VR) and the van der Waals attraction (VA); these parameters are additive (Aulton, Citation1999). In this context, it is very obvious that the particle size after drug incorporation was large compared with unloaded particles such that the interparticulate distance is appreciably small thereby allowing the predomination of the van der Waals universal attractive forces giving rise to larger particles on aggregation.
In , the formulations without API recorded a decrease in particle sizes over the 90 days of observation. This could still be attributed to the DLVO theory. Since the particles had no API loaded in them, the interparticulate distance is appreciably large such that the repulsion between the particles exists. Molecularly, the large interparticulate distance brings about the setting of the secondary minimum. Over time, the particle tends to break-up into smaller particles thereby increasing further the interparticulate distance. As a result, the double-layer repulsion predominates giving a primary maximum in which case at a corresponding large thermal energy (kT) of the particles, this colloidal system thus becomes well dispersed and deflocculated.
Time-dependent pH stability studies of the formulations
The pH of the formulations increased after 30 days and later declined after 90 days. This was also applicable to API-free samples whose pH continued to decline throughout the 90 days of observation. The shifting of the pH toward acidity is an evidence of the degradation of the triglyceride molecules of the various lipid components of the lipid matrices into their various fatty acids giving rise to the decline in pH of both samples with API and those without API (Umeyor et al., Citation2012, Chime et al., Citation2012). However, with respect to the API containing formulation, the change in pH from its post-formulation pH is very minimal to alter the expected activity of the API, as the degradation was only on the lipid matrix. This is congruent with Vivek et al (Citation2007), who found out that the use of solid lipids is an attractive innovation that is advantageous because the solid lipid provides more flexibility in controlling the drug release and protects the encapsulated ingredients from chemical degradation. It was also observed that the magnitude of change in pH was lower in the formulation with API unlike that of the formulation without API. This result however shows a proof of stability of the formulation on storage for 90 days after reconstitution. Thus, in terms of stability, the formulation can be used as a multi-dose reconstitutable preparation.
EE% and loading capacity
The EE% and the LC were seen to increase with increasing concentration of the API as shown in . Thus, formulations with API of concentration 2.5% showed the highest EE% and LC. The increase however continues until the maximum EE% is attained on saturation of the lipid matrix. Efforts to load more drugs beyond the saturation concentration will lead to a decline in the EE% with more free drugs remaining unencapsulated.
In vitro release
The results of the in vitro release of artesunate from the SLMs showed that the optimized artesunate-loaded SLMs exhibited higher sustained release properties significantly different from the reference artesunate tablets (p < 0.05). The formulations gave a gradual and more sustained release of artesunate over the study period. The results showed that artesunate-loaded SLMs could be used once daily for the treatment of malaria at the recommended dose. However, the formulations showed no burst effect as the drug was encapsulated in the inner core of the SLMs.
Drug release kinetics
The results of the in vitro release kinetics studied using four kinetic models showed that the zero-order plots were linear indicating that drug release followed zero-order kinetics model. The first-order plots of cumulative amount remaining versus time showed that drug release also followed first-order release kinetics. Therefore, the drug release followed mixed order of release including the zero and first-order release. Higuchi models gave high linearity, and n values that were above 0.5 for the two batches of SLMs, showing that drug release mechanism followed non-Fickian diffusion release (Higuchi, 1963; Chime et al., Citation2013b). The release rate kinetics (k) for Higuchi model gave release rate constant significantly higher than that of the other models employed in the study confirming that the mechanism of drug release was predominantly by diffusion (Umeyor et al., Citation2012). Ritger-Peppas model seconded Higuchi model in both the regression coefficient and the n values. The n values indicated that drug release followed non-Fickian or anomalous release (0.43 < n < 1.00). Therefore, drug release was by diffusion and erosion in both batches of SLMs (non-swellable spheres) (Ritger & Peppas, Citation1987; Chime et al., Citation2013a, Citation2013b).
Anti-malarial properties
From the data generated from the Giemsa stain test in , the mice treated with artesunate-loaded SLMs (TARF) and control (CTL) groups had higher base line percentage parasitaemia than those treated with the reference (STD). This made the percentage parasitaemia of the TARF to be higher than that of reference (STD) after day 1 treatment. Surprisingly, it was observed that the magnitude of the reduction in the percentage parasitaemia of the mouse group treated with TARF declined exponentially compared with the group treated with STD, which showed a slight decline. Subsequently, although there were decrease in percentage parasitaemia in both STD and TARF groups with time, the TARF groups had a higher and more consistent magnitude of reduction, while those of the reference groups (STD) recorded initial reduction in percentage parasitaemia on day 1 to day 3 only after which it recorded a sharp upsurge in percentage parasitaemia similar to the increase in parasitaemia found in the control (untreated group) on day 4. The high and consistent decrease in the percentage parasitaemia for TARF groups could be due to the fact that the test drug had a sustained release action. Therefore, the encapsulated drug was gradually released over the test periods. There was consistent suppression of the actively multiplying plasmodium over the 24 h giving rise to a daily consistent reduction in percentage parasitaemia for TARF groups.
The mice that received the reference drug formulation, artesunate tablets (STD) had an unsatisfactory action against the plasmodium when compared with the TARF groups, since the reference group recorded a higher daily percentage parasitaemia comparable with the percentage parasitaemia of the control group. This increase in daily percentage parasitaemia could be attributed to the fact that the crushed plain artesunate tablet released the entire drug within 30 min to 2 h. At such an early stage, there would be suitable plasmodium suppression, but over the remaining 22 h when no further drug release occurred, the plasmodium cells multiplied to withstand the effects of the available drug released, leading to increase in percentage parasitaemia after 24 h. It is known that plasmodium replicates between 18 and 36 h (Ponts et al., Citation2010). However, the outrageous increase in the percentage parasitaemia similar to the percentage parasitaemia of the control group on day 4 could be attributed to the development of resistance by the plasmodium treated with the tablets due to the short time of effective anti-parasitic activity. This is the reason why plain artesunate tablet was dosed twice daily so as to provide sufficient blood levels of artesunate for anti-parasitic activities within 24 h. The control groups received no drug, thus as expected had the highest percentage parasitaemia as the plasmodium cells kept on multiplying without suppression.
The effects of the drugs on the mice rectal temperature
Plasmodium parasites feed on erythrocyte hemoglobin and uses a heme detoxification mechanism that results in the formation of an insoluble, inert, dark-brown crystalline metabolic waste called hemozoin (Hz) (Tiemi-Shio et al., Citation2009). The Hz is involved in the fever observed during the malaria process as intravenous injection of Hz caused thermal deregulation and was associated with the induction of pyrogenic cytokines (Tiemi-Shio et al., Citation2009). In addition, the release of both Plasmodium-derived Hz and merozoites during the erythrocyte burst phase of the disease coincides with the massive induction of proinflammatory cytokines, such as interleukin (IL)-1β) and tumor necrosis factor, and with the periodic fevers characteristic of malaria (Tiemi-Shio et al., Citation2009).
From the results of rectal temperature of the mice presented in , the rectal temperature of the mouse in the various groups was observed during the treatment. With respect to the baseline rectal temperature after establishment of sufficient percentage parasitaemia, it was observed that the rectal temperature of the mice of the group that received the artesunate-loaded SLMs (TARF) increased with a corresponding decrease in percentage parasitaemia where as the group of mice that received the reference artesunate tablets (STD) had decreased rectal temperature with increasing percentage parasitaemia, especially on day 4, although an outrageous increase in parasitaemia was recorded. There was also an appreciable decrease in the daily rectal temperature of the mouse in the control group with a consistent increase in percentage parasitaemia. However, this finding precisely agrees with the work of Dikasso et al. (Citation2006), who found out that the body temperature of mice decreased in a rapid manner with increasing parasitaemia and vice versa, contrary to the situation in human subjects. However, the mice treated with the artesunate-loaded SLMs (TARF) had its rectal temperatures maintained very near to the normal rectal temperature unlike the group that received the reference tablets (STD) and the control groups.
Conclusions
Structured lipid matrices consisting of soybean oil and dika wax could be used to formulate artesunate-loaded SLMs for improved anti-malarial properties. From the results of this study, the artesunate-loaded SLMs exhibited good sustained release properties for once daily administration. The artesunate-loaded SLMs also exhibited good anti-malaria properties significantly higher than artesunate tablets used as the reference, which may be due to high sustained release properties of the formulations. Therefore, artesunate-loaded SLMs based on dika wax structured lipid matrices could be administered orally, once daily or under controlled conditions could also be given parenterally for the treatment of malaria.
Acknowledgements
The authors wish to thank Ursula Jahn of Technical University of Braunschweig, for X-ray analysis. We also thank Phospholipid GmbH, Köln, Germany and Emzor Pharmaceutical Limited, Lagos, Nigeria for providing samples of Phospholipon 90G and artesunate, respectively.
We also wish to immensely thank Alexander von Humboldt Foundation, Bonn-Bad Godesberg, Germany for donating some of the equipment used in this work.
Declaration of interest
The authors state no conflicts of interest and have received no funding for the research or in the preparation of this manuscript.
References
- Attama AA, Muller-Goymann CC. (2006). A critical study of novel physically structured lipid matrices composed of a homolipid from Capra hircus and theobroma oil. Int J Pharm 322:67–78
- Attama AA, Muller-Goymann CC. (2007). Investigation of surface-modified solid lipid nanocontainers formulated with a heterolipid-templated homolipid. Int J Pharm 334:179–89
- Attama AA, Nkemnele MO. (2005). In vitro evaluation of drug release from self micro-emulsifying drug delivery systems using a biodegradable homolipid from Capra hircus. Int J Pharm 304:4–10
- Attama AA, Okafor CE, Builders PF, Okorie O. (2009). Formulation and in vitro evaluation of a PEGylated microscopic lipospheres delivery system for ceftriaxone sodium. Drug Deliv 16:448–616
- Attama AA, Schicke BC, Müller-Goymann CC. (2006). Further characterization of theobroma oil beeswax admixtures as lipid matrices for improved drug delivery systems. Eur J Pharm Biopharm 64:294–306
- Aulton ME. (1999). Pharmaceutics: the science of dosage form design. Edinburgh, London, New York, Philadelphia, Sydney Toronto: International Student Edition, 94
- Boistelle R, Astier JP. (1988). Crystallization mechanisms in solution. J Cryst Growth 90:14–30
- Bouwstra JA, Gooris GS, Salomons-de vries MA, et al. (1992). Structure of human stratum corneum as a function of temperature and hydration: A wide-angle X-ray diffraction study. Int J Pharm 84:205–16
- Brown SA, Chime SA, Attama AA, et al. (2013). In vitro and in vivo characterisation of piroxicam-loaded dika wax lipospheres. Trop J Pharm Res 12:33–8
- Chime SA, Attama AA, Agubata CO, et al. (2012). Micromeritic and antinociceptive properties of lyophilized indomethacin-loaded SLMs based on solidified reverse micellar solutions. J Pharm Res 5:3410–16
- Chime SA, Attama AA, Builders PF, Onunkwo GC. (2013a). Sustained release diclofenac potassium-loaded solid lipid microparticle, based on solidified reverse micellar solution (SRMS): In vitro and in vivo evaluation. J Microencapsul 30:335–45
- Chime SA, Onunkwo GC, Onyishi IV. (2013b). Kinetics and mechanisms of drug release from swellable and non swellable matrices: a review. Res J Pharm Bio Chem Sc 4:97–103
- Chadha R, Gupta S, Pathak N. (2012). Artesunate-loaded chitosan/lecithin nanoparticles: preparation, characterization, and in vivo studies. Drug Dev Ind Pharm 38:1538–46
- Dikasso D, Makonnen E, Debella A, et al. (2006). In vivo anti-malaria activity of hydroalcoholic extract from Asparaginus africanus in mice infected with Plasmodium berghei. Ethiop J Health Dev 20:112–18
- El-Kamel HA, Al–Fagih MI, Alsarra AI. (2007). Testosterone solid lipid microparticles for transdermal drug delivery formulation and physicochemical characterisation. J Microencapsul 24:457–75
- Higuchi T. (1663). Mechanism of sustained-action medication. Theoretical analysis of rate of release of solid drugs dispersed in solid matrices. J Pharm Sci 52:1145–9
- Hou DZ, Xie CS, Huang K, Zhu CH. (2003). The production and characteristics of solid lipid nanoparticles (SLN). Biomaterials 24:1781–5
- Jaspart S, Piel G, Delatte L, Evrad B. (2005). Solid lipid microparticles: Formulation, preparation, characterization, drug release and applications. Expert Opin Drug Deliv 2:75–87
- Kim DA, Cornec M, Narsimhan G. (2005). Effect of thermal treatment on interfacial properties of beta-lactoglobulin. J Colloid Interface Sci 285:100–9
- Li Q, Weina P. (2010). Artesunate: The best drug in the treatment of severe and complicated malaria. Pharmaceuticals 3:2322–32
- Liu K. (1999). Soybean: chemistry, technology, and utilization. : Aspen Publishers, Inc
- Matos L, Nzikou JM, Pandzou–Yembe VN, et al. (2009). Studies of Irvingia gabonensis seed kernels: Oil technological applications. Pak J Nutri 8:151–7
- Meara ML, Patel CB. (2006). The components acids and glycerides of dika wax. J Agric Food 12:40–57
- Moghimi HR, Williams AC, Barry BW. (1996). A lamellar matrix model for stratum corneum intercellular lipids.1: Characterization and comparison with stratum corneum intercellular structure. Int J Pharm 131:103–15
- Obitte NC, Chime SA, Magaret AA, et al. (2012). Some in vitro and pharmacodynamic evaluation of indomethacin solid lipid microparticles. Afr J Pharm Pharmacol 6:2309–17
- Obitte NC, Chime SA, Attama AA, et al. (2013). Evaluation of the pharmacodynamic properties of indomethacin-loaded lipospheres. Int Res J Pharm Pharmacol 3:77–84
- Ofoefule SI, Chukwu A, Okore VC, Ugwah MO. (1997). Use of dika fat in the formulation of sustained release frusemide encapsulated granules. Boll Chim Farm 136:646–50
- Okore VC. (2000). Effect of dika fat content of a barrier film coating on the kinetics of drug release from swelling polymeric systems. Boll Chim Farm 139:21–5
- Peters W, Robinson BL, Torey G, et al. (1993). The chemotherapy of rodent malaria 1. The activities of some synthetic I, 2, 4-trioxanes against chloroquine-sensitive and chloroquine resistant parasite, part 3: observations Fenozan-5oF a di-fluorated 3,3-spirocyclopentane1, 2,4-trioxane. Annals Trop Med Parasitol 87:111–23
- Pilaniya K, Pilaniya U, Saharan S, et al. (2011). Biodegradable solid lipid microparticles loaded with diltiazem hydrochloride for oral delivery: preparation and in vitro/in vivo evaluation. J Drug Del Ther 1:48–59
- Ponts N, Harris EY, Jacques P, et al. (2010). Nucleosome landscape and control of transcription in the human malaria parasite. Genome Res 20:, 228–38
- Rawat SM, Singh D, Saraf S. (2011). Formulation optimization of controlled delivery systems for antihypertensive peptides using response surface methodology. Am J Drug Dis Dev 1:174–87
- Reithmeier HJ, Herrmann J, Gopferich A. (2001). Development and characterisation of lipid microparticles as a drug carrier for somatostatin. Int J Pharm 218:133–43
- Ritger PL, Peppas NA. (1987). A simple equation for description of solute release 1. Fickian and non- Fickian release from non swellable device in the form of slabs, spheres, cylinders and discs. J Cont Rel 1987:5:23–36
- Sanna V, Kirschvink N, Gustin P, et al. (2004). Preparation and in vivo toxicity study of solid lipid microparticles as carrier for pulmonary administration. AAPS Pharm Sci Technol 5:e27: 17–23
- Shapiro TA, Goldberg DA. (2006). Analgesic-antipyretic and anti-inflammatory agents; pharmacotherapy of gout. In: Goodman and Gilman’s the pharmacological basis of therapeutics, 11th Edition. USA: McGraw-Hill Medical Publishing Division, 1021-7
- Singh J, Gupta S, Kaur H. (2011). Prediction of in vitro drug release mechanisms from extended release matrix tablet using SSR/SR2 techniques. Trends App Sci Res 6:400–9
- Tiemi-Shio M, Eisenbarth SC, Savaria M, et al. (2009). Malarial Hemozoin activates the NLRP3 inflammasome through Lyn and Syk kinases. PLoS Pathog 5,e1000559:1–14
- Umeyor EC, Kenechukwu FC, Ogbonna JD, et al. (2012). Preparation of novel solid lipid microparticles loaded with gentamicin and its evaluation in vitro and in vivo. J Microencapsul 29:296–307
- Vivek K, Reddy H, Murthy RS. (2007). Investigation of the effect of the lipid matrix on drug entrappement, in vitro release and physical stability of olanzepine-loaded solid lipid nanoparticles. AAPS PharmSciTech 8,83:E1–E9
- WHO. (2009). World Malaria Report. World Health Organization: Geneva, Switzerland. 21 February 2010. Available online: http://www.who.int/malaria/publications/atoz/9789241563901/en/index.html/ [last accessed 21 Jul 2010]
- You J, Cui F, Zi Q, et al. (2005). A novel formulation design about water insoluble oily drug: Preparation of Zedoaryl tumeric oil microspheres with self emulsifying ability and evaluation in rabbits. Int J Pharm 288:315–23