
Abstract
Of late, solid self-nanoemulsifying drug delivery systems (S-SNEDDS) have been extensively sought-after owing to their superior portability, drug loading, stability and patient compliance. The current studies, therefore, entail systematic development, optimization and evaluation (in vitro, in situ and in vivo) of the solid formulations of (SNEDDS) lovastatin employing rational quality by design (QbD)-based approach of formulation by design (FbD). The patient-centric quality target product profile (QTPP) and critical quality attributes (CQAs) were earmarked. Preformulation studies along with initial risk assessment facilitated the selection of lipid (i.e. Capmul MCM), surfactant (i.e. Nikkol HCO-50) and co-surfactant (i.e. Lutrol F127) as CMAs for formulation of S-SNEDDS. A face-centered cubic design (FCCD) was employed for optimization using Nikkol-HCO50 (X1) and Lutrol-F127 (X2), evaluating CQAs like globule size, liquefaction time, emulsification time, MDT, dissolution efficiency and permeation parameter. The design space was generated using apt mathematical models, and the optimum formulation was located, followed by validation of the FbD methodology. In situ SPIP and in vivo pharmacodynamic studies on the optimized formulation carried out in unisex Wistar rats, corroborated superior drug absorption and enhanced pharmacodynamic potential in regulating serum lipid levels. In a nutshell, the present studies report successful QbD-oriented development of novel oral S-SNEDDS of lovastatin with distinctly improved biopharmaceutical performance.
Introduction
Oral delivery of drugs exhibiting poor and inconsistent bioavailability gets thwarted owing to their poor aqueous solubility, low permeability, extensive hepatic first-pass effect, intestinal metabolism by cytochrome P450 and/or P-glycoprotein (P-gp) efflux. A number of conventional techniques available for manipulation of oral bioavailability like, micronization, solid dispersions, inclusion complexes, co-crystals, complexation with hydrophilic polymers and supersaturable systems tend to address the issues of poor solubility only (Beg et al., Citation2011; Kawakami, Citation2012). Lipid-based nanostructured drug delivery systems have shown immense promise in enhancing the oral bioavailability of such drugs not only by circumventing the issues of solubility, but also helps in eliminating the aforesaid hiccups of low oral bioavailability (Porter et al., Citation2007, Citation2008).
Of late, the self-nanoemulsifying drug delivery systems (SNEDDS) have become very popular owing to their several meritorious visages like, miniscule globule size, ease of preparation, enhanced biocompatibility and higher stability (Singh et al., Citation2009). Such systems primarily constitute the blend of lipids, surfactants, co-surfactants and/or co-solvents undergoing spontaneous emulsification. Pre-dissolving the drugs in the blend of lipidic and emulsifying excipients omits the disintegration/dissolution steps, which are potential rate-limiting factors for oral absorption of poorly water-soluble drugs (Wu et al., Citation2006; Mu et al., Citation2013). Solid SNEDDS (S-SNEDDS) are relatively more recent technological modifications considered to be most sought after over the liquid SNEDDS, plausibly due to higher drug loading, better portability, improved stability and above all higher patient compliance (Bansal et al., Citation2008; Tan et al., Citation2013). Till date, most literature reports available on S-SNEDDS demonstrates the additional use of solidifying excipients including inert porous carriers, adsorbents, polymers along with equipment-intensive techniques like wet granulation, melt extrusion, extrusion-spheronization and spray drying for transformation of liquid SNEDDS into S-SNEDDS (Tang et al., Citation2008). These techniques involve several hassles like selection of a characteristic solidification method, potential issues of process optimization, scalability and high production costs, thus limiting the frequent adoption of such techniques. Therefore, development of novel S-SNEDDS formulations without employing any inert carrier or expensive machines is called for.
The drug selected for the present investigation, i.e. lovastatin, is a potent competitive inhibitor of HMG-CoA reductase, indicated in the management of hyperlipidemia, familial hypercholesterolemia and related disorders. Being a BCS class II drug, lovastatin exhibits poor oral bioavailability (i.e. <5%), ostensibly owing to poor aqueous solubility, high lipophilicity (log P of 4.26) and extensive hepatic first-pass metabolism (www.rxlist.com). Several approaches already investigated for bioavailability enhancement of lovastatin, including the use of solid dispersions (Patel & Patel, Citation2007; Patel et al., Citation2008; Sheikh, Citation2011), inclusion complexes (Mehramizi et al., Citation2007), supramolecular systems (Sule et al., Citation2009) and nanocrystals; however, yielding limited fruition. Lately, self-microemulsifying drug delivery system (SMEDDS) of lovastatin demonstrated enhanced oral bioavailability and superior pharmacodynamic performance vis-à-vis the conventional suspension and marketed preparation (Singh et al., Citation2010; Goyal et al., Citation2012). However, there is no specific literature report available on the solid self emulsifying formulation of lovastatin for enhancing its oral bioavailability.
Systematic optimization of isotropic systems using design of experiments (DoE) has become a routine practice across the world, both in industrial and academic milieu (Singh et al., Citation2005a). Development of such impeccable systems involves rational bending of a plethora of diverse excipients, like lipids, emulgents, co-emulgents and at times, co-solvents too. Lately, the systematic approach of “formulation by design (FbD)” based on the salient principles of DoE and quality by design (QbD), provides rational understanding of the plausible interaction(s) among the variables and helps in selecting “the best” formulation with minimal expenditure of time, effort and developmental cost vis-à-vis the traditional one factor at a time (OFAT) approach (Singh et al., Citation2005a). The FbD methodology involves defining the quality target product profile (QTPP), identification of critical quality attributes (CQAs), critical material attributes (CMAs) and critical process parameters (CPPs) using screening and risk assessment, optimization data analysis using DoE, modelization and optimum search through response surface methodology (RSM) to embark upon the design space and postulation of control strategy for continuous improvement (Lionberger et al., Citation2008; Singh et al., Citation2011a). The previous experimental studies carried out in our laboratories on diverse nanostructured systems like liquid and S-SNEDDS of carvedilol (Singh et al., Citation2011b, Citation2012) and ezetimibe (Bandyopadhyay et al., Citation2012), solid lipid nanoparticles of quercetin (Dhawan et al., Citation2011), isotretinoin (Raza et al., Citation2013), nanoemulsomes of dithranol (Raza et al., Citation2012) and liposomes of nimesulide (Singh et al., Citation2005b) have vouched the utility of FbD in developing the optimized nanocolloidal formulations.
The attempts, therefore, were made to prepare the novel S-SNEDDS of lovastatin, employing specialized high melting point lipids and emulgents, without employing any solidifying excipients or high-end machine(s). Further, the work endeavors to investigate the evaluation of biopharmaceutical performance of the developed S-SNEDDS for in vitro drug release studies, ex vivo permeability studies, in situ single pass intestinal perfusion (SPIP) studies, and in vivo pharmacodynamic studies in rats.
Materials and methods
Materials
Lovastatin was provided ex-gratis by M/s Ranbaxy Laboratories Ltd, Gurgaon, India, while the lipidic excipients like Gelucire 44/14, Labrafac PG, Labrafac Lipophilic WL 1349, Labrafil M 2125CS, Labrasol and Transcutol HP were received from M/s Gattefosse, Saint-Priest, France. Capmul MCM, Captex 200 and Capmul PG-8 were obtained from M/s Abitec Corp., Columbus, OH. The surfactants, Cremophor EL and Lutrol F127, were obtained from M/s BASF, Mannheim, Germany, while Nikkol HCO-40, HCO-50 and HCO-60 were procured from M/s Nikko Chemicals, Otawara, Japan. All other materials employed during the studies were of analytical grade and were used as such as obtained.
Methods
Defining QTPP and CQAs
Initially, adopting an FbD-based approach of product development for solid self-nanoemulsifying system, the QTPP was set-up encompassing a prospective summary of the quality characteristics of the drug product capable of enhancing the oral bioavailability of lovastatin for achieving maximal therapeutic effects. In order to meet the QTPP, various patient-centric quality attributes (QAs) were identified, such as physical attributes of the drug product, viz. liquefaction and emulsification time (indicative of faster solubilization of the drug in the gastrointestinal fluid), globule size (imperative for discerning the drug release and absorption potential through gastrointestinal tract), mean dissolution time (MDT) and dissolution efficiency (indicators of the dissolution performance of the drug product), drug release (essential for predicting absorption rate of poorly soluble drugs) and amount permeated (indicative of availability of the drugs in the systemic circulation). The nuances of various elements of QTPP in developing S-SNEDDS have explicitly been discussed in . Similarly, illustrates the potential CQAs affecting the biopharmaceutical performance of the S-SNEDDS formulations along with apt justification(s) for each of them.
Table 1. Quality target product profile (QTPP) postulated for S-SNEDDS of lovastatin.
Table 2. Critical quality attributes (CQAs) for S-SNEDDS of lovastatin and their justifications.
Risk assessment
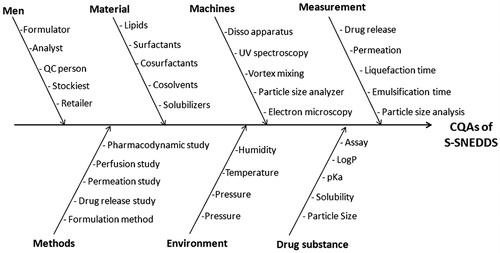
A risk assessment plan was conducted to identify the plausible interaction(s) among drug and excipients with various unit operations, and estimating the chances of risk(s) or failure(s), if any. The Ishikawa fish-bone diagram was constructed employing Minitab 16 software (Minitab Inc., State College, PA) to structure the risk analysis operation for determining the causes and sub-causes affecting the CQAs of drug product. portrays the resultant fish-bone diagram depicting the effect of key material attributes and/or process parameters for the development of S-SNEDDS of lovastatin. Further, the prioritization exercise was carried out for selecting the factors with high risk by constructing the risk estimation matrix (REM) depicting the potential risk(s) associated with each of the material attribute(s) and/or process parameter(s) on the potential CQAs explicatively by assigning low, medium and high values to each of them.
Figure 1. Ishikawa fish-bone diagram depicting the cause-and-effect relationship among the formulation and process variable for formulation of S-SNEDDS.
Preformulation studies and screening of excipients
Equilibrium solubility studies
Equilibrium solubility studies on lovastatin were carried out employing various lipids like Capmul MCM, Capmul PG8, Captex 200, Labrafac PG, Labrafac Lipophilic WL1349, Labrafil M2125CS, and emulgents like polyoxyethylene hydrogenated castor oil derivatives (i.e. HCO-40, HCO-50 and HCO-60), Lutrol F68, Lutrol F127, PEG 6000 and PEG 8000. Excess amount of the drug was added to 2 mL of each excipient in screw-capped vials and stirred for 30 s (Vortex mixer, Remi, Mumbai, India). The sealed vials were subsequently shaken in a water bath shaker (Rivotek, Mumbai, India) for 72 h at 120 strokes per minute at 37 ± 0.5 °C. All the samples were centrifuged at 3000 rpm (402.5g) for 15 min using a laboratory centrifuge (Remi, Mumbai, India). The supernatant was filtered through 0.45 μm membrane filter (Millipore, Mumbai, India), suitably diluted with methanol, and analyzed spectrophotometrically at a λmax of 238 nm using a double beam UV-VIS spectrophotometer (UV 3000+, Labindia, Mumbai, India). The content of lovastatin in the samples was determined using a standard value of as 550 and molar extinction coefficient as 22 249 from a previously constructed standard calibration plot.
Pseudo-ternary phase diagram studies
Different ratios of lipid-to-emulgent were selected, within a range of 1:9 and 9:1, to delineate the boundaries of nanoemulsion region. Visual observations were made and recorded following addition of each installment (0.5 mL) of water. A series of phase diagrams were constructed using PCP Disso 3.0 software (University of Bradford, West Yorkshire, UK), by titrating binary systems of lipid(s) and emulgent(s) with water. The entire experiment was carried out at ambient temperature to precisely identify the region(s) of nanoemulsion. The generated sample, which was clear or slightly bluish in appearance, was taken as the nanoemulsion.
Factor screening studies
Screening studies embarked upon the phenomenon of “sparsity effect”, where only a few of the factors among the numerous ones are identified to explain major proportion of the experimental variation. The “factors” responsible for the major variability were declared as the active or influential variables, while others were termed as inactive, less influential or simple, noise variables. These factor screening studies were carried out as a prelude to the formulation development for identifying the vital few CMAs and/or CPPs actually affecting the response variable or CQAs. A seven-factor Taguchi design was employed for screening the influential formulation and process variables involved in the development of S-SNEDDS and for quantitatively expressing their effect on the CQAs. presents the description of high and low levels of various formulation and process variables and the design matrix as per Taguchi's design. The Dnm, Temul and Rel15 were chosen as the key quality attributes for investigating the highly influential formulation and process variables among the studied factors, viz. Capmul MCM, Nikkol HCO 50, Lutrol F127, stirrer type, stirring speed and stirring time selected from the risk assessment studies owing to their high and medium risk characteristics. Eight S-SNEDDS formulations of were prepared by admixture of the drug to the pre-molten blend of lipidic and emulsifying excipients. These S-SNEDDS formulations were subsequently characterized for the aforesaid key quality attributes. The linear polynomial equations were generated and the coefficients for each factor corresponding to the key quality attributes were analyzed by obviating the interaction effect(s) among the factors. The half-normal plots and Pareto charts were used for quantitatively analyzing the influence of individual formulation and process.
Table 3. Design matrix for factor screening as per five factor two level PBD along with the actual and coded values for the CMAs and CPPs.
Preparation of S-SNEDDS as per the experimental design
Based on the preliminary preformulation studies (i.e. equilibrium solubility studies and pseudo-ternary phase diagram plots), and factor screening studies, selection of the CMAs actually affecting the performance of S-SNEDDS was embarked upon for further systematic optimization of the formulations. A face-centered cube design (FCCD) with α = 1 was eventually employed, where the chosen CMAs, viz. amount of lipid (X1) and emulgent (X2) were studied at three different levels, i.e. low (−1), intermediate (0) and high (+1) levels. summarizes an account of the 13 experimental runs studied employing a total of nine formulations with the center point (0, 0) formulation studied in quintuplicate. The drug was dissolved in the isotropic mixture of lipid and emulgent pre-melted at temperature above the melting point of the lipid (i.e. 50 °C), followed by stirring using a magnetic stirrer (M/s Perfit, Ambala, India). The amount of lovastatin in all the formulations was kept as fixed in the dose of 20.0 mg. The levels for the lipid and emulgents were ascertained based on the region for formation of nanoemulsion in pseudoternary phase diagram plots. All the prepared formulations were characterized for the envisioned CQAs, viz. globule size (Dnm), emulsification time (Temul), liquefaction time (Tliq), mean dissolution time (MDT), percent dissolution efficiency in 15 min (DE15) and permeation in 45 min (Papp45min).
Table 4. Composition of various S-SNEDDS formulations prepared as per the FCCD.
Characterization of the S-SNEDDS formulations
Liquefaction time determination
Each formulation was wrapped in a transparent polythene film and tethered to the bulb of a thermometer by means of a thread. The thermometer with the attached formulation was placed in a round bottom flask containing 250 mL of 2.0% SLS, maintained at 37 ± 1 °C by means of a thermo-regulated heating mantle, observed carefully and the melt-time was recorded (Attama et al., Citation2003).
Emulsification time determination
A quantity of 1.0 g of each of the formulations was added to 0.5% w/v SLS solution (500 mL) under continuous stirring (50 rpm) using a USP 31 Apparatus 2 (Labindia, DS 8000, Mumbai, India) at 37 ± 0.5 °C. Time required to disperse the system completely and uniformly was determined, and the emulsification time was recorded in seconds (seconds).
Globule size analysis
Aliquots (1 mL each) of the S-SNEDDS preconcentrate were diluted 100-fold with double distilled water and employed for globule size analysis using dynamic laser scattering equipment (ZS 90, M/s Malvern, Worcestershire, UK) (Craig et al., Citation1995). The globule size was observed as Z-average diameter of the particles in nm.
In vitro drug release studies
Dissolution studies were carried out for all the formulations in hexaplicate in USP XXIV, Apparatus 2 paddle method (M/s Labindia, DS A/S 8000, Mumbai, India) employing 500 mL of simulated gastric fluid (SGF) containing 2.0% w/v SLS, pH 7.0 at 50 rpm and 37 ± 0.5 °C. An aliquot of sample (5 mL) was periodically withdrawn at suitable time intervals, followed by replacement with an equivalent amount of fresh dissolution medium. The samples after dilution(s) were analyzed spectrophotometrically at a λmax of 238 using a UV-visible spectrophotometer.
Dissolution data analysis
The raw data obtained from in vitro dissolution studies were analyzed using ZOREL software, UIPS, Panjab University, Chandigarh, India (Singh & Singh, Citation1998). The software was developed by the corresponding author of the article himself. The software has the in-built provisions for applying the correction factor for volume and drug losses during sampling (Equation (1)), and calculating the values of amount of drug dissolved, percent release, rate of drug release and log fraction released at varied times (Singh et al., Citation1997).
where, Ci = corrected absorbance; Ai = absorbance of ith reading; Vs = sample volume; Vt = total volume of dissolution medium. Using the software, mean dissolution time (MDT) at various time intervals were also calculated.
Ex vivo permeation studies using everted gut sac technique
All the studies involving animal experiments such as ex vivo permeability studies, in situ intestinal perfusion studies and in vivo pharmacodynamic studies were carried out in accordance with the experimental protocols approved by the Institutional Animal Ethics Committee of the Panjab University, Chandigarh, India. Unisex Wistar rats (200–250 g) housed in polypropylene cages were kept under the standard laboratory conditions at 25±2 °C and 55 ± 5%RH with free access to standard diet (Lipton feed, Mumbai, India) and water ad libitum. Besides, proper care and maintenance of the animals were undertaken following the guidelines of Committee for Prevention, Control and Supervision of Experimental Animals (CPCSEA, Citation2000). Ex vivo permeation studies were carried out in unisex Wistar rats (200–300 g), after keeping them fasted for 18–20 h. Rats were also sacrificed by cervical dislocation, and the entire length of the small intestine was carefully removed and kept in ice cold Kreb's Ringer saline buffer (KRB). Medial jejunum segment (i.e. middle 8–10 cm of jejunum section) was then removed and washed six times with KRB (5 mL each time). This segment was then cut and ligated with thread to one end of a glass rod and carefully everted. One gram weight was fixed and tied at the end of everted gut segment to make an empty gut sac, and to prevent peristaltic muscular contractions. The gut sac was filled with KRB solution and then placed inside the bath containing the test solution (i.e. content of one dose in 50 mL of KRB), continuously bubbled with atmospheric air at 10–15 bubbles per minute. The gut sac bath was surrounded by an outer controlled temperature water jacket. Accurately weighed (1 g) amount of the test formulation (i.e. S-SNEDDS) containing 20 mg dose of lovastatin was poured in the bath medium outside the gut sac. An aliquot of 100 µL was withdrawn from the gut sac at different time points (i.e. 5, 10, 15, 30 and 45 min), periodically with replacement and analyzed spectrophotometrically at 238 nm to determine the drug content. Further, the amount of drug permeated, i.e. apparent permeability in 45 min (Papp45min) was also calculated.
Optimization data analysis and validation of FbD
The CQAs selected for current FbD optimization studies encompassed, Dnm, Temul, Tliq, MDT, DE15min and Papp45min. For the studied FCCD design, the multiple linear regression analysis (MLRA) was applied to fit the model with full second-order quadratic polynomial equation with added interaction terms to correlate the studied responses with the examined variables using Design Expert® ver. 8.0.7.1 (M/s Stat-Ease, Minneapolis, MN). Only those coefficients, which were found to be significant, using Student's t-test, were considered in framing the polynomial equation. One-way ANOVA was carried out by analyzing the model parameters like model p value, coefficient of correlation and predicted error sum of squares (PRESS). The response surface analysis was carried out through estimated 3D-response surface plots and 2D-contour plots, perturbation charts and interaction plots, using Design Expert®. Besides, various diagnostic plots like normal plot of residuals, leverage plot, Box–Cox plot and Cook's distance plot were also employed for FbD data analysis. Finally, the prognosis of optimum formulation was conducted in two stages. In the first step, a feasible knowledge space was located followed by an exhaustive grid search using MS-Excel spreadsheet (MIcrosoft Inc., Washington, USA) to predict the possible solutions. Also, the numerical optimization was carried out using desirability function by trading-off the CMAs to meet the desired goals for each CQAs. The graphical optimization was also carried out to embark upon the optimized formulation using design space overlay plot, drawn using the Design Expert® software. Validation of the FbD methodology was carried out by selecting the eight confirmatory check-points formulations of S-SNEDDS amongst the knowledge space. The validation formulations were evaluated for various CQAs, and the linear correlation plots and residual plots between the predicted and observed responses were constructed. The percent prediction error was also calculated with respect to the observed responses.
Comparison of drug release with marketed brand
Drug release profile of S-SNEDDS formulation was carried out with the HP-β-CD inclusion complex of drug and marketed (MKT) brand (ROVACOR™, Stancare-Ranbaxy Labs Ltd., Gurgaon, India).
In situ single pass intestinal perfusion studies
In situ SPIP studies were carried out (in triplicate) for the selected optimized (OPT) S-SNEDDS formulation, inclusion complex, marketed brand and pure drug in rats. The study was carried out on unisex Wistar Rats, previously abstained from solid food for 24 h, prior to the conduct of study. The animals were anesthetized using thiopental sodium (50 mg/kg) intraperitonially. The abdomen was opened up with a midline incision, and small intestine was taken out carefully avoiding disturbance to the animal circulatory system. The proximal part of the jejnum 2–5 cm below the ligament of Trietz was cannulated with a glass cannula and connected to a reservoir. The second incision was made 10–15 cm below the first incision and connected with outflow glass cannula. The intestine segment was perfused with blank phosphate buffer (37 ± 1°C) until the perfusate was clear. The intestine was subsequently perfused with drug solution maintained at 37 ± 1°C at a perfusion rate of 0.2–0.3 mL/min (Cook & Shenoy, Citation2003; Yao et al., Citation2008). During the experiment, rat was kept under a heating lamp, and the exposed abdomen was covered with a cotton pad to minimize dehydration. Steady state was achieved within 30 min, and the samples were obtained at specified time intervals (i.e. 15, 30, 45 and 60 min). After taking the last sample, a piece of thread was placed along the intestine for measuring its length with the help of a centimeter scale. The volume of water entering into the system and leaving the system was carefully recorded to calculate water flux. After collecting samples, 1 mL of perfusate was taken and 4 mL of diethyl ether was added. It was then centrifuged at 3000 rpm (503×g) for 15 min. After centrifugation, the ether was evaporated and 1.5 mL of perfusion solution was added, followed by spectrophotometric analysis at 238 nm.
In vivo pharmacodynamic studies
In vivo pharmacodynamic studies were carried out for 28 days on healthy unisex Wistar rats subjected to high fat diet (i.e. 2 mL of coconut oil per day), along with free access to standard rat feed for inducing the experimental hyperlipidemia-like condition (Sakamoto et al., Citation1987). The animals were divided into four groups (i.e. A, B, C and D) containing six rats each (weighing 280 to 320 g), and administered with different test formulations, viz. OPT S-SNEDDS, HP-β-CD inclusion complex, MKT and pure drug on the 28th day. Blood samples were collected in the heparin-coated glass vials from the animals under light ether anesthesia by puncturing of retro-orbital vein, initially, on 7th, 14th, 21st and on 28th day. The plasma samples were separated by cold centrifugation at 3000 rpm (503×g) for 25 min and stored under frozen condition until further use. The samples were analyzed for serum cholesterol, triglycerides (TG), high-density lipoprotein (HDL) and low-density lipoprotein (LDL) by employing the enzymatic diagnostic kit (ENZOPAK, Reckon Diagnostics Pvt. Ltd., Vadodara, Gujarat). A fixed volume of samples and standard were mixed with the working reagent separately, followed by incubation at 37 °C for 10 min. Absorbance of the developed color was measured spectrophotometrically for determination of serum cholesterol, LDL, HDL and tTG, respectively.
Fourier transformed infrared spectroscopy
The FTIR spectroscopy studies were carried out to characterize the possible interaction(s) between the drug and excipients, if any. The FTIR spectra of pure drug and physical mixture of drug with various lipidic excipients were recorded by KBr disc using an FTIR spectrophotometer (Perkin Elmer, Massachusetts, USA).
Transmission electron microscopy studies
The morphology of OPT S-SNEDDS was carried out using transmission electron microscope (TEM) attached with a mega view II digital camera (H 7500, M/s Hitachi, Tokyo, Japan). A drop of sample diluted with water was placed on a copper grid and the excess was drawn-off with a filter paper. Samples were subsequently stained with 1% solution of phosphotungstic acid for 30 s. The image was magnified and focused on a layer of photographic film (Elnaggar et al., Citation2009).
Stability studies
Stability studies of capsule dosage form of OPT S-SNEDDS formulation was carried out at 25 ± 2 °C and 60 ± 5% RH. The formulations kept in air tight glass vials were analyzed for particle size and dissolution performance at various time points of 0, 1, 3 and 6 months. Similarity factor (f2) was also calculated to investigate the analogy of the dissolution parameters during the stability studies (FDA Guidance for Industry, Citation2000).
Results
Preformulation studies for screening of excipients
Equilibrium solubility studies
Among various lipidic excipients explored for equilibrium solubility studies, the maximum solubility for lovastatin was observed in Capmul MCM (91.58 mg/mL). Similarly, amongst various surfactants and co-surfactants employed, the highest solubility was observed in Nikkol HCO-50 (82.84 mg/mL) and Lutrol F127 (121 mg/mL), respectively.
Pseudo-ternary phase diagrams
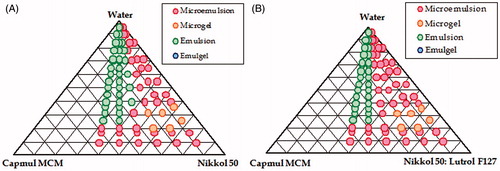
Initially, based on the results of maximum solubility, various pseudo-ternary phase diagrams were constructed employing Capmul MCM (i.e. lipid), Nikkol HCO-50 (i.e. emulgent) and Lutrol F127 (i.e. co-surfactant) for identifying the maximal region for formation of thermodynamically stable nanoemulsion, as illustrated in . A good nanoemulsion region was observed between Capmul MCM and Nikkol HCO 50 (), which may be ascribed to the efficient emulsification characteristics of lipid by the surfactant and the co-solvent. Further, it was observed that an addition of Lutrol F127 to the mixture of Nikkol HCO-50 and Capmul MCM, a significant increase in the nanoemulsion region was observed, as is evident from the pseudoternary phase diagram in . Among the various combinations of Nikkol HCO-50 and Lutrol F127 (i.e. 1:1, 1:2, 1:3, 2:1 and 3:1) explored, the maximal region for nanoemulsion was observed at the ratio of 2:1.
Figure 2. Representative pseudo-ternary phase diagrams depicting the nanoemulsion regions, (A) Ternary phase diagram between Capmul MCM, Nikkol HCO-50 and water and (B) Ternary phase diagram between Capmul MCM, Nikkol HCO-50:Lutrol F−127 (2:1) and water.
Risk assessment
depicts the Ishikawa fish-bone diagram for the S-SNEDDS portraying a cause-and-effect relationship among the potential factors affecting the drug product CQAs. illustrates the risk estimation matrix postulated for identifying the risk associated with each material attributes and/or process parameters. Rational justification of various risk(s) for each of the material attributes and process parameters corresponding to the respective CQAs is enlisted in . Initial risk assessment studies using aforesaid tools have suggested that three factors, i.e. amount of lipid, surfactant and co-surfactant were found to be highly critical owing to the high risk associated with them on CQAs, while the process parameters like type of stirrer used, stirring time and stirring speed were observed to exhibit medium risk level.
Table 5. Initial risk assessment for S-SNEDDS formulation of lovastatin.
Table 6. Justification of risk allotment and identification of CMAs and CPPs.
Factor screening studies
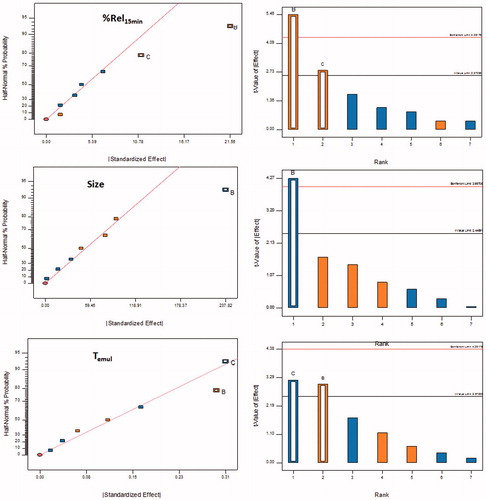
The factor screening studies were carried out on the high and medium risk parameters employing Taguchi's design. The first-order polynomial equations along with their corresponding polynomial coefficients, generated for each of the quality attributes employed during the screening studies, indicated the absence of any interaction effect(s) among the factors. It was revealed that only the coefficients of two polynomial terms (i.e. β1 and β2), representing the amount of Nikkol HCO-50 and Lutrol F127, were found to be statistically significant (p < 0.5) corroborating their high influence on the studied response variables. Further, the influence of each factor on the response variables was also evaluated with the help of half-normal plots and Pareto charts. As depicted in , the factors, i.e. Nikkol HCO-50 (B) and Lutrol F127 (C) were above the t-value limit and Bonferroni's limits, thus ratifying their significant influence on globule size and Temul, whereas, the factor, Lutrol F127 (C) exhibited the highest effect on Rel15min (). Thus, from the initial risk assessment studies and factor screening studies, Nikkol HCO-50 (i.e. surfactant) and Lutrol F127 (i.e. co-surfactant) were finally selected the CMAs for further optimization using FCCD by keeping the amount of Capmul MCM (i.e. lipid) as constant in all the studied formulations.
Figure 3. Half-normal plots and Pareto charts for screening of influential factors as per Taguchi design using chosen critical quality attributes (CQAs), (A) Percent drug release in 15 min; Rel15min; (B) Globule size, Dnm; (C) Emulsification time, Temul; A: Lipid, B: Surfactant, C: Cosurfactant, D: Stirrer type, E: Stirring speed, F: Stirring time.
Liquefaction time determination
The values of Tliq of all the S-SNEDDS formulations, prepared as per FCCD, ranged between 265 and 324 s. The results revealed the rapid release characteristics of the S-SNEDDS as indicated by the lower values of Tliq.
Emulsification time determination
The values of Temul of all the prepared S-SNEDDS were found to be ranging between 300 and 570 s. Lower values of Temul in the current studies ratified the spontaneity of emulsification of the prepared S-SNEDDS to produce the nanoemulsion(s).
Globule size analysis
The globule size of all the prepared S-SNEDDS were found to be ranging between 69 and 231 nm, clearly vouching the nanostructured nature of the developed formulations.
In vitro drug release
In vitro drug release profiles of all the 13 formulations of S-SNEDDS exhibited ∼50% of drug release within the first 15 min and nearly complete drug release (>85%) within 30 min. Various dissolution parameters were computed to form the in vitro drug release data like MDT ranged between 8.82 and 19.94 min, whereas DE15min ranged between 13.42 and 53.5%, respectively. Overall the results indicated the fast release characteristics of all the developed S-SNEDDS formulations.
Response surface analyses
illustrates the coefficients of the second-order quadratic model along with ANOVA parameters like model p value, r2 and PRESS. The coefficients of the polynomial equation [Equation (2)], generated using MLRA for all the CQAs, Dnm, DE15min, Temul, Tliq, MDT and Papp45min revealed excellent fit to the data, with the values of r2 ranging between 0.9916 and 0.9999 (p < 0.0001 in each case) along with higher values for PRESS confirmed the goodness-of-fit of the data.
depicts the 3D-response surface and 2D-contour plots for Dnm, DE15min, Temul, Tliq, MDT and Papp45min. The response surface analyses facilitate understanding interaction between the CMAs their impact on CQAs of the S-SNEDDS.
Figure 4. 3D-Response surface and 2D-contour plots showing the influence of lipid (i.e. Nikkol HCO-50) and surfactant (i.e. Lutrol F127); (A–B) globule size (Dnm), (C–D) dissolution efficiency in 15 min (DE15min), (E–F) emulsification time (Temul), (G–H) liquefaction time (Tliq), (I–J) mean dissolution time (MDT) and (K–L) amount permeated in 45 min (Papp45min) for the S-SNEDDS of lovastatin.
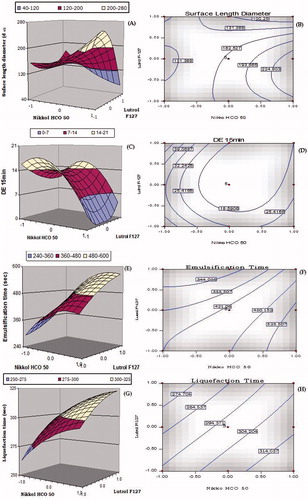
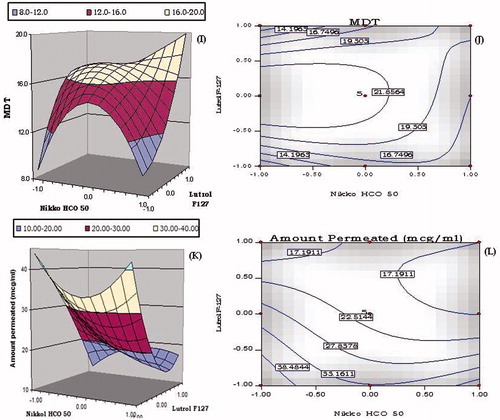
Table 7. Coefficient values and statistical parameters obtained for second-order quadratic equations for the studied CQAs.
A twisted response surface plot was observed for globule size, i.e. surface length diameter (Dnm) as shown in . The plot shows curvilinear decrease in globule size with an increase in the concentration of Nikkol HCO-50 and Lutrol F127. However, at low level of Lutrol F-127, an increase in the globule size was observed at all the levels of Nikkol HCO-50. The minimum globule size was observed at the high level of Nikkol HCO-50 and Lutrol F-127, indicating the better emulsion stability plausibly due to the reduction in the surface interfacial tension among the emulsion globules. The corresponding 2D-contour plot depicts the presence of curved contour lines ratifying noticeable interaction between Nikkol HCO-50 and Lutrol F-127 leading to minimum globule size at higher concentration of both.
As depicted in , the 3D-response surface plot for DE15min shows a curvilinear trend with initial increase in the values of DE15min followed by a sharp decline from low to high levels of Nikkol HCO-50. An analogous trend was also observed for DE15min with an increasing concentration of Lutrol F-127 at higher levels of Nikkol HCO-50. Further, the Nikkol HCO-50 had pronounced influence on DE15min compared to the Lutrol F-127. It may be ascribed to the enhanced solubilization of the drug in presence of Nikkol HCO-50 ostensibly owing to its hydrophilic nature. The respective 2D-contour plot as shown in also corroborated similar observation with a “nadir” between the low levels of Nikkol HCO-50 and high levels of Lutrol F127. The highest value of DE15min was observed at the low levels of Nikkol HCO-50 and Lutrol F127.
illustrates the 3D response surface plot of emulsification time (Temul). At high levels of Nikkol HCO-50, a linear increase in the values of emulsification time was observed at all the levels of Lutrol F127. The ability of Nikkol HCO-50 to reduce Temul was found to be superior at high levels of Nikkol HCO-50 and intermediate levels of Lutrol F127. The corresponding 2D-contour plot in also corroborated an identical linear trend at high levels of Nikkol HCO-50 and intermediate levels of Lutrol F127.
The response surface and contour plots for liquefaction time (Tliq) are shown in . On varying Nikkol HCO-50 concentration from lower to higher levels, a linear increase is Tliq was observed at all the levels. The minimum value of Tliq was obtained at the low levels of both the factors, ostensibly owing to low energy required for melting. Negligible interaction, however, was observed between Nikkol HCO-50 and Lutrol F127, as is evident from the parallel contour lines in the 2D-contour plots.
The canopy type complex 3D-response surface plot shown in for MDT revealed that at low levels of Lutrol F127, an initial sharp increase in the value of MDT from lower to higher levels of Nikkol HCO-50, followed by an immediate dip upon increasing the levels of Nikkol HCO-50. A steeper increase in MDT, however, was observed with increase in the concentration of Lutrol F127 from lower to higher levels. The respective 2D-contour plot in shows “nadir” at the low levels of Nikkol HCO-50 and Lutrol F127.
The response surface plot portrayed for Papp45min in shows a dip in the values of permeation from lower to intermediate levels of Nikkol HCO-50, followed by an improvement at the lower levels of Lutrol F127. On the contrary, at high level of Nikkol HCO-50, a sharp decline in the values of Perm45min was observed with increasing the levels of Lutrol F-127. The highest value of Papp45min was observed at low levels of both the factors, i.e. Nikkol HCO-50 and Lutrol F-127. The presence of curvature in the 3D-response surface plots indicated the presence of appreciable interaction between the factors. The corresponding 2D-contour plot depicted in also shows an analogous trend between Nikkol HCO-50 and Lutrol F127.
Search for the optimum formulation and validation of FbD model
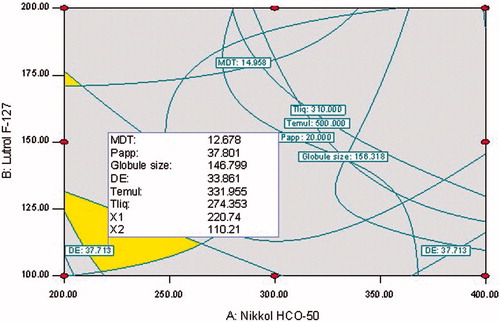
The search for optimum region was carried out by brute-force methodology employing feasibility and grid search and the optimized formulation was selected from the design space in the overlay plot. The criterion for selection of suitable feasible region was primarily based on the higher values of DE15min and Papp45min and the lower values of Dnm, MDT, Temul and Tliq. The following criteria was kept for identifying a feasible region for locating the optimum formulation such as Dnm < 250 nm; DE15min > 10%, Temul < 500 s; Tliq < 310 s, MDT < 17 min and Papp45min > 20 µg/mL.
Selection of the optimized formulation was embarked upon using numerical optimization desirability function by “trading off” various CQAs to attain the desired goals, i.e. minimization of Dnm, MDT, Temul, Tliq and maximization of DE15min, Papp45min. The design space was earmarked using the aforementioned criteria by a graphical-optimization technique. portrays the optimal design space region within the requisite knowledge space and location of the optimum formulation within the desired limits.
Figure 5. Overlay contour plot depicting the design space delineating the optimized formulation of S-SNEDDS.
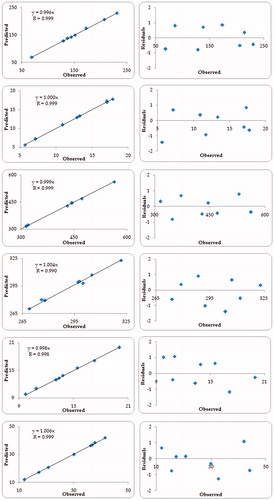
Validation of the FbD methodology was accomplished by preparing seven different check-point formulations and comparison of their observed responses with those predicted ones. The prediction error (i.e. bias) for the CQAs varied between −1.41 and 1.61% with overall mean ± SD as -0.99% ± 0.18. illustrates the linear correlation plots drawn between the predicted and observed responses demonstrating high values of “r”, ranging between 0.9916 and 0.9999, ratified the excellent goodness-of-fit (p < 0.001 in each case). The corresponding residual plots depicted nearly uniform and random scatter of points around the zero-axis, indicating high degree of prognostic ability of the FbD approach.
Figure 6. Linear correlation plots and residual plots between the observed and predicted values of various response variables, (A) Dnm, (B) DE15min, (C) Temul, (D) Tliq, (E) MDT and (F) Papp45min.
Drug release comparison with the reference formulations
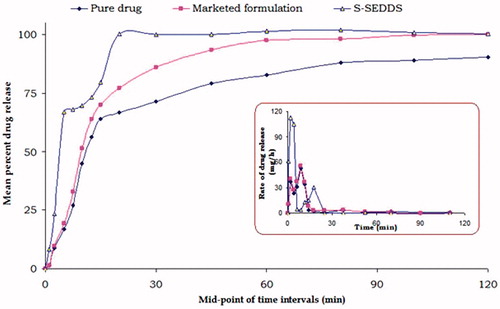
represents the in vitro drug release profile of the OPT S-SNEDDS with inclusion complex formulation and MKT (ROVACORTM). Complete drug release was observed within 20 min in case of the OPT S-SNEDDS vis-à-vis the inclusion complex and MKT formulation, where it was 67 and 72%, respectively. This ratified the enhancement in the dissolution rate of lovastatin in case of OPT S-SNEDDS, which may be attributable to the faster drug solubilization in the dissolution medium. Further, the dissolution profile of OPT S-SNEDDS revealed a characteristic “dip” between 5 and 20 min, which was conspicuously absent in case of inclusion complex and MKT, assignable to the lag time needed for transforming the solidified formulation into liquid by melting and dissolution steps.
Figure 7. Plot depicting the cumulative drug release profile (n = 6 ± SD) of lovastatin from optimized S-SNEDDS, inclusion complex and marketed formulation. The inset shows the drug release rate plot at the mid-points of the corresponding time intervals.
In situ intestinal perfusion studies
In situ SPIP studies fetched various permeability and absorption parameters for the OPT S-SNEDDS, inclusion complex and MKT. depicts the percent increase in intrinsic permeability, effective permeability and wall permeability of the OPT S-SNEDDS vis-à-vis the inclusion complex and MKT. For permeability parameters, i.e. intrinsic permeability, effective permeability and wall permeability, the OPT S-SNEDDS exhibited nearly 53, 52 and 227% increase, followed by the inclusion complex showing nearly 21, 9 and 30% rise, whereas in case of the MKT formulation, only 14, 7 and 21% enhancement was observed as compare to the pure drug. This confirmed significant improvement in permeability parameters of OPT S-SNEDDS, especially in wall permeability, ostensibly ascribed to the synergistic effect of lipid and emulgent present in the formulation (Pawar et al., Citation2012).
Figure 8. Bar chart depicting percent increase in the permeability and absorption parameters of lovastatin from optimized S-SNEDDS, inclusion complex and marketed formulation.
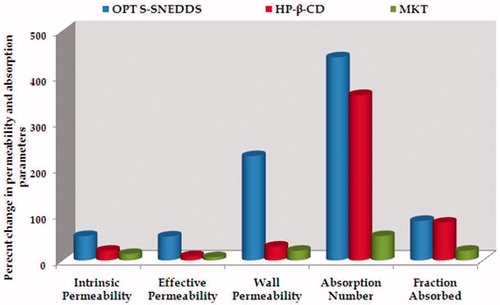
Also the percent increase in dimension-less parameters, i.e. absorption number and fraction absorbed for OPT S-SNEDDS, inclusion complex and MKT formulation is depicted in . Percent augmentation in absorption number with respect to pure drug, in case of OPT S-SNEDDS, inclusion complex and marketed formulation were found to be 442, 234 and 53%, respectively. Similarly, the percent increase in fraction of dose absorbed for OPT S-SNEDDS, inclusion complex and MKT was found to be 86, 52 and 21%, respectively. This signifies the phenomenal increase in the absorption parameters in case of the OPT S-SNEDDS vis-à-vis the inclusion complex and MKT. This can be attributed to the enhanced drug absorption through intestinal lymphatic pathways by circumnavigating the extensive hepatic first-pass effect, P-gp efflux and/or gut wall metabolism (O'Driscoll, Citation2002).
In vivo pharmacodynamic studies
Following administration of high fat diet for 10 days, all the animal groups exhibited significant elevation in the serum lipid levels indicating the hyperlipidemia-like condition. Post-treatment with OPT S-SNEDDS formulation of lovastatin revealed remarkable alteration in the levels of serum lipids, i.e. total cholesterol, TG, HDL and LDL vis-à-vis the inclusion complex and MKT, as illustrated in . All the treatment formulations revealed initiation of their pharmacodynamic effects in altering the serum lipid levels from 7th day onwards, with statistically significant difference observed among the total duration of treatment period on 14th, 21th and 28th day (p < 0.01).
Figure 9. A bird's eye view of percent change in various lipid levels as pharmacodynamic biomarkers 28 days post-treatment with optimized S-SNEDDS vis-à-vis HP-β-CD inclusion complex and marketed brand.
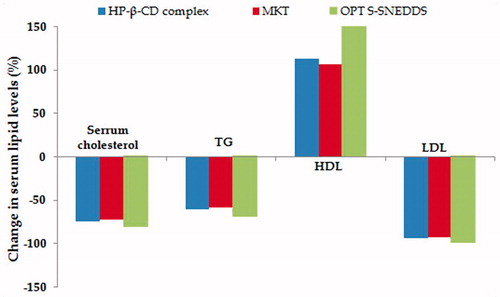
The OPT S-SNEDDS showed supremacy in reducing the serum cholesterol, i.e. 81.41% on 28th day with respect to control group, whereas the inclusion complex and MKT exhibited a total reduction of 74.66 and 72.84% in serum cholesterol, respectively. In case of serum TG, there was a marked decline observed on day 14th, which continued subsequently upto day 21th and 28th. The treatment formulations had shown significant reduction in serum TG maximum upto 70, 62 and 59% for OPT S-SNEDDS, inclusion complex and MKT on day 28th. Besides, the magnitude of reduction of TG level was higher in case of OPT S-SNEDDS amongst all the attributes, on day 21st and day 28th, respectively.
The percent increase in serum HDL level among the various treatment groups construed that the OPT S-SNEDDS exhibited remarkable elevation in the serum HDL, i.e. upto 179% compared with inclusion complex (112%) and MKT formulation (106%) on day 28th. On the contrary, the effect of OPT S-SNEDDS on percent decrease in LDL level was found to be 99% vis-à-vis the inclusion complex (87%) and MKT (82%), respectively.
Fourier transformed infrared spectroscopy
The FTIR spectra of drug with various excipients ratified no specific physiochemical interactions between them. Further, no significant difference was observed in wave number (cm−1) or functional group of the drug throughout the spectra.
Transmission electron microscopy studies
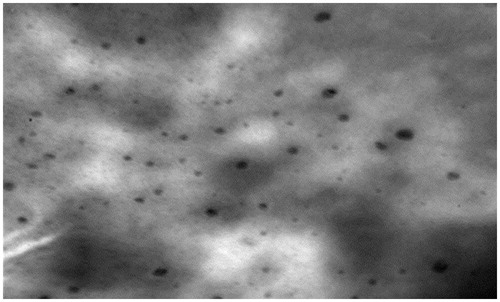
depicts the TEM images of the OPT S-SNEDDS formulation with a presence of dark oil globules and clearly portray drug entrapped within the oil globules.
Figure 10. The TEM image of the optimized solid self-nano emulsifying formulation of lovastatin.
Accelerated stability studies
portrays the six-month data of accelerated stability studies of OPT S-SNEDDS clearly demonstrated that there was a miniscule deviation in various CQAs selected (i.e. Dnm, Temul, Tliq, MDT, DE and Papp45min), construing excellent stability of the formulations. The dissolution profile comparison using similarity factor shows a non-linear trend, with all the f2 values ranging between 94.63 and 99.81, well within the pragmatic limits of 50 to 100, to connote similarity of the dissolution profile with time (FDA Guidance for Industry, Citation2000). Application of Student's t-test too indicated a lack of statistically significant difference at 5% level of significance.
Table 8. Effect on the parameters during the stability studies of the S-SNEDDS formulation kept in the humidity chamber at 25 °C±2 °C/60% RH±5%.
Discussions
The current research work encompasses the systematic development of optimized S-SNEDDS of lovastatin employing FbD paradigms and their subsequent evaluation using in vitro release studies, in situ SPIP studies for delineating permeability and absorption behavior, and in vivo studies for corroborating their enhanced bioavailability potential. Lovastatin being a prodrug, pharmacodynamic biomarkers were preferred over the pharmacokinetic profile of the drug and its active metabolite, β-hydroxyacid of lovastatin, for the latter studies.
At the onset, the systematic FbD-based product development embarked upon defining the patient-centric QTPP and CQAs to aim for maximum therapeutic benefits in terms of efficacy and safety. From the listed QTPP and QAs ( and ), the globule size (Dnm, responsible for smooth penetration of emulsion globules through paracellular intestinal pathways), dissolution efficiency (DE15min, furnishes pertinent information on the early phase in vitro dissolution performance), liquefaction time (Tliq, responsible for rapid drug release), emulsification time (Temul, essential for ease of formation of nanoemulsion), MDT (indicator of faster and complete drug release from the formulation during dissolution) and amount permeated in 45 min (Papp45min) were identified as the potential CQAs for the S-SNEDDS of lovastatin. Initial risk assessment studies, carried out with the help of fish-bone diagram(s) helped in establishing the cause-and-effect relationship(s) among the possible material attributes and/or process parameters affecting the CQAs. Equilibrium solubility studies carried out in various lipidic and emulsifying excipients helped in apt selection of Capmul MCM as the lipid, Nikkol HCO-50 as the surfactant and Lutrol F127 as the co-surfactant with maximum possible soluble fraction for lovastatin. Higher solubility in Capmul MCM may be ascribed to the lipophilic nature of esterfied medium chain mono/diglycerides, whereas the high solubility in Nikkol HCO-50 and Lutrol F127 was attributed to their characteristic amphiphilic nature and high HLB value between 12 and 18 (Singh et al., Citation2009). The selected excipients were subjected to phase titration studies in SGF to delineate the boundaries of nanoemulsion region. From the pseudoternary phase diagrams, the best possible ratios of lipid and emulsifiers were studied for factor screening and appropriate levels of the excipients identified for optimization. Pseudoternary phase diagram plots construed maximum nanoemulsion region, when surfactant and co-surfactant were used in the ratio of 2:1, thus corroborating the excellent emulsifying ability.
The CMAs were subsequently prioritized using risk analysis through construction of risk estimation matrix by assigning risks to each factor related to the drug product CQAs. Overall, the risk assessment studies indicated that the amount of surfactant (i.e. Nikkol HCO-50) and co-surfactant (i.e. Lutrol F127) were associated with high risk, whereas the parameters like stirrer type, stirring speed and stirring time were found to possess low to medium risk. Other remaining material and/or process variables were found to be less influential, and thus were assumed as constant for the subsequent studies as per the Pareto principle (Singh et al., Citation2005a).
Factor screening studies were carried out employing Taguchi's design ratified that the amount of surfactant (i.e. Nikkol HCO-50) and co-surfactant (i.e. Lutrol F-127) were highly influential as per the half-normal plots and Pareto charts; therefore, ratified as the CMAs for optimization of S-SNEDDS. All the formulations, prepared as per the FCCD, exhibited globule size ranging between 69 and 231 nm, which is considered to be ideal for enhanced micellar absorption of the drug (Gershanik & Benita, Citation2000). Besides, the lower values of Tliq and Temul signified the spontaneity of emulsification process and faster solubilization of the drug in the dissolution medium. Also, the higher values of MDT, DE and Papp45min corroborated the superiority of S-SNEDDS in enhancing the oral absorption of drugs. The quadratic model was chosen for the selected design based on the ANOVA results using model p value, r2 and PRESS confirmed the excellent goodness of fit. The response surface analyses using 2D-plots and 3D-plots like response surface plots, contour plots and perturbation charts ratified the presence of inter-excipient interaction (i.e. synergism or antagonism) on the studied CQAs. Besides, the model diagnostic plots including normal plot of residuals, leverage plot, Box–Cox plot and Cook's distance plot also demonstrated the ideality of data and absence of any outliers. The extensive feasibility and grid search techniques, along with numerical optimization and desirability function close to 1, helped in embarking upon the optimized formulation. The optimum formulation contained 200 mg of Capmul MCM, 200 mg of Nikkol HCO-50 and 110 mg of Lutrol F-127 for single dose of lovastatin, i.e. 20 mg. The said optimized formulation exhibited minimal globule size (146.8 nm) with maximal drug release (>90%) and enhanced permeability characteristics (>77%); thus, confirming distinct superiority in biopharmaceutical performance potential. Further, the optimized formulation was found well within the region of design space demarcated in the knowledge space. Validation of the FbD methodology by constructing linear correlation plots revealed good correlation between the predicted and observed responses (p < 0.001), while the corresponding residual plots demonstrated nearly uniform and random scatter of the points, confirmed the high degree of prognostic ability of FbD.
The in vitro drug release profile of the OPT S-SNEDDS (), indicated nearly 1.62-fold improvement in drug dissolution rate vis-à-vis the MKT formulation. This may ostensibly be owing to the synergistic contribution of lipid, surfactant and co-surfactant in the S-SNEDDS formulations through micellar solubilization of the drug via reduction of interfacial tension to produce the oil-in-water nanoemulsion (Pouton, Citation2000; Shafiq et al., Citation2007). The characteristic “dip” observed for the OPT S-SNEDDS during in vitro drug release, in all respect may be attributed to the lag-time required for liquefaction of the solid nanoemulsified system into the corresponding liquid form (Attama et al., Citation2003; Yuksel et al., Citation2003; Singh et al., Citation2012). In contrast, there was no such event observed for the inclusion complex and MKT during in vitro drug release studies (). Evaluation of drug release kinetics of the S-SNEDDS revealed that the formulation exhibited a non-Fickian drug release mechanism, thus supporting the rapid/immediate release characteristics of the formulations (Ahuja et al., Citation2007).
In situ SPIP studies carried out in male Wistar rats demonstrated remarkable augmentation in the permeability and absorption potential of the drug with OPT S-SNEDDS vis-à-vis the inclusion complex and MKT. The OPT S-SNEDDS exhibited 4.10-fold and 8.3-fold augmentation in the fraction of dose absorbed and absorption number compared to the MKT. Higher values of these dimensionless numbers for the OPT S-SNEDDS account for facilitated transport and absorption of drug through intestinal paracellular pathways. Notwithstanding the augmentation in the absorption parameters, the S-SNEDDS also demonstrated higher permeability, as was evident from the increased values of intrinsic permeability (3.8-fold), effective permeability (7.4-fold) and wall permeability (10.8-fold) vis-à-vis the MKT. Further, the S-SNEDDS were also found to be distinctly superior to the inclusion complex in enhancing the permeability parameters, viz. intrinsic permeability (2.52-fold), effective permeability (5.7-fold) and wall permeability (7.56-fold), respectively. In a nutshell, the in situ SPIP studies ratified the enhanced absorption potential of the S-SNEDDS plausibly owing to the presence of lipidic adjuvants (i.e. Capmul MCM) and emulgent (i.e. Nikkol HCO-50), which help in circumnavigation of the hepatic first-pass effect, gut wall metabolism by Cytochrome P450 enzymes and facilitated absorption of drug through intestinal lymphatic pathways (Nanjwade et al., Citation2011; Beg et al., Citation2013). Moreover, the enhanced absorption potential S-SNEDDS could also be attributed to characteristic increase in solubility of the drug, as well as burst release in gastrointestinal milieu, leading eventually to faster drug absorption (Taha et al., Citation2009). The mono/diglycerides of lipids also promote absorption of drug via paracellular and transcellular pathways, whereas the non-ionic block co-polymers present in the surfactant (i.e. Lutrol F127) possibly inhibit the role of transporters like MDR1/BCRP and efflux mediated by P-gp responsible for lowering the oral bioavailability of drugs (Fatouros et al., Citation2007).
After evaluating the OPT S-SNEDDS formulations through in situ SPIP studies to unearth the mechanism for oral bioavailability enhancement, the in vivo studies were carried out in hyperlipidemic rats to evaluate their pharmacodynamic potential vis-à-vis the inclusion complex and MKT. Overall, the OPT S-SNEDDS exhibited remarkably better pharmacodynamic performance compared to inclusion complex and MKT formulation. One-way ANOVA corroborated highly statistical significant differences among all the treatment groups at all the durations of studies (p < 0.001 each). The OPT S-SNEDDS had showed significant modifications in the levels of biomarkers such as total serum cholesterol, TG, HDL and LDL vis-à-vis the inclusion complex and MKT. Among the aforementioned biomarkers, the OPT S-SNEDDS exhibited distinctly superior performance in augmenting the levels of serum HDL, popularly termed as “good” cholesterol, which helps in housekeeping function to reduce the hyperlipidemic condition. However, the levels of total serum cholesterol, TG and LDL, considered as “bad” cholesterol, were drastically reduced. Although the inclusion complex also exhibited prominent alteration in the levels of biomarkers, yet the magnitude of pharmacodynamic performance was found to be much lower as compared to that by the OPT S-SNEDDS. Such alterations in the level of pharmacodynamic biomarkers are in close consonance with several of literature findings (Patel & Vavia, Citation2007; Dixit & Nagarsenker, Citation2008; Kadu et al., Citation2011; Goyal et al., Citation2012). This considerable improvement in the pharmacodynamic performance of OPT S-SNEDDS may be attributable primarily to the miniscule globule size, and consequently enhanced dissolution and permeation potential (Pouton, Citation2000, Citation2006). Marked difference in pharmacodynamic performance between OPT S-SNEDDS and inclusion complex, however, construe that the mechanism(s) other than solubility and dissolution are underway in explaining the remarkable bioavailability enhancement potential of the self-emulsifying formulation. Facilitation of drug transport through intestinal lymphatic pathways by bypassing the hepatic first-pass metabolism seems to be instrumental in ascribing the superior biopharmaceutical performance of the S-SNEDDS. Apart from these, increased cellular uptake by paracellular transport, inhibition of gut wall metabolism and intestinal efflux by luminal transporters many also have contributed for enhanced bioavailability potential (Khoo et al., Citation1998; Gershanik & Benita, Citation2000).
The drug-excipient compatibility studies using FTIR spectroscopy corroborated the lack of any significant interaction between the drug and lipidic excipients. Accelerated stability studies confirmed insignificant change in the formulation CQAs, thus supports the high robustness of the optimized formulations.
Conclusions
The present studies successfully vouch the systematic FbD-based development of optimized S-SNEDDS formulations of lovastatin, an antihyperlipidemic prodrug, thus furnishing a simple, effective and cost-effective approach to formulate solid self-emulsifying systems with improved bioavailability potential. Preformulation and risk assessment studies facilitated the selection of apt lipidic and emulsifying excipients as potential CMAs for rational optimization of the S-SNEDDS. The optimized formulation exhibited excellent globule size in the nano size range, significant improvement in the dissolution rate and permeation of the drug, and multi-fold enhancement in the absorption and permeability parameters during in situ SPIP and in vivo pharmacodynamic studies. Besides, faster drug dissolution in the gastrointestinal tract, transportation through lymphatic pathways, inhibition of P-gp efflux and gut wall metabolism could be the plausible mechanisms playing stellar role in enhanced drug absorption. The promising outcomes of the current research work can also be extrapolated for successfully augmenting the oral bioavailability of other statins and various other drugs belonging to BCS class II or IV, especially those undergoing extensive hepatic first-pass effect and/or P-gp efflux in gut.
Acknowledgements
The authors are thankful to M/s Ranbaxy Research Laboratories, Gurgaon, India, for providing the ex gratis sample of Lovastatin. M/s Gattefosse, Saint-Priest, France; M/s BASF, Ludwigshafen, Germany, M/s Abitec Corp, Ohio, USA; and M/s Nikkol Chemicals, Tokyo, Japan; are gratefully acknowledged and appreciated for providing the gift samples of excipients employed during the current studies. Financial grants received from the University Grant Commission (UGC) and All India Council of Technical Education (AICTE), New Delhi, for research assistance is deeply acknowledged.
Declaration of interest
Authors declare no conflict(s) interest.
References
- Ahuja N, Katare OP, Singh B. (2007). Studies on dissolution enhancement and mathematical modeling of drug release of a poorly water-soluble drug using water-soluble carriers. Eur J Pharm Biopharm 65:26–38
- Attama AA, Nzekwe IT, Nnamani PO, et al. (2003). The use of solid self-emulsifying systems in the delivery of diclofenac. Int J Pharm 262:23–8
- Bandyopadhyay S, Katare OP, Singh B. (2012). Optimized self nano-emulsifying systems of ezetimibe with enhanced bioavailability potential using long chain and medium chain triglycerides. Colloids Surf B Biointerfaces 100:50–61
- Bansal T, Mustafa G, Khan ZI, et al. (2008). Solid self-nanoemulsifying delivery systems as a platform technology for formulation of poorly soluble drugs. Crit Rev Ther Drug Carrier Syst 25:63–116
- Beg S, Jena SS, Patra ChN, et al. (2013). Development of solid self-nanoemulsifying granules (SSNEGs) of ondansetron hydrochloride with enhanced bioavailability potential. Colloids Surf B Biointerfaces 101:414–23
- Beg S, Swain S, Rizwan M, et al. (2011). Bioavailability enhancement strategies: basics, formulation approaches and regulatory considerations. Curr Drug Deliv 8:691–702
- CPCSEA guidelines for laboratory animal facility. 2000. Available from: http://caf.iisc.ernet.in/image/cpcsea-guidelines [last accessed 18 Aug 2013]
- Cook TJ, Shenoy SS. (2003). Intestinal permeability of chlorpyrifos using the single-pass intestinal perfusion method in the rat. Toxicology 184:125–33
- Craig DQM, Barker SA, Banning D, Booth SW. (1995). An investigation into the mechanisms of self-emulsification using particle size analysis and low frequency dielectric spectroscopy. Int J Pharm 114:103–10
- Dhawan S, Kapil R, Singh B. (2011). Formulation development and systematic optimization of solid lipid nanoparticles of quercetin for improved brain delivery. J Pharm Pharmacol 63:342–51
- Dixit RP, Nagarsenker MS. (2008). Self-nanoemulsifying granules of ezetimibe: design, optimization and evaluation. Eur J Pharm Sci 35:183–92
- Elnaggar YS, El-Massik MA, Abdallah OY. (2009). Self-nanoemulsifying drug delivery systems of tamoxifen citrate: design and optimization. Int J Pharm 380:133–41
- Fatouros DG, Karpf DM, Nielsen FS, Mullertz A. (2007). Clinical studies with oral lipid based formulations of poorly soluble compounds. Ther Clin Risk Manag 3:591–604
- FDA Guidance for Industry. 2000. Waiver of in vivo bioavailability and bioequivalence studies for immediate-release solid oral dosage forms based on a biopharmaceutics classification system. : Center for Drug Evaluation and Research (CDER). U.S. Department of Health and Human Services, US FDA
- Gershanik T, Benita S. (2000). Self-dispersing lipid formulations for improving oral absorption of lipophilic drugs. Eur J Pharm Biopharm 50:179–88
- Goyal U, Arora R, Aggarwal G. (2012). Formulation design and evaluation of a self-microemulsifying drug delivery system of lovastatin. Acta Pharm 62:357–70
- Kadu PJ, Kushare SS, Thacker DD, Gattani SG. (2011). Enhancement of oral bioavailability of atorvastatin calcium by self-emulsifying drug delivery systems (SEDDS). Pharm Dev Technol 16:65–74
- Kawakami K. (2012). Modification of physicochemical characteristics of active pharmaceutical ingredients and application of supersaturatable dosage forms for improving bioavailability of poorly absorbed drugs. Adv Drug Deliv Rev 64:480–95
- Khoo SM, Humberstone AJ, Porter CJH, et al. (1998). Formulation design and bioavailability assessment of lipidic self-emulsifying formulations of halofantrine. Int J Pharm 167:155–64
- Lionberger RA, Lee SL, Lee L, et al. (2008). Quality by design: concepts for ANDAs. AAPS J 10:268–76
- Mehramizi A, Asgari Monfared E, Pourfarzib M, et al. (2007). Influence of β-cyclodextrin complexation on lovastatin release from osmotic pump tablets (OPT). Daru 15:71–8
- Mevacor. Drug information: lovastatin. Available from: http://www.rxlist.com/mevacor-drug.htm [last accessed 21 Sep 2013)
- Mu H, Holm R, Mullertz A. (2013). Lipid-based formulations for oral administration of poorly water-soluble drugs. Int J Pharm 453:215–24
- Nanjwade BK, Patel DJ, Udhani RA, Manvi FV. (2011). Functions of lipids for enhancement of oral bioavailability of poorly water-soluble drugs. Sci Pharm 79:705–27
- O'Driscoll CM. (2002). Lipid-based formulations for intestinal lymphatic delivery. Eur J Pharm Sci 15:405–15
- Patel AR, Vavia PR. (2007). Preparation and in vivo evaluation of SMEDDS (self-microemulsifying drug delivery system) containing fenofibrate. AAPS J 9:E344–52
- Patel M, Tekade A, Gattani S, Surana S. (2008). Solubility enhancement of lovastatin by modified locust bean gum using solid dispersion techniques. AAPS PharmSciTech 9:1262–9
- Patel RP, Patel MM. (2007). Physicochemical characterization and dissolution study of solid dispersions of Lovastatin with polyethylene glycol 4000 and polyvinylpyrrolidone K30. Pharm Dev Technol 12:21–33
- Pawar YB, Purohit H, Valicherla GR, et al. (2012). Novel lipid based oral formulation of curcumin: development and optimization by design of experiments approach. Int J Pharm 436:617–23
- Porter CJ, Trevaskis NL, Charman WN. (2007). Lipids and lipid-based formulations: optimizing the oral delivery of lipophilic drugs. Nat Rev Drug Discov 6:231–48
- Porter CJ, Wasan KM, Constantinides P. (2008). Lipid-based systems for the enhanced delivery of poorly water soluble drugs. Adv Drug Deliv Rev 60:615–16
- Pouton CW. (2000). Lipid formulations for oral administration of drugs: non-emulsifying, self-emulsifying and self-microemulsifying drug delivery systems. Eur J Pharm Sci 11:S93–8
- Pouton CW. (2006). Formulation of poorly water-soluble drugs for oral administration: physicochemical and physiological issues and the lipid formulation classification system. Eur J Pharm Sci 29:278–87
- Raza K, Katare OP, Setia A, et al. (2012). Improved therapeutic performance of dithranol against psoriasis employing systematically optimized nanoemulsomes. J Microencapsul 30:225–36
- Raza K, Singh B, Singal P, et al. (2013). Systematically optimized biocompatible isotretinoin-loaded solid lipid nanoparticles (SLNs) for topical treatment of acne. Colloids Surf B Biointerfaces 105:67–74
- Sakamoto K, Tabata T, Shirasaki K, et al. (1987). Effects of gamma-oryzanol and cycloartenol ferulic acid ester on cholesterol diet induced hyperlipidemia in rats. Jpn J Pharmacol 45:559–65
- Shafiq S, Shakeel F, Talegaonkar S, et al. (2007). Development and bioavailability assessment of ramipril nanoemulsion formulation. Eur J Pharm Biopharm 66:227–43
- Sheikh K. (2011). Dissolution and stability enhancement of poorly water soluble drug lovastatin by preparing solid dispersions. Asian J Biomed Pharm Sci 1:24–31
- Singh B, Bandopadhyay S, Kapil R, et al. (2009). Self-emulsifying drug delivery systems (SEDDS): formulation development, characterization and applications. Crit Rev Ther Drug Carrier Syst 26:427–521
- Singh B, Kapil R, Nandi M, Ahuja N. (2011a). Developing oral drug delivery systems using formulation by design: vital precepts, retrospect and prospects. Expert Opin Drug Deliv 8:1341–60
- Singh B, Kaur T, Singh S. (1997). Correction of raw dissolution data for loss of drug during sampling. Indian J Pharm Sci 59:196–9
- Singh B, Khurana L, Bandyopadhyay S, et al. (2011b). Development of optimized self-nano-emulsifying drug delivery systems (SNEDDS) of carvedilol with enhanced bioavailability potential. Drug Deliv 18:599–612
- Singh B, Kumar R, Ahuja N. (2005a). Optimizing drug delivery systems using systematic “design of experiments.” Part I: Fundamental aspects. Crit Rev Ther Drug Carrier Syst 22:27–105
- Singh B, Mehta G, Kumar R, et al. (2005b). Design, development and optimization of nimesulide-loaded liposomal systems for topical application. Curr Drug Deliv 2:143–53
- Singh B, Singh R, Bandyopadhyay S, et al. (2012). Optimized nanoemulsifying systems with enhanced bioavailability of carvedilol. Colloids Surf B Biointerfaces 101:465–74
- Singh B, Singh S. (1998). A comprehensive computer program for study of drug release kinetics from compressed matrices. Indian J Pharm Sci 60:313–16
- Singh SK, Verma PR, Razdan B. (2010). Development and characterization of a lovastatin-loaded self-microemulsifying drug delivery system. Pharm Dev Technol 15:469–83
- Sule A, Szente L, Csempesz F. (2009). Enhancement of drug solubility in supramolecular and colloidal systems. J Pharm Sci 98:484–94
- Taha EI, Al-Suwayeh SA, El-Badry M. (2009). Bioavailability study of indomethacin self-nano emulsifying oral formulation in rats. Australian J Basic Appl Sci 3:2944–8
- Tan A, Rao S, Prestidge CA. (2013). Transforming lipid-based oral drug delivery systems into solid dosage forms: an overview of solid carriers, physicochemical properties, and biopharmaceutical performance. Pharm Res 30:2993–3017
- Tang B, Cheng G, Gu JC, Xu CH. (2008). Development of solid self-emulsifying drug delivery systems: preparation techniques and dosage forms. Drug Discov Today 13:606–12
- Wu W, Wang Y, Que L. (2006). Enhanced bioavailability of silymarin by self-microemulsifying drug delivery system. Eur J Pharm Biopharm 63:288–94
- Yao J, Lu Y, Zhou JP. (2008). Preparation of nobiletin in self-microemulsifying systems and its intestinal permeability in rats. J Pharm Pharm Sci 11:22–9
- Yuksel N, Karatas A, Ozkan Y, et al. (2003). Enhanced bioavailability of piroxicam using Gelucire 44/14 and labrasol: in vitro and in vivo evaluation. Eur J Pharm Biopharm 56:453–9