
Abstract
Recently, the feasibility and effects of using microbubbles (MBs) as an ultrasound (US) contrast agent for enhancing the penetration in transdermal delivery in vivo have been demonstrated, but the mechanism and efficiency are unclear. This study demonstrates the penetration depth, concentration and efficiency of transdermal α-arbutin delivery during 4 weeks after US treatment with MBs in mice. Experimental animals were randomly divided into the following four groups (n = 5 animals per group): (1) penetrating α-arbutin alone (C), (2) US combined with penetrating α-arbutin, (3) US combined with MBs and penetrating α-arbutin, and (4) US combined with diluted MBs and penetrating α-arbutin (UBD). The penetration depths in agarose phantoms and pigskin were 47 and 84% greater for group UBD, respectively, than for group C. The in vitro skin penetration by 2% α-arbutin after 3 h was 83% greater in group UBD than in group C. The degree of in vivo skin whitening (quantified as the luminosity index) in group UBD significantly increased by 25% after 1 week, 34% after 2 weeks, and then stabilized after 3 weeks at 37% in C57BL/6J mice over a 4-week experimental period. Our results indicate that combined treatment with optimal US and MBs can increase skin permeability so as to enhance α-arbutin delivery to inhibit melanogenesis without damaging the skin in mice.
Introduction
The epidermis (specifically, the stratum corneum) represents the main factor controlling transdermal drug delivery (TDD) in human skin. The penetration of viable tissue can occur via three potential pathways: (1) through the sebaceous glands associated with hair follicles, (2) through sweat ducts or (3) directly across the continuous stratum corneum between these structures (Barry, Citation2001; Alexander et al., Citation2012). The ions and large polar molecules constituting drugs are significantly impeded by the intact stratum corneum, and so intercellular, intracellular (transcellular) and follicular (appendage) pathways need to be considered. The associated limitations to topical and transdermal bioavailability (Barry, Citation2001; Alexander et al., Citation2012) mean that available transdermal medicines are small molecules (<500 Da) (Park et al., Citation2014). Many technologies have been developed to enhance TDD for therapeutic and diagnostic purposes, such as the chemical enhancers to iontophoresis, electroporation and pressure waves generated by ultrasound (US), or synergistic mixtures of multiple mechanisms (Zafar et al., Citation2010; Marwah et al., Citation2014). In the delivery of large molecules, ultrasound alone cannot provide sufficient permeability enhancement (Han & Das, Citation2013). Moreover, there are many reports on the delivery of large molecules using microneedles patch. In addressing this issue, microneedle delivery was used to enhance permeation flux of lidocaine hydrochloride and the penetration depths of microparticles delivered by gene gun (Nayak et al., Citation2014b; Zhang et al., Citation2013, Citation2014). Moreover, optimized ultrasound combined with microneedles to further increase the permeation rates was proposed (Han & Das, Citation2013; Nayak et al., Citation2014a). Recently, sonophoretic TDD has been used with commercially lipid MBs to enhance the delivery. However, the penetration depth, concentration and efficiency of transdermal delivery after US treatment with MBs are still unclear and have been evaluated in this study. The optimal conditions of the MBs for TDD have also been achieved.
US-enhanced TDD has been studied extensively since the 1950s, initially involving high-frequency (≥0.7 MHz) sonophoresis (HFS) (Newman et al., Citation1958), with low-frequency (20–100 kHz) sonophoresis (LFS) subsequently receiving increasing attention during the 1980s and 1990s (Mitragotri et al., Citation1995; Ueda et al., Citation2009). HFS typically enhances skin penetration by up to 10-fold (Polat et al., Citation2011a,Citationb), while LFS at 20 kHz has been shown to be up to three orders of magnitude more effective than HFS at 1 MHz (Mitragotri et al., Citation1995, Citation1996). The ability of LFS to allow nanoparticles as large as around 100 nm to penetrate the stratum corneum and enter the viable epidermal and dermal skin layers has recently been demonstrated (Lopez et al., Citation2011).
MBs are now applied in clinical applications as contrast agents for US imaging via intravenous injection. The application of a sound field will induce oscillations in MBs and give rise to several distinct effects associated with acoustic cavitation. Inertial cavitation and the associated destruction of MBs can enhance the permeability of the surrounding tissues and increase the extravasation of drugs from the blood into the cytoplasm or interstitium. Stable cavitation induced by high-frequency US can also mildly increase tissue permeability without causing any damage even at high acoustic pressures (Kang & Yeh, Citation2012). MBs have also been used to temporarily disrupt the blood–brain barrier with low-intensity US or as the carriers for targeted drug delivery (Liu et al., Citation2012). Sonophoretic TDD has been used with commercially available lipid MBs (Definity®) to enhance the delivery of the optical clearing agent glycerol into porcine skin via cavitation (Park et al., Citation2010). More recently, fluorescein–isothiocyanate–dextran was combined with 0.1% MBs for delivery through the skin, with the feasibility of controlled cavitation using commercial lipid MBs (SonoVue®, Bracco, Milan, Italy and Definity®, Bristol-Myers Squibb Medical Imaging, N. Billerica, MA) at high frequency being explored in a rat model (Park et al., Citation2012). However, mixing a treatment drug with MBs may adversely influence their lifetime and acoustic properties, and so the penetration depth, concentration and efficiency of this method for TDD are still unclear.
Melanin in the skin is primarily manufactured by the melanin mother cells in the basal layer of the epidermis. Tyrosinase enzyme, a copper-containing enzyme, is required for the formation of melanin. When skin is exposed to ultraviolet (UV) irradiation, adrenocorticotropic hormone and alpha-melanotropin stimulate the proliferation and melanogenesis of human melanocytes to increase the amounts of tyrosinase, TRP-1 and TRP-2 (Abdel-Malek et al., Citation1995; Chan et al., Citation2011). The next step, the hydroxylation of l-tyrosine to dopaquinone (to produce l-dopaquinone), generates eumelanin and pheomelanin that accumulate in the basal skin layer (Slominski et al., Citation2004). The availability of l-tyrosine for enzymatic oxidation is a central component of melanogenesis.
Many substances can be used to inhibit tyrosinase to achieve a skin-whitening effect, such as vitamin C, kojic acid, hydroquinone and arbutin (Chan et al., Citation2011). Arbutin (β-arbutin, molecular weight = 272.25 Da) is extracted from bearberry leaf. It is a glycosylated derivative of hydroquinone (4-hydroquinone-β-d-glucopyranoside), which is a highly hydrophilic (log p value = −1.49). Some recent studies have catalyzed the synthesis of α-arbutin (4-hydroquinone-α-d-glucopyranoside, molecular weight = 272.25 Da) by hydroquinone and carbohydrates, which can inhibit the activity of tyrosinase enzyme and reduce the formation of melanin while not affecting cell growth or inducing cell toxicity (Sugimoto et al., Citation2004; Huang et al., Citation2012). The inhibition of tyrosinase activity was found to be up to 10 times greater for α-arbutin than for β-arbutin (Seo et al., Citation2012; Liu et al., Citation2013). α-Arbutin has been widely approved as an additive in cosmetics for enhancing the skin-whitening effect.
This study evaluated the penetration depth, concentration and efficiency of transdermal α-arbutin delivery after US treatment with laboratory-made albumin-shelled MBs for skin lightening in mice over a 4-week period.
Materials and methods
Preparation of albumin-shelled MBs
Albumin-shelled MBs were prepared according to the procedure used in our previous studies (Liao et al., Citation2012b; Wang et al., Citation2012; Shih et al., Citation2013). Briefly, albumin-shelled MBs were generated by sonication in 10 ml of solution containing 140 mg of albumin (Octapharma, Vienna, Austria) and perfluorocarbon gas in physiological saline (pH 7.4, 0.9% sodium chloride) using a sonicator (Branson Ultrasonics, Danbury, CT) for 2 min. The number of perfluorocarbon-filled albumin-(Gd-DTPA) MBs in the solution was measured with the MultiSizer III device (Beckman Coulter, Fullerton, CA) using a 30-µm-aperture probe with measurement boundaries of 0.6–20 µm. The size distribution in the suspension was measured based on dynamic light scattering (Zetasizer Nano, ZS90, Malvern Instruments, Malvern, UK). The albumin-shelled MBs had a mean diameter of 1.2 μm and a mean concentration of 2.9 × 10⁹/ml.
Measurements of penetration depth in agarose phantoms
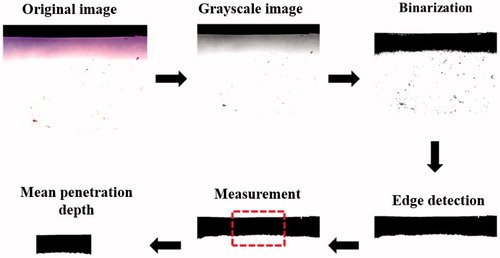
shows a schematic diagram of the system setup. The model drug, Evans blue (0.1 mg; molecular weight = 960.81 Da; E2129, Sigma-Aldrich, St Louis, MO), was dissolved in 10 ml of physiological saline (0.9% sodium chloride) and then stirred for 1 h at 4 °C. A 0.3%-agarose phantoms were constructed with a radius of 1.2 cm, a height of 5 mm round area (encircled with US gel to prevent leakage); the round area of each phantom was loaded with Evans blue or MBs. The probe of the sonoporation gene transfection system (ST 2000 V, NepaGene, Ichikawa, Japan) was placed 5 mm from the top of the phantom. After adding 600 µl of the original, 10-fold-diluted or 100-fold-diluted MBs, the area was sonicated by the 1-MHz US transducer of the sonoporation system successively at the following acoustic powers: 1 W/cm2 for 1 min, 2 W/cm2 for 1 min and 3 W/cm2 for 1 min. The duty cycle was set at 50% and a 1.2-cm-diameter transducer was used. The change in temperature during the various energy (2, 3 W/cm2) of US sonication for 1 min in 37 °C was only ± 0.3 °C, as measured by a thermometer (Optris LS, Optris, Berlin, Germany). The MBs were subsequently removed from the surface and the area was washed three times for 1 min with physiological saline. The Evans-blue solution was then injected into the area on the phantom for 5, 10, 15 or 20 min. The Evans blue was removed and the area was washed three times for 1 min with physiological saline. Sections (2 mm thickness of the phantom) were cut and prepared for light-microscopy evaluation. The penetration depths of the Evans blue were measured using MATLAB (The MathWorks, Natick, MA). The image-processing procedure is shown in . At first, the light-microscopy images were converted into grayscale images and image histogram-based binarization was performed (Sezgin & Sankur, Citation2004). For histogram-based binarization, the peak-and-valley thresholding of target was performed based on the histogram for many experiments (Sezgin & Sankur, Citation2004). Then, the boundary was detected by Sobel-operator-based edge detection (Ahammer & DeVaney, Citation2004). At this step, the same threshold was used when processing all of the images. Finally, the area of the penetration region was measured and the area was divided by the length of the x-axis of the image to get the mean penetration depth (y-axis) of the Evans blue.
Figure 1. (A) Schematic diagram of the US system setup for the phantom and pigskin experiments. (B) System setup for measuring in vitro skin penetration using static Franz diffusion cells. (C) Schematic cross-sectional drawing of the skin and the drug delivery. SC = stratum corneum, L = stratum lucidum, G = stratum granulosum, S = stratum spinosum, B = basal layer, PBS = phosphate-buffered saline.
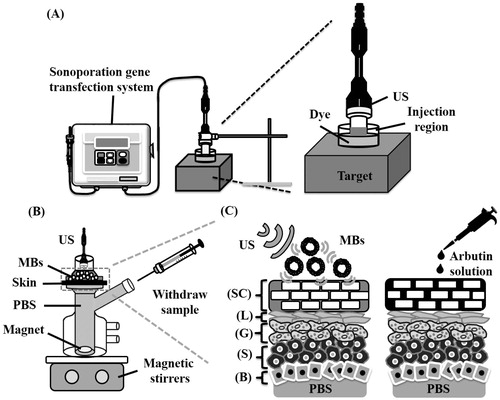
Figure 2. Image-processing procedure for measuring the penetration depth in agarose phantoms.
Measurements of penetration depth in pigskin
Fresh porcine skin was obtained from a local slaughterhouse. The protocol for the experiments involving pigskin was similar to that described for agarose phantom. The treatment area on 2-mm-thick pigskin was sonicated by the 1-MHz US transducer of the sonoporation system successively at acoustic pressures of 1 W/cm2 for 1 min, 2 W/cm2 for 1 min and 3 W/cm2 for 1 min after adding 600 µl of MBs. The MBs were removed and the area was washed three times for 1 min with physiological saline. The Evans-blue solution was then applied to the area on the pigskin for 5, 10, 15 or 20 min. The Evans blue was subsequently removed from the surface and the area was washed three times for 1 min with physiological saline. The treated areas of pigskin were cut-off and then embedded with Surgipath FSC 22 optimal-cutting-temperature solution (Leica Microsystems, Buffalo Grove, IL) on round specimen disks with a diameter of 2.2 cm. The embedded samples were placed on the −25 °C freezing stage of a cryostat (Microm HM550 series, Thermo, Braunschweig, Germany) for about 30 min. Transverse sectioning was performed at a slice thickness of 5 μm. Sections attached to the microscopy slides were air-dried at room temperature and mounted for microscopy examination. The average penetration depth was measured by sampling 10 depths in each slide.
In vitro skin penetration by α-arbutin solution
Female C57BL/6J mice weighing 20–25 g were euthanized by CO2 asphyxiation. The dorsal hairs were shaved with clippers and a full-thickness skin specimen was surgically removed, carefully cleaned with physiological saline (pH 7.4), and cut into square pieces (2 cm × 2 cm). In vitro skin penetration was tested using static Franz diffusion cells over an area of 2.14 cm2 according to the experimental design shown in . The experimental animals were randomly divided into the following four groups (n = 8 animals per group): (1) penetrating α-arbutin alone (C), (2) US combined with penetrating α-arbutin (U), (3) US combined with MBs and penetrating α-arbutin (UB), and (4) US combined with 10-fold-diluted MBs and penetrating α-arbutin (UBD). The temperature of the diffusion assembly was maintained at 37 °C. The probe of the sonoporation system and the MBs in saline or α-arbutin (First Chemical Works, Taipei, Taiwan, ROC) in distilled water (2%, 400 μl) (as a control) were applied to the donor cells facing the stratum corneum side of the skin, and occluded with parafilm. The receptor diffusion half cell facing the dermis side was filled with phosphate-buffered saline (pH 7.4, 12 ml) containing a stirring bar at 600 rpm and 0.01% gentamicin to prevent bacterial degradation of α-arbutin during the penetration process. Instead of MBs, the solutions in the diffusion cell were filtered through a 0.2-μm micropore filter (Nalgene, Rochester, NY) or a 0.22 -μm micropore filter (Millex, Darmstadt, Germany). Aliquots (200 μl) of receptor solution were taken after various time intervals (1, 2, 3, 4, 5, 6, 7 and 8 h), with the cell then refilled with the same volume of fresh receptor solution. Samples were kept in a freezer until analyzed by high-performance liquid chromatography (HPLC). At the end of the penetration experiments (8 h), the skin was detached from the diffusion cells and carefully rinsed five times with distilled water to remove excess arbutin from its surface.
HPLC analysis of arbutin
An Inspire™ C18 column (250 mm × 4.6 mm, 5 μm particle size; Dikma Technologies, Lake Forest, CA) was used in the analysis of arbutin concentrations. The HPLC system was equipped with a binary pump (PU-2089, Jasco, Tokyo, Japan), and the wavelength of the UV detector (UV-2075, Jasco, Tokyo, Japan) was set at 280 nm. The mobile phase consisted of methanol:distilled water (pH 5.5, 15:85 v/v) (Wen et al., Citation2006) at a flow rate of 1 ml/min. All samples to be analyzed were injected at a volume of 10 μl. The retention time of arbutin was about 20 min.
Animal treatments
The melanin content of origanoside was investigated in the C57BL/6J mouse model (Ishikawa et al., Citation2007). Five-week-old mice weighing 20–25 g were obtained from Bio Lasco (Taipei, Taiwan). The experimental protocol was approved by the Institutional Animal Care and Use Committee of the National Defense Medical Center, Taipei, Taiwan. Animal care complied with institutional guidelines and regulations. Throughout the experiments the animals were housed in stainless-steel cages in an air-conditioned room with the temperature maintained at 25–28 °C and with alternating light and dark cycles of 12 h each. The animals were acclimatized for 7 d prior to the experiment. After their hair had been removed, the skin color was measured using a Chroma Meter (CR-400, Konica Minolta Sensing, Tokyo, Japan). The animals were exposed to ultraviolet radiation B (UVB) irradiation (G8T5E, Sankyo, Tokyo, Japan) to induce hyperpigmentation (total energy dose per exposure = 1 J/cm2, wavelength = 306 nm, three times/week for 2 weeks), and then the skin color was measured again. The animals were divided into the following five groups (n = 5 per group, treatment applied three times/week for 4 weeks): (1) no treatment (C1), (2) penetrating α-arbutin alone (0.02%, 1 ml/cm2) (C2), (3) US combined with penetrating α-arbutin (0.02%, 1 ml/cm2) (U), (4) US combined with MBs and penetrating α-arbutin (0.02%, 1 ml/cm2) (UB) and (5) US combined with 10-fold-diluted MBs and penetrating α-arbutin (0.02%, 1 ml/cm2) (UBD). The change in skin color induced by each of the treatments was assessed at predetermined times using the Chroma Meter. The luminosity index, L (Tsai et al., Citation2010), was calculated on each measurement day before and after treatment.
Histochemistry
Skin tissue samples (approximately 8 mm × 8 mm) were taken from the treatment area immediately after the experiments and stored in a 10% formalin solution. Hematoxylin and eosin (Sigma-Aldrich) staining was applied, and the samples were analyzed by an expert histologist.
Statistical analysis
The obtained data were analyzed statistically using Student’s t-test. A probability value of p < 0.05 was considered indicative of a significant difference. Data are presented as mean ± SD values.
Results
Evaluations of the penetration depth in agarose phantoms
The delivery of the Evans-blue solution was not observed in the agarose phantoms after sonication at an acoustic pressure of 1 W/cm2, while sonicating at 4 W/cm2 damaged the structure of the phantom; therefore, only the results for acoustic pressures of 2 W/cm2 and 3 W/cm2 are presented. shows microscopy images of the agarose phantoms after US (at acoustic pressures of 2 W/cm2 and 3 W/cm2), US combined with MBs (2.9 × 10⁹/ml), US combined with 10-fold-diluted MBs (2.9 × 10⁸/ml), and US combined with 100-fold-diluted MBs (2.9 × 10⁷/ml) (n = 4) when the Evans-blue solution was allowed to stand for 15 min. In group US (either 2 W/cm2 or 3 W/cm2) there was no significant difference (p > 0.05) in the penetration depth. However, the penetration depths were 30, 152 and 52% greater for 2-W/cm2 US than for 3-W/cm2 US after adding the original MBs, 10-fold-diluted MBs and 100-fold-diluted MBs, respectively (). In the 2-W/cm2 group, the penetration depth was greater for 10-fold-diluted MBs (562.8 ± 25 μm) than in the other three groups (control: 340.6 ± 65 μm, US combined with MBs: 435.4 ± 45 μm, and US combined with 100-fold-diluted MBs: 319.2 ± 18 μm). Therefore, the enhancement of the penetration depth was greatest for 2-W/cm2 US combined with 10-fold-diluted MBs and the condition was used either for the in vitro skin penetration or for the animal treatments.
Figure 3. Microscopy images of agarose phantoms after 2-W/cm2 or 3-W/cm2 US combined with MBs (2.9 × 10⁹/ml), 10-fold-diluted MBs (2.9 × 10⁸/ml) and 100-fold-diluted MBs (2.9 × 10⁷/ml) (n = 4).
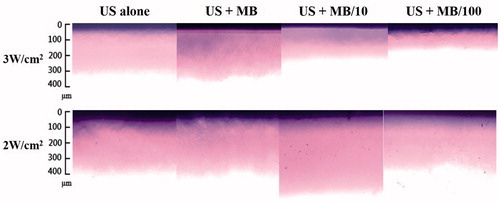
Table 1. Quantification of the microscopy images of the agarose phantoms after treatments by 2-W/cm2 or 3-W/cm2 US combined with MBs (2.9 × 10⁹/ml), 10-fold-diluted MBs (2.9 × 10⁸/ml) and 100-fold-diluted MBs (2.9 × 10⁷/ml) (n = 4).
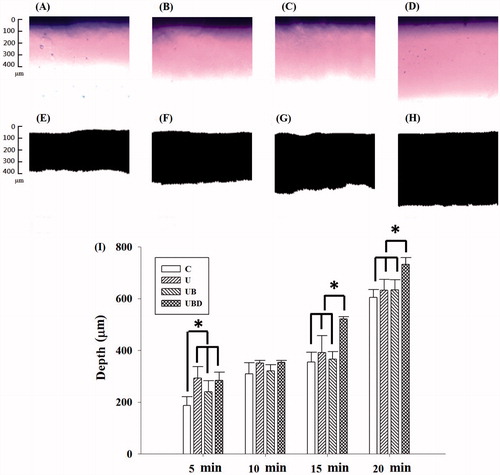
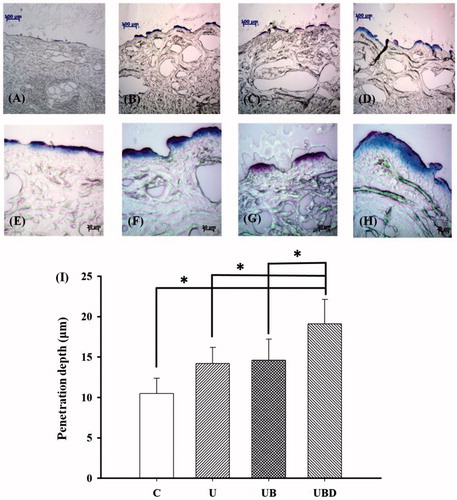
presents images obtained before and after image processing using MATLAB for control (), 2-W/cm2 US (), 2-W/cm2 US combined with MBs (), and 2-W/cm2 US combined with 10-fold-diluted MBs (UBD) () when the Evans-blue solution was allowed to stand for 15 min. quantifies the penetration depths in the four groups when the Evans-blue solution was allowed to stand for various times (5, 10, 15 or 20 min). When the Evans blue was allowed to stand for 15 min, the penetration depth in group UBD was 47, 33 and 42% more than those in groups C, UB and UBD, respectively; the corresponding differences for 20 min were 21, 16 and 15%, indicating that the optimal time for allowing the Evans blue to stand was 15 min for US treatment combined with MBs.
Figure 4. Microscopy images before and after image processing using MATLAB for control (C) group (A, E), 2-W/cm2 US (U group; B, F), 2-W/cm2 US combined with MBs (UB group; C, G), and 2-W/cm2 US combined with 10-fold-diluted MBs (UBD group; D, H) when the Evans-blue solution was allowed to stand for 15 min. (I) Quantification of the penetration depths in the four groups when the Evans blue was allowed to stand for various times (5, 10, 15 or 20 min). *p < 0.05; data are mean and SD values.
Evaluations of the penetration depth in pigskin
The pigskin samples in groups C, U, UB and UBD were then cryosectioned for light-microscopy evaluation at magnifications of × 100 () and × 400 () (Primo Star, Zeiss-Jena, Jena, Germany). shows measurements of the penetration depths in the four groups (n = 4) when the Evans blue was allowed to stand for 15 min. The degree of penetration in either the cuticle or the epidermis was significantly greater in groups U, UB and UBD than in group C (p < 0.05), and greatest in group UBD. The mean penetration depth in group C was 13.1 ± 2.0 μm. This increased to 18.6 ± 2.6 μm after US treatment, but then reduced back to being similar to that in group U after adding MBs at the original concentration. When the MBs were diluted 10-fold (group UBD), the penetration depth was 83, 35 and 31% higher than in groups C, U and UB, respectively (p < 0.05).
Figure 5. Representative histological sections of pigskin in groups C, U, UB and UBD imaged by bright-field microscopy at magnifications of × 100 (A–D) and × 400 (E–H). (I) Quantification of the penetration depths in the four groups when the Evans blue was allowed to stand for 15 min. C = control group, U = 2 -W/cm2 US group, UB = 2-W/cm2 US combined with MBs group, and UBD = 2-W/cm2 US combined with 10-fold-diluted MBs group. *p < 0.05; data are mean and SD values.
In vitro skin penetration by α-arbutin solution
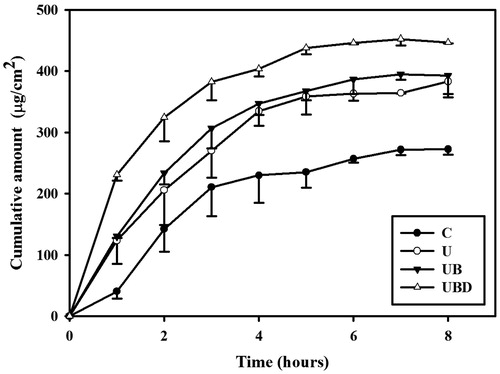
shows the α-arbutin concentrations in the four groups for percutaneous penetration over 8 h as analyzed using HPLC. During the first 3 h the concentrations in all groups increased steeply, reaching 210.5 ± 47.1, 269.9 ± 44.1, 306.4 ± 32.9 and 382.2 ± 30.1 μg/ml in groups C, U, UB and UBD, respectively, and then gradually leveled off between 4 to 8 h; at 8 h the concentrations were 272.3 ± 9.0, 383 ± 20.6, 393.6 ± 35.3 and 446.1 ± 1.2 μg/ml. The concentration differed significantly (p < 0.05) between groups C, UBD, and group UB/group U, with no significant difference between groups U and UB.
Figure 6. α-Arbutin concentrations in groups C, U, UB and UBD for percutaneous penetration over 8 h as analyzed using HPLC. C = control group, U = 2-W/cm2 US group, UB = 2-W/cm2 US combined with MBs group, and UBD = 2-W/cm2 US combined with 10-fold-diluted MBs group. Data are mean and SD values.
Animal treatments
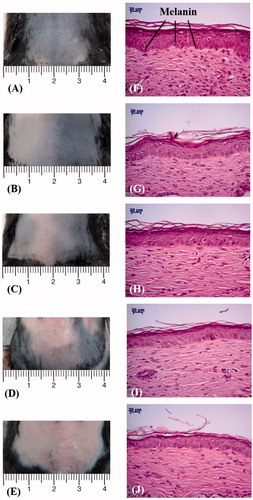
shows photographs of mouse skin () and histology images () in groups C1 (), C2 (), U (), UB (D and I) and UBD () at week 4. shows that the brightness of the skin in group C2 had mildly recovered. The skin brightness in group UBD was more effectively increased and closer to the original color than in group U or UB. Moreover, no skin damage was evident in any of the US treatment groups. Histology analysis revealed that UBD treatment resulted in a significant decrease in the relative melanin content. Changes in skin structures or bilayer–bilayer interfaces were not observed in any of the treatment groups.
Figure 7. Photographs of mouse skin (A–E) and histology images (F–J) in groups C1, C2, U, UB and UBD at week 4 of treatment. C1 = no treatment group, C2 = penetrating α-arbutin alone group, U = 2-W/cm2 US combined with penetrating α-arbutin group, UB = 2-W/cm2 US combined with MBs and penetrating α-arbutin, and UBD = 2-W/cm2 US combined with 10-fold-diluted MBs and penetrating α-arbutin.
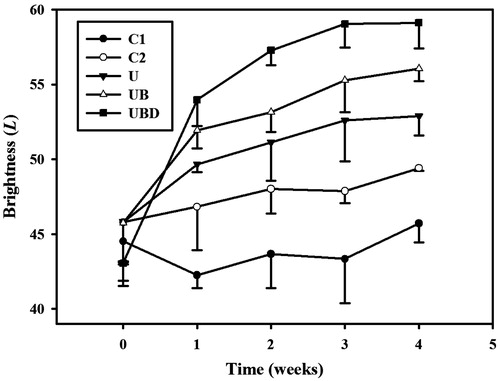
plots the brightness values (i.e. L) to demonstrate the whitening effects of α-arbutin on UV-induced hyperpigmentation over 4 weeks. The brightness value was around 45 in each group after UVB exposure. At week 1, the brightness value in group UBD had increased by 25%. Significant differences (p < 0.05) were obvious between each treatment group and group C1, but not between groups U, UB and UBD. At week 2, the brightness values in groups C2, U, UB and UBD had increased by 5, 12, 16 and 34%, respectively. At week 3, the brightness value in group UBD increased by 37%, making it close to the original skin color, while those in groups U and UB increased by lesser amounts (by 15 and 21%, respectively). At week 4, the brightness values in groups U, UB and UBD had reached plateaus, with increases of 16, 23 and 37%, respectively, while those in groups C1 and C2 had increased by 4 and 8%, respectively. The mean ± SD brightness value before UVB exposure is 60.11 ± 1.08. Only the UBD groups at 3rd and 4th weeks closed to the original value before exposure.
Figure 8. Skin-whitening effects of α-arbutin on UV-induced hyperpigmentation in groups C1, C2, U, UB, and UBD over 4 weeks. C1 = no treatment group, C2 = penetrating α-arbutin alone group, U = 2-W/cm2 US combined with penetrating α-arbutin group, UB = 2-W/cm2 US combined with MBs and penetrating α-arbutin, and UBD = 2-W/cm2 US combined with 10-fold-diluted MBs and penetrating α-arbutin. Data are mean and SD values.
Discussion
Cavitation is believed to be the main mechanism of sonophoresis in TDD (Park et al., Citation2014). US-enhanced transdermal transport is mediated by inertial cavitation, where cavitation-induced collapses of MBs disrupt the lipid bilayers of the stratum corneum (Tezel & Mitragotri, Citation2003). The evaluations of penetration depth in agarose phantoms in the present study indicated that the delivery efficiency was greater for an acoustic pressure of 2 W/cm2 for 1 min than for one of 3 W/cm2 for 1 min, which contrasts with our previous study finding that the MB destruction was more obvious when using 3 W/cm2 for 1 min than 2 W/cm2 for 1 min (Liao et al., Citation2012a). It indicates that the greater MB destruction during US treatment did not influence the sonophoresis in TDD. However, the delivery efficiency was greater when using the 10-fold-diluted MBs. The concentration of the MBs was not positively correlated with the delivery efficiency. Furthermore, after increasing the permeability the drug needs to be present for a sufficient time to ensure its efficient delivery. The results in the present study for pigskin were similar to those for the phantoms.
Some previous studies encapsulated arbutin in liposome to enhance the skin-whitening activity; this approach increased the amount of arbutin deposited in the epidermis/dermis layers (Hincha et al., Citation1999; Wen et al., Citation2006), and its effects were comparable to those for the arbutin solutions in the present study that had stood for 4 and 8 h, while standing for 12 h increased it significantly. shows that the concentrations in all groups increased steeply during the first 3 h, and then more gradually from 4 to 8 h. Our results indicate that combining US with MBs increased the delivered concentration of α-arbutin and did not influence the time trend of α-arbutin delivery. The difference in concentration between groups UBD and C was greatest after 5 h of α-arbutin permeation, and hence this is suggested to be the optimal standing time for the α-arbutin on the skin for treatment combining US with MBs.
Furthermore, and indicate the efficacy on lightening of the topical application of α-arbutin after US combined with 10-fold-diluted MBs to the ventral skin of C57BL/6 J mouse in which hyperpigmentation had been induced by exposure to UVB. This suggests that the lightening effects exerted by α-arbutin are attributable to the inhibition of melanin production in active melanocytes. In our animal experiments, the lightening effect was not observed in group C1 until week 4, and it was both small and relatively slow, which suggests that the hydrophilic nature of α-arbutin limits its penetration of lipid bilayers in the stratum corneum. The effects were better in group U than in groups C1 and C2 due to the US-induced cavitation increasing the permeability of the lipid bilayer. Adding MBs significantly improved the effects at 4 weeks, especially for 10-fold-diluted MBs. These results indicate that MBs are effective at enhancing penetration for transdermal delivery. Moreover, after US treatment with MBs in mice, more α-arbutin passed through the stratum corneum lipid bilayer and directly affected the tyrosinase activity so as to inhibit the formation of melanin.
Conclusions
Combination therapy with MBs and US can improve the penetration depth, concentration and efficiency of transdermal α-arbutin delivery relative to either the drug alone or US alone. The optimal standing time for the α-arbutin on the skin is suggested to be 5 h after treating with US combined with MBs. During 4 weeks of in vivo treatment, the brightness value increased more in group UBD than in the other groups at week 3, and reached a plateau phase at week 4. The lightening effects exerted by α-arbutin on UVB-induced hyperpigmentation after US combined with 10-fold-diluted MBs inhibit the production of melanin by active melanocytes.
Declaration of interest
The authors declare that there is no conflict of interests of this paper.
This work was supported by the Tri-Service General Hospital of Taiwan under grant no. TSGH-C101-012 and the National Science Council of Taiwan under grant nos. 99-2218-E-011-031 and 100-2628-E-011-015-MY3.
References
- Abdel-Malek Z, Swope VB, Suzuki I, et al. (1995). Mitogenic and melanogenic stimulation of normal human melanocytes by melanotropic peptides. Proc Natl Acad Sci USA 92:1789–93
- Ahammer H, DeVaney TT. (2004). The influence of edge detection algorithms on the estimation of the fractal dimension of binary digital images. Chaos 14:183–8
- Alexander A, Dwivedi S, Ajazuddin, et al. (2012). Approaches for breaking the barriers of drug permeation through transdermal drug delivery. J Control Release 164:26–40
- Barry BW. (2001). Novel mechanisms and devices to enable successful transdermal drug delivery. Eur J Pharm Sci 14:101–14
- Chan YY, Kim KH, Cheah SH. (2011). Inhibitory effects of Sargassum polycystum on tyrosinase activity and melanin formation in B16F10 murine melanoma cells. J Ethnopharmacol 137:1183–8
- Han T, Das DB. (2013). Permeability enhancement for transdermal delivery of large molecule using low-frequency sonophoresis combined with microneedles. J Pharm Sci 102:3614–22
- Hincha DK, Oliver AE, Crowe JH. (1999). Lipid composition determines the effects of arbutin on the stability of membranes. Biophys J 77:2024–34
- Huang HC, Hsieh WY, Niu YL, Chang TM. (2012). Inhibition of melanogenesis and antioxidant properties of Magnolia grandiflora L. flower extract. BMC Complement Altern Med 12:72
- Ishikawa M, Kawase I, Ishii F. (2007). Glycine inhibits melanogenesis in vitro and causes hypopigmentation in vivo. Biol Pharm Bull 30:2031–6
- Kang ST, Yeh CK. (2012). Ultrasound microbubble contrast agents for diagnostic and therapeutic applications: current status and future design. Chang Gung Med J 35:125–39
- Liao AH, Li YK, Lee WJ, et al. (2012a). Estimating the delivery efficiency of drug-loaded microbubbles in cancer cells with ultrasound and bioluminescence imaging. Ultrasound Med Biol 38:1938–48
- Liao AH, Liu HL, Su CH, et al. (2012b). Paramagnetic perfluorocarbon-filled albumin-(Gd-DTPA) microbubbles for the induction of focused-ultrasound-induced blood-brain barrier opening and concurrent MR and ultrasound imaging. Phys Med Biol 57:2787–802
- Liu C, Deng L, Zhang P, et al. (2013). Screening of high α-arbutin producing strains and production of α-arbutin by fermentation. World J Microbiol Biotechnol 29:1391−8
- Liu HL, Yang HW, Hua MY, Wei KC. (2012). Enhanced therapeutic agent delivery through magnetic resonance imaging-monitored focused ultrasound blood-brain barrier disruption for brain tumor treatment: an overview of the current preclinical status. Neurosurg Focus 32:E41–12
- Lopez R, Seto J, Blankschtein D, Langer R. (2011). Enhancing the transdermal delivery of rigid nanoparticles using the simultaneous application of ultrasound and sodium lauryl sulfate. Biomaterials 32:933–41
- Marwah H, Garg T, Goyal AK, Rath G. (2014). Permeation enhancer strategies in transdermal drug delivery. Drug Deliv 9:1–15
- Mitragotri S, Blankschtein D, Langer R. (1995). Ultrasound-mediated transdermal protein delivery. Science 269:850–3
- Mitragotri S, Blankschtein D, Langer R. (1996). Transdermal drug delivery using low-frequency sonophoresis. Pharm Res 13:411–20
- Nayak A, Babla H, Han T, Das DB. (2014a). Lidocaine carboxymethylcellulose with gelatine co-polymer hydrogel delivery by combined microneedle and ultrasound. Drug Deliv 18:1–12
- Nayak A, Das DB, Vladisavljević GT. (2014b). Microneedle-assisted permeation of lidocaine carboxymethylcellulose with gelatine co-polymer hydrogel. Pharm Res 31:1170−84
- Newman MK, Kill M, Frampton G. (1958). Effects of ultrasound alone and combined with hydrocortisone injections by needle or hypo-spray. Am J Phys Med 37:206–9
- Park D, Park H, Seo J, Lee S. (2014). Sonophoresis in transdermal drug deliveries. Ultrasonics 54:56−65
- Park D, Ryu H, Kim HS, et al. (2012). Sonophoresis using ultrasound contrast agents for transdermal drug delivery: an in vivo experimental study. Ultrasound Med Biol 38:642–50
- Park D, Yoon J, Park J, et al. (2010). Transdermal drug delivery aided by an ultrasound contrast agent: an in vitro experimental study. Open Biomed Eng J 4: 56–62
- Polat BE, Figueroa PL, Blankschtein D, Langer R. (2011a). Transport pathways and enhancement mechanisms within localized and non-localized transport regions in skin treated with low-frequency sonophoresis and sodium lauryl sulfate. J Pharm Sci 100:512–29
- Polat BE, Hart D, Langer R, Blankschtein D. (2011b). Ultrasound-mediated transdermal drug delivery: mechanisms, scope, and emerging trends. J Control Release 152: 330–48
- Seo DH, Jung JH, Ha SJ, et al. (2012). High-yield enzymatic bioconversion of hydroquinone to α-arbutin, a powerful skin lightening agent, by amylosucrase. Appl Microbiol Biotechnol 94:1189–97
- Sezgin M, Sankur B. (2004). Survey over image thresholding techniques and quantitative performance evaluation. J Electron Imaging 13:146–68
- Shih CP, Chen HC, Chen HK, et al. (2013). Ultrasound-aided microbubbles facilitate the delivery of drugs to the inner ear via the round window membrane. J Control Release 167:167–74
- Slominski A, Tobin DJ, Shibahara S, Wortsman J. (2004). Melanin pigmentation in mammalian skin and its hormonal regulation. Physiol Rev 84:1155–228
- Sugimoto K, Nishimura T, Nomura K, et al. (2004). Inhibitory effects of alpha-arbutin on melanin synthesis in cultured human melanoma cells and a three-dimensional human skin model. Biol Pharm Bull 27:510–14
- Tezel A, Mitragotri S. (2003). Interactions of inertial cavitation bubbles with stratum corneum lipid bilayers during low-frequency sonophoresis. Biophys J 85:3502–12
- Tsai YH, Lee KF, Huang YB, et al. (2010). In vitro permeation and in vivo whitening effect of topical hesperetin microemulsion delivery system. Int J Pharm 388:257–62
- Ueda H, Mutoh M, Seki T, et al. (2009). Acoustic cavitation as an enhancing mechanism of low-frequency sonophoresis for transdermal drug delivery. Biol Pharm Bull 32:916–20
- Wang YH, Liao AH, Chen JH, et al. (2012). Photoacoustic/ultrasound dual-modality contrast agent and its application to thermotherapy. J Biomed Opt 17:045001–1–8
- Wen AH, Choi MK, Kim DD. (2006). Formulation of liposome for topical delivery of arbutin. Arch Pharm Res 29:1187–92
- Zafar S, Ali A, Aqil M, Ahad A. (2010). Transdermal drug delivery of labetalol hydrochloride: feasibility and effect of penetration enhancers. J Pharm Bioallied Sci 2:321–4
- Zhang D, Das DB, Rielly CD. (2013). Potential of microneedle-assisted micro-particle delivery by gene guns: a review. Drug Deliv, 1–17
- Zhang D, Rielly CD, Das DB. (2014). Microneedle-assisted microparticle delivery by gene guns: experiments and modeling on the effects of particle characteristics. Drug Deliv, 1–16