
 ?Mathematical formulae have been encoded as MathML and are displayed in this HTML version using MathJax in order to improve their display. Uncheck the box to turn MathJax off. This feature requires Javascript. Click on a formula to zoom.
Abstract
In this study, a novel lymphatic tracer polyamidoamin-alkali blue (PAMAM-AB) was synthesized in order to evaluate the intra-lymphatic targeting ability and lymphatic tropism of PAMAM-AB after subcutaneous administration. UV-Vis, FT-IR, NMR and HPLC characterization were performed to prove the successful synthesis of PAMAM-AB. The calculated AB payload of PAMAM-AB conjugate was seven per dendrimer molecule (27.16% by weight). Hydrolysis stability of PAMAM-AB in vitro was evaluated, which was stable in PBS and human plasma. Lymphatic tracing were studied to determine the blue-stained intensity of PAMAM-AB in right popliteral lymph nodes (PLNs), iliac lymph nodes (ILNs) and para-aortic lymph nodes (PALNs) after subcutaneous administration. The pharmacokinetics and biodistribution of PAMAM-AB in mice were investigated. PLNs, ILNs and PALNs could be obviously blue-stained within 10 min after PAMAM-AB administration, and displayed a more rapid lymphatic absorption, a higher AUC value in lymph nodes and a longer lymph nodes residence time compared with methylene blue solution (MB-S), MB water-in-oil microemulsion (MB-ME), MB multiple microemulsion (MB-MME). Enhanced lymphatic drainage from the injection site and uptake into lymph of PAMAM-AB indicated that PAMAM-AB possesses the double function of lymphatic tracing and lymphatic targeting, and suggested the potential for the development of lymphatic targeting vectors or as a lymphatic tracer in its own right.
Introduction
Presently, cancer remains the second leading cause of death after heart disease. Lymph-node status is a major prognostic implication in the staging and the ultimate prognosis of patients with malignancies (Fisher et al., Citation1983; Dowlatshahi et al., Citation1997; Kobayashi et al., Citation2006; Satish et al., Citation2011). In some cases, only a few lymph nodes can be identified by traditional methods, because it is technically difficult, in a blood-stained operative field, to identify lymph nodes and draining lymphatic vessels hidden in the adjacent fat. Consequently, elective lymph node dissection (ELND) is the most important means which improves the quality of patients’ life and prolongs their life span. The significant change occurred in the early 1990s when sentinel lymph node biopsy (SLNB) was introduced for the management of cutaneous melanoma patients without clinical evidence of draining lymph node metastases (Morton et al., Citation1992; Alex et al., Citation1993). There is significant interest in the development of imaging methods to accurately map the drainage of solid tumors through lymph nodes, specifically sentinel lymph nodes (SLNs) (Clement & Luciani, Citation2004; Barrett et al., Citation2006; Luciani et al., Citation2006; Misselwitz, Citation2006; Choi et al., Citation2007; Lohrmann et al., Citation2009; Ratnesh et al., Citation2009). SLNs are considered the first lymph node or group of nodes reached by metastasizing cancer cells from the solid tumor, and the probability of finding metastatic tumor cells is more likely to be compared to other lymph nodes. Since then, mercury injections, dyes and radioactive isotope have all been employed to visualize the lymphatic drainage of solid tumors (Reitsamer et al., Citation2003; Khalil et al., Citation2008). Since Giuliano et al. (Citation1994) used 1.0% isosulfan blue (IB) for breast SLNB, doctors from different countries have tried various dyes with a view to achieve best results of SLNB. Till now, several vital dyes have been developed, like IB, patent blue (PB) (Koller et al., Citation1998; Noguchi et al., Citation1999) and methylene blue (MB). IB and PB, for a weak combination of protein will be quickly absorbed into lymph vessels after subcutaneous injection, and rarely spread to surrounding tissues. But the relatively rapid washout from SLNs and the expensive price limit their use in SLNB (Liu et al., Citation2000). Excessive doses of MB used in SLNB could cause lymph vessels, interstitial spaces and blood capillaries blue stained, and small dose could not obviously stain draining lymph nodes resulting in a low detection rate of SLNB. To this point, if novel dark blue or black macromolecules or colloids were employed for subcutaneous administration, which could preclude from ready access to the vascular capillaries and instead enter lymphatics via the large inter-endothelial gaps that open under conditions of lymphatic filling, resulting in more accurate and effective tracing.
The 20th century has witnessed impressive innovations in polymer synthesis and advances in the design of biodegradable chemistries. The first reports on dendrimers synthesis are attributed to Vogtle group (Buhleier et al., Citation1978) in the late 1970s, followed by the work of Tomalia et al. (Citation1985) in the early 1980s. Dendrimers with a number of synthetic scaffolds have previously been shown to promote passive tumor targeting via the enhanced permeation and retention effect (Tomalia et al., Citation2007; Lei et al., Citation2008; Lim et al., Citation2009). Due to similarities in size and highly branched, monodisperse three dimensional (3D) globular structure in nanometer scale, dendrimers have, in several instances, been referred to as “artificial proteins” (Tam & Spetzler, Citation2001; Chen et al., Citation2003). Consequently, dendrimers have the potential to exhibit similar physicochemical properties to proteins but to show improved stability to conditions that would otherwise promote rapid and uncontrolled degradation. Multifunctional dendrimer surfaces are amenable to a wide range of chemical modifications, and the interior is characterized by the availability of a substantial amount of solvent-filled void space that might be suitable for host-guest chemistry. Dendrimers are multivalent owing to the presence of high multiplicities of reactive surface ending groups, making them ideal drug carriers with higher drug payload capacities (Yang & Lopina, Citation2007). Recently, studies have demonstrated the utility of dendrimers as therapeutic and imaging agents and reported good lymphatic uptake of draining lymphatics, making them ideal candidates as lymph-targeted delivery systems (Kobayashi et al., Citation2001, Citation2004, Citation2007; Mounzer et al., Citation2007).
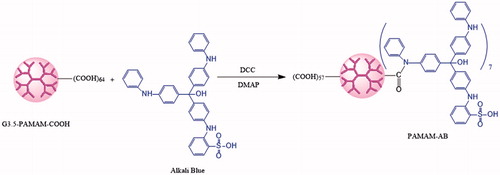
Alkali Blue (AB) is a water-insoluble dark-blue acid-base indicator for the determination of petroleum and biological staining (). Acylation reaction can be done owing to secondary amine groups of AB and carboxyl ending groups of PAMAM structure. In this study, a novel dark-blue polyamidoamin-alkali conjugate (PAMAM-AB) was synthesized by coupling AB to PAMAM dendrimer through amide bonds, and was systematically confirmed by UV-Vis, NMR, FT-IR and HPLC method. Hydrolysis stability, lymphatic tracing, lymphatic drainage and uptake, and tissue distribution were investigated. We report on the noteworthy scientific advances and the most recent literature for the first time the design and synthesis of PAMAM-AB.
Figure 1. Schematic representation of synthesis of PAMAM-AB conjugates.
Materials and methods
Materials
PAMAM-G3.5-COOH (molecular weight = 11 520 g/mol, 64 carboxyl end groups) was purchased from Weihai CY Dendrimer Technology Co., Ltd (Weihai, China). Alkali Blue was obtained from Shanghai Sanaisi Agent Company (Shanghai, China). N,N′-dicyclohexylcarbodiimide (DCC), 4-dimethylaminopyridine (DMAP) and Dimethyl sulfoxide (DMSO) were purchased from Sinopharm Chemical Reagent Co., Ltd (Beijing, China). Methylene Blue (MB) was purchased from Shenyang Agent Co. (Shenyang, China). Other reagents of HPLC grade were from Dikma Technologies Inc. (Beijing, China).
Animals
Male KM mice (20 ± 2 g) were purchased from the Laboratory Animal Center, Shenyang Pharmaceutical University (Shenyang, China). The mice were housed in room temperature and humidity, and had access to water and food ad libitum. Animals were kept under fasting overnight prior to the experiment. All animal experiments were performed according to guidelines “Principles of' Laboratory Animal Care” (NIH publication #85-23, revised in 1985) and approved by the Animal Ethics Committee of Shenyang Pharmaceutical University.
Synthesis and characterization of PAMAM–AB conjugates
For PAMAM-amide-AB synthesis, the acylation method was used. PAMAM–AB was synthesized in DMSO using DCC as a condensation agent and DMAP as a catalyst. The synthetic route for the dendrimer ligand is illustrated in . Briefly, 50 mg generation 3.5 (G3.5) PAMAM dendrimer with the –COOH terminal, 28.66 mg DCC and 4.24 mg DMAP were completely dissolved in anhydrous DMSO in a reaction flask and stirred for 2 h at room temperature for the activation of PAMAM dendrimer. Then, 42.62 mg AB dissolved in anhydrous DMSO was added to the reaction mixture at ambient temperature with constant stirring. After 48 h reaction, a blue suspension was obtained, and was filtered through filter papers. The filtrate was then subjected to dialysis against deionized water with molecular weight cut-off (MWCO 7 000) membranes by substituting deionized water for DMSO, followed by the filtration for further purification. Freeze-drying was carried out to obtain the final product, which was characterized by UV-Vis, 1H NMR, FTIR and HPLC. HPLC characterization of PAMAM-AB was carried out with HITACHI L-2000 series (Tokyo, Japan) HPLC Instrument equipped with a L-2130 pump, a L-2200 autosampler and a L-2400 UV-detector according to the method reported with a little modification (Kurtoglu et al., Citation2010). Data were collected by a D-2000 Elite HPLC chromatography workstation. PLATISILTM ODS C18 reversed-phase column (5 μm, 250 × 4.6 mm, Dikma, Beijing, China) was used for the characterization of the conjugate. The separation was carried out with the mobile phase consisting of acetonitrile-water (8:92, v/v, 0.15% TCA) at a flow rate of 1.0 mL/min. Mobile phases were freshly prepared, filtered and degassed prior to the use. The UV absorbance detector was used at 289 nm and the temperature of the column was kept at 25 °C.
HPLC characterization of AB was carried out with HITACHI L-2000 series (Japan) HPLC Instrument. PLATISILTM ODS C18 reversed-phase column (5 μm, 250 × 4.6 mm, Dikma) was used for AB characterization. The separation was carried out with the mobile phase consisting of acetonitrile-water (30:70, v/v, 0.15% TCA) at a flow rate of 1.0 mL/min. The detection wavelength was set at 312 nm and the temperature of the column was kept at 25 °C. Ten milligrams of PAMAM-AB was extracted with 5 mL 30% KOH-methanol (1:1, v/v) mixture for 4 h under reflux and concentrated to 1 mL. An aliquot (100 μL) of the solution was measured into a glass tube with a teflonlined cap, followed by the addition of 20 μL HCl and 100 μL anhydrous alcohol. The mixture was vortexed for 30 s and centrifuged at 14 000 rpm for 10 min. Then 50 μL of the supernatant was injected for HPLC analysis of AB under the conditions as those described above for calculating the AB payload of PAMAM-AB conjugate.
Hydrolysis stability of PAMAM-AB in vitro
The hydrolysis of conjugates was studied at pH 5.0 PBS, pH 5.8 PBS and pH 7.4 PBS. All experiments were performed in triplicate along with controls. One milligram of PAMAM-AB was added into 2 mL pre-heated buffer solutions. All the solutions containing 0.5 mg/mL PAMAM-AB conjugate were stirred continuously and maintained at 37 °C. At appropriate time intervals, samples were withdrawn and the reaction was quenched by the addition of ethanol solution at −40 °C. The samples were stored at −80 °C until HPLC analysis. UV absorbance peak area of AB was used to derive a calibration and used to determine the concentrations of free AB in samples. Another experiment was studied in pooled human plasma diluted to 80% with pH 7.4 PBS (Kurtoglu et al., Citation2010). The conjugate was dissolved in 2 mL pre-heated plasma solutions at a concentration of 0.5 mg/mL. The solutions were continuously stirred and maintained at 37 °C. At appropriate time intervals samples were withdrawn and ethanol solution of voriconazole at −40 °C was added to deproteinize the plasma and quench the reaction. Voriconazole was used as the internal standard. Samples were then centrifuged for 10 min at 14 000 rpm and the clear supernatant was collected. Final samples were stored at −80 °C until HPLC analysis.
Lymphatic tracing study
Thirty KM mice were randomly divided into six groups. Each group contained five mice. Separately, PAMAM-AB with the concentration of 2 mg/kg, 5 mg/kg and 10 mg/kg (equivalent to the concentration of AB residues in PAMAM-AB), MB-S, MB-ME and MB-MME with the concentration of 10 mg/kg of body weight were injected subcutaneously into the footpad of the right hindpaw. MB-S, MB-ME and MB-MME were prepared according to our previous study (Wang et al., Citation2009). After 10 min of administration, the mice were sacrificed. Right popliteral lymph nodes (PLNs), iliac lymph nodes (ILNs) and para-aortic lymph nodes (PALNs) were harvested immediately. LNs were visualized and were examined stereo microscopically to determine blue-stained intensity of these nodes with four formulations.
Lymphatic uptake and drainage
KM mice were used for lymphatic uptake and drainage studies. Four formulations, MB-S, MB-ME, MB-MME and PAMAM-AB, were selected for the study and were administered subcutaneously to the footpad of the right hindpaw of the mice at the dose of 10 mg/kg, respectively. Time taken for administration was 30 s. Blood samples were drawn by retro-orbital venous plexus puncture at 5 min, 10 min, 30 min, 1 h, 2 h, 4 h, 8 h and 12 h post-s.c. dose. The samples were put into heparinized micro-centrifuge tubes and followed by centrifuging at approximately 5000 rpm for 10 min, and serum was collected for analysis. After blood samples were got, the mice were sacrificed. Separately, right PLNs, ILNs, PALNs and right hindpaws of mice were harvested immediately. Tissue samples were rinsed with saline solution, blotted-dry with filter paper and weighed for analyzing the drug concentration. An aliquot (100 μL) of plasma sample, lymph nodes and hindpaws homogenates was put into an Eppendorf tube followed by the addition of 80 μL perchloric acid (10%) and 10 μL aminobenzoic acid (PABA) solution (33 μg/mL) as the internal standard. The mixture was vortexed for 2 min and centrifuged at 14 000 rpm for 10 min. PAMAM-AB extracted of supernatants was detected by HPLC as mentioned in above methods. Non-compartmental PK parameters were carried out by DAS 2.1 software (Mathematical Pharmacology Professional Committee of China, Shanghai, China). The fraction of the dose that was recovered in the lymph node, injection site, systemic plasma at pre-determined times was calculated by recovering the amount of drug divided by administration dose (% dose) (Ye et al., Citation2014).
Tissue distribution of PAMAM-AB
KM mice were injected subcutaneously at PAMAM-AB doses of 10 mg/kg to the footpad of the right hindpaw. Time taken for administration was 30 s. At each time point (10 min, 30 min, 1 h, 2 h, 4 h, 8 h and 12 h post-s.c. dose), blood samples were drawn, then the mice were sacrificed. The right PLN, ILN, PALN, right hindpaw, heart, liver, spleen, lung, kidney and brain were excised, then washed in normal saline and blotted dry with filter papers. Tissue homogenates were got, and were prepared as the method described above for PAMAM-AB analysis. Separately, the recovery, cumulative recovery and targeting efficiency (te) were calculated.
Results and discussion
Synthesis and characterization of PAMAM-AB conjugates
In recent years, there has been an explosion in the use of dendrimer-based nanocarriers for drug delivery. Conventionally, drugs were attached directly via linkers to dendrimer terminal groups and, in some instances, in combination with targeting moieties. PAMAM-G3.5-COOH with 64 terminal groups was selected due to the stable, non-immunogenic, non-toxic (generations 1–4) characteristics and the closed three-dimensional porous structure (low generation PAMAM was open structure) (Menjoge et al., Citation2010). In addition, high-generation PAMAM with large molecular weight might bring strong steric effect in the process of synthesis. In this study, amide-linked AB conjugates of G3.5-COOH dendrimer were prepared by bonding the carboxyl ending groups of PAMAM and amino groups of AB by a DCC coupling reaction. The reaction went on at room temperature, and the excess AB and the reaction product n,n′-dicyclohexyl urea (DCU) were removed by filtration due to water-insoluble characteristics, however, DMAP was removed by dialysis for further purification. The water-soluble, dark-blue PAMAM-AB was obtained, which could be redissolved in the water for s.c. injection and streamed along with the lymph flow to blue stain draining lymph nodes.
With the attachment of AB to the dendrimer, PAMAM-AB ligand is formed. Agilent 8453 UV-Vis spectrometer was used to estimate PAMAM, AB and PAMAM-AB. The UV spectra of generation 3.5 dendrimer, AB and PAMAM-AB is presented in . AB in alcohol solution gave the maximum absorbance in UV region at λmax = 600 nm, whereas PAMAM gave no absorbance at this wavelength. The UV peak characteristic of AB residues in PAMAM-AB dendrimer ligands, as demonstrated in , was present at 598 nm, a slight shift from the peak of 600 nm for free AB. The visible distinguishing peak for AB is dependent on the conjugation of each molecule to the dendrimer, demonstrating the successful synthesis of PAMAM-AB.
Figure 2. Characterization of PAMAM-AB. (A) UV-Vis spectrum of PAMAM, AB and PAMAM-AB; (B) FT-IR spectra of PAMAM and PAMAM-AB; (C) 1H-NMR spectra of PAMAM and PAMAM-AB; (D) RP-HPLC chromatogram of PAMAM-AB conjugate solution at 289 nm; (E) RP-HPLC chromatogram of AB solution at 312 nm.
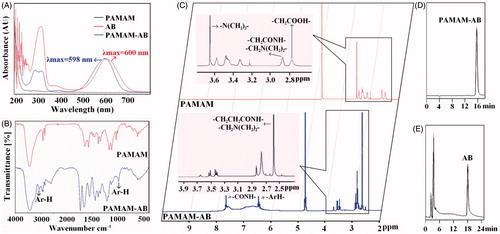
The FT-IR spectra obtained for PAMAM and PAMAM-AB is shown in . The spectrum of PAMAM showed a broad, strong O–H and N–H stretch band at 3446.3 cm−1, which indicated that numerous –OH and –NH- groups were present in PAMAM, a –CH2– stretch band at 2919.2 cm−1, and a –CH– stretch band at 2850.9 cm−1. These three bands were characteristic absorption of –OH–, –NH–, –CH3 and –CH2– groups in the structure of PAMAM. In the spectrum of PAMAM-AB, the intensity of the band at 3446.3 increased, which could be attributed to 14 amide groups in the structure of AB. Typical features of PAMAM-AB compared with PAMAM showed two new peaks of the characteristic peak position: an Ar–H stretch band at 3071.7 cm−1, and an Ar–H bending band at 987.6 cm−1, demonstrating the successful synthesis of PAMAM-AB.
The 1H-NMR spectra of PAMAM and PAMAM-AB is shown in . The solvent peak of D2O was found at 4.70 ppm. The 1H-NMR spectra of polymers was like as following: 1H-NMR (600 MHz, D2O) PAMAM: δ 2.77 (–CH2COOH of PAMAM, 120H), δ 2.87 (–CH2CONH– and –CH2N (CH2)2– of PAMAM unit, 120H), δ 3.64 (–N (CH2)2– of PAMAM, 240H). PAMAM-AB: δ 2.58 (–CH2CH2CONH– and –CH2N (CH2)2– of PAMAM unit, 120H), δ 6.4–7.3 (–ArH– of AB unit, 26H), δ 7.5–7.6 (–CONH– of PAMAM unit, 60H). The number of AB residues attached to PAMAM was calculated from 1H–NMR data. The degree of branching within the polymer structure was analyzed using the following equation:
Approximately seven molecules of AB were coupled to a single PAMAM dendrimer that contained 64 surface primary carboxyl groups (27.16% by weight).
The conjugate was also characterized by RP-HPLC. The retention time of PAMAM-AB conjugate was 15.6 min () with the mobile phase of acetonitrile–water (8:92, v/v, 0.15% TCA) at 289 nm, whereas PAMAM have no absorbance at this wavelength. AB could not be eluted at this HPLC condition within 30 min. However, AB could be separated when the acetonitrile percentage increased to 30% (0.15% TCA) at 312 nm, and the retention time was approximately 18.4 min (). These distinct peaks were used to confirm that the conjugation reaction was successful. The calculated AB payload of PAMAM-AB conjugate was 6.76 per dendrimer molecule (26.48% by weight), which was in agreement with NMR results.
Hydrolysis stability of PAMAM-AB in vitro
Understanding drug release characteristics of amide bonds is a key step in designing dendrimer conjugates with high efficacy. In order to investigate the hydrolysis stability, the drug hydrolytic rate of PAMAM-AB was studied. As is known that cancer thrives in an acidic environment and cannot survive in an alkaline environment. Therefore, intracellular pH in cancer cell was weakly acidic. It is for this reason that pH 5.0, pH 5.8 and pH 7.4 PBS were chosen as the medium. Results indicated that PAMAM-AB conjugates with amide bonds were quite stable against hydrolytic cleavage for the 7-day time period studied at pH 5.0, pH 5.8 and pH 7.4 PBS, and no free AB was detected in reaction solutions. In plasma, only 0.55% of AB was released from PAMAM-AB for 5 days, and increased to 1.28% for 7 days.
Lymphatic tracing study
PLNs, ILNs and PALNs obtained after PAMAM-AB s.c. administration at 10 min are shown in . It can be seen that PLNs and ILNs can be blue stained at the dosage of 2 mg/kg. But compared with PLNs, ILNs were light blue-colored. And no colored PALNs could be observed. When the dose of PAMAM-AB was 5 mg/kg, blue-colored PLNs and ILNs could be observed. But PALNs could only be partially blue stained or lymph sinus blue-stained. Thus, only when the dose reached 10 mg/kg, PLNs, ILNs and PALNs could be all obviously blue-stained.
Figure 3. (A) Animal model for lymphatic tracing and PLNs, ILNs and PALNs obtained after s.c. administration at 10 min post-dose of PAMAM-AB; (B) PLNs, ILNs and PALNs obtained after 10 mg/kg s.c. administration at 10 min post-dose of MB-S, MB-ME and MB-MME (n = 5).
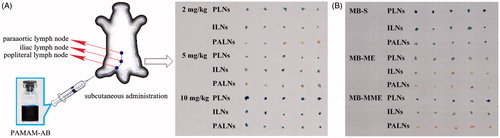
As can be seen in , PLNs, ILNs and PALNs were all blue stained at 10 min after MB-S dosing, and the blue-stained intensity of LNs was in descending order of PLNs, ILNs and PALNs. With MB-ME administration, only PLNs were partially blue colored, whereas no blue-colored ILNs and PALNs were observed. However, blue-stained PLNs and ILNs were got after MB-MME s.c. injection, and no blue-colored PALNs were obtained. Results can be concluded that PAMAM-AB showed best lymphatic tracing ability at the dose of 10 mg/kg compared with MB-S, MB-ME and MB-MME.
Study on drug concentration in plasma
In recent years, MB-S was widely used in SLNB. MB-ME and MB-MME prepared in our previous study (Wang et al., Citation2009) demonstrated that microemulsion could enhance lymphatic uptake and drainage. However, due to the insoluble property of AB in majority of the solvents, it is difficult to construct nanoparticulate with high drug payload. Hence, MB-S, MB-ME and MB-MME were selected for the comparison with PAMAM-AB to investigate the intra-lymphatic targeting ability and prove the potential benefit of PAMAM-AB compared to formulations.
Concentration versus time curves obtained from mice treated with MB-S, MB-ME, MB-MME and PAMAM-AB are shown in . According to the data obtained from HPLC analysis shown in , MB and PAMAM-AB all could be quickly detected in plasma after MB-S and PAMAM-AB s.c. administration, respectively. A peak plasma level for MB of 2.133 µg/mL was reached immediately at 5 min and decreased to 1.452 µg/mL within 2 h; 12 h after injection, MB concentration in plasma decreased to 0.274 µg/mL. However, Cmax and Tmax of PAMAM-AB were 1.913 µg/mL and 10 min, respectively; and PAMAM-AB concentration quickly decreased to 0.229 µg/mL within 2 h. The area under the curve (AUC) is considered as an important determinant of the therapeutic effect of drugs. AUC(0–12h) of MB-S group (10.066 mg/L h) was significantly higher (p < 0.01) than PAMAM-AB (2.555 mg/L h). The plasma concentration of PAMAM-AB rapidly decreased with a half-life of 1.370 h in the PAMAM-AB group. Whereas t1/2 of MB in the MB-S group was 4.338 h, which significantly (p < 0.01) prolonged MB plasma exposure than PAMAM-AB. The cumulative recovery in also showed that PAMAM-AB after s.c. administration less entered the blood circulation than MB in the MB-S group.
Figure 4. Drug concentration in (A) plasma; (C) PLNs; (E) ILNs; (G) PALNs; (I) injection site and (K) other tissues; cumulative recovery % of total dosed PAMAM-AB recovered in (B) plasma; (D) PLNs; (F) ILNs; (H) PALNs and (L) other tissues; remaining % of total dosed in (J) injection site following s.c. dosing of 10 mg/kg (n = 5).
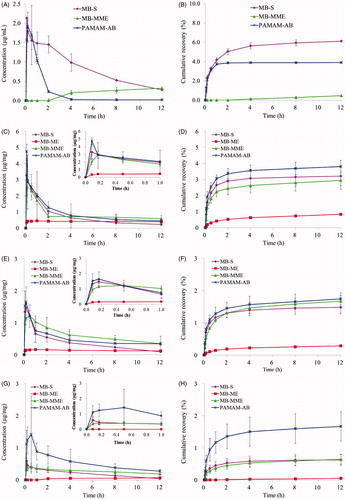
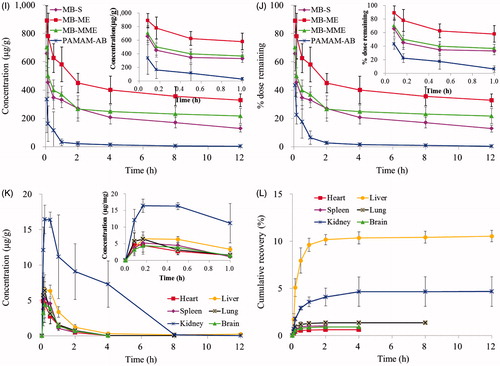
However, for MB-MME administration, plasma levels could be examined after 4 h post-s.c. dosing with a concentration less than 0.4 µg/mL. After MB-ME treatment, no drug was detected in plasma within 12 h. As is known that the gap between blood capillaries was 30–50 nm, and the lymphatic wall was made of monolayer endothelial cells, imbricated-arranged and loosely connected, and the gap was 500 nm, which could reach 5 μm when pathological changes appeared. MB-ME and MB-MME therefore could only penetrate lymphatic capillaries but not the blood capillary owing to the larger particle size (74.11 and 100.7 nm). Then it was readily absorbed into draining lymph and streamed along with the lymph flow to systematic blood circulation. Consequently, no MB was detectable for MB-ME and MB-MME administration in initial time points. With time increasing, particles in the lymphatic system were reabsorbed into blood circulation. Thus, plasma levels could be detected in the MB-MME group after 4 h post-s.c. dosing.
Lymphatic uptake and retention
LNs distributions of MB-S, MB-ME, MB-MME and PAMAM-AB were measured in PLNs, ILNs and PALNs. And the non-compartmental pharmacokinetic parameters are shown in . As is shown in , MB-S and PAMAM-AB were quickly absorbed into draining lymph for lymphatic tracing, and peak concentration levels were both reached immediately at 5 min, with Cmax of 3.279 and 4.758 µg/mg, respectively. After 5 min post-dosing, the concentration of MB-S in PLNs decreased more rapidly than that of PAMAM-AB; 12 h after administration, the concentration of PAMAM-AB was about 2-fold higher than that of MB-S. For the administration of MB-ME, it was slowly absorbed into lymphatic vessels and resided in lymph nodes. The concentration of MB in PLNs increased with time, reaching the maximum at 1 h, and then decreased slowly due to the high viscosity of the microemulsion (102.75 mPa S). However, concentration level in PLNs was too low compared to effectively blue stain draining LNs, indicating MB-ME unsuitable for lymphatic drug delivery. For MB-MME administration, the maximum concentration was observed at 10 min post-dosing, with Cmax of 2.961 µg/mg. After that, concentration levels in PLNs decreased with time; 12 h after injection, MB concentration in PLNs decreased to 0.591 µg/mg, which was higher than concentrations in MB-S group (2.504-fold), MB-ME group (1.496-fold) and PAMAM-AB group (1.302-fold). AUC(0–12h) of PAMAM-AB group was higher than MB-S, MB-ME and MB-MME group in PLNs (1.270-, 2.174- and 1.067-fold). The cumulative recovery in PLNs following s.c. administration is shown in , presumably reflecting LNs uptake rate (Ye et al., Citation2014). The cumulative recovery at 12 h time point was in descending order of PAMAM-AB, MB-S, MB-MME and MB-ME. PAMAM-AB increased (1.187-, 4.579- and 1.296-fold) recovery (3.814%) when compared to MB-S group, MB-ME group and MB-MME group (3.212, 0.833 and 2.944%). Recovery of PAMAM-AB was much higher than that of other formulations, indicating more prominent lymph node retention.
Table 1. Non-compartmental pharmacokinetic parameters for PLNs, ILNs, PALNs and IS after MB-S, MB-ME, MB-MME and PAMAM-AB s.c. administration at a dose of 10 mg/kg (n = 5).
Similar to profiles in , curves of concentration versus time in ILNs are shown in . After a s.c. injection of MB-S and PAMAM-AB, all peak concentrations reached at 10 min and then decreased. However, Tmax of MB-ME and MB-MME group were 30 min and 1 h, respectively. AUC(0–12h) of four formulations was in the order of: MB-MME > PAMAM-AB > MB-S > MB-ME. For ILNs, MRT of four formulations was in descending order of MB-ME, ME-MME, PAMAM-AB and MB-S. Though Cmax of MB-MME group was lower than that of PAMAM-AB group, larger particle size and viscosity lead to slow removal from ILNs to PALNs, resulting in the largest AUC(0–12h) of MB-MME. For MB-ME administration, MB levels in ILNs were detected and much lower than that in PLNs at any time point. Tmax of 1 h and Cmax of 0.167 µg/mg were noted for MB in MB-ME, which suggested poor lymphatic uptake and transport of MB-ME compared with other formulations. The cumulative recovery in ILNs for 12 h was in the order of PAMAM-AB > MB-MME > MB-S > MB-ME (). PAMAM-AB increased (1.176-, 6.049- and 1.042-fold) recovery (1.742%) when compared to MB-S group, MB-ME group and MB-MME group (1.481, 0.288 and 1.671%).
Profiles in PALNs () differed significantly from that in PLNs and ILNs. Concentrations in PALNs were much lower than that in PLNs and ILNs. With MB-S administration, a peak concentration level in PALNs of 0.589 µg/mg was observed and rapidly decreased to 0.042 µg/mg within 12 h. When treated with MB-ME, MB was undetectable in PALNs initially (1 h), and MB concentration increased at later time points. But the concentration increased slowly from 0.044 to 0.071 µg/mg. MB-MME, with a slow uptake and slight elimination, concentrations ranged from 0.188 to 0.397 µg/mg. However, in PALNs, PAMAM-AB still maintained a higher level of 1.115 µg/mg at 5 min after administration, and increased to 1.420 µg/mg at 30 min. After that, PAMAM-AB levels decreased, reaching 0.277 µg/mg at 12 h post-dosing. PAMAM-AB increased AUC(0–12h) (2.784-fold and 1.981-fold) and Cmax (2.411-fold and 3.576-fold) when compared to MB-S and MB-MME in PALNs. In addition, concentrations of PAMAM-AB at any time point were significantly higher (p < 0.05) than that of other formulations. The cumulative recovery in PALNs was in descending order of PAMAM-AB, MB-MME, MB-S and MB-ME (). The cumulative recovery of PAMAM-AB was 2-fold higher than that of other three formulations (p < 0.05).
With the treatment of MB-S, MB-ME, MB-MME and PAMAM-AB, blue-stained LNs were visualized. PLNs were stained by MB-S, MB-MME and PAMAM-AB immediately at 5 min, whereas PLNs could only be blue colored at 1 h after MB-ME injection. In addition, blue-stained PLNs were observed at all-time points after MB-MME and PAMAM-AB administration, whereas PLNs were not blue-colored after 8 h for MB-S dosing. For ILNs, blue-stained state was maintained for 2 h, 8 h and 4 h after MB-S, MB-MME and PAMAM-AB administration, respectively. No blue ILNs were obtained within 12 h in the MB-ME group. As for PALNs, blue-colored LNs were seen after PAMAM-AB administration for 4 h, and MB-S treatment for 10 min, respectively. Conclusions could be drawn that only when concentrations reached 0.453 µg/mg, can blue-colored lymph nodes be observed.
The substances injected interstitially must traverse the interstitium, which was the first obstacle of the intra-lymphatic drug delivery system administered interstitially. The lymphatic targeting drug carrier should have good lymphatic drainage that could traverse from the interstitial space to lymphatics. In the in vivo lymphatic uptake study, PAMAM-AB was found to be superior to other three formulations. This result could be explained as follows. MB-S was rapidly absorbed into lymphatics post-dosing, which eliminates from LNs more rapidly due to the solution state. Consequently, MB-S could only maintain the blue-stained state in LNs for a short period. For MB-ME, with the viscosity of 102.75 mPa S (Wang et al., Citation2009), it exhibited a poor fluidity, leading to a slow removal in lymph. Thus, Tmax, Cmax and AUC(0–12h) value of MB-ME in LNs were smaller than other formulations. The outer phase of MB-MME was water, which was compatible with lymphatics and can be easily absorbed. Thus, Tmax, Cmax and AUC(0–12h) value of MB-MME in LNs were larger than MB-ME. PAMAM-AB is a macromolecular solution, with many hydrophilic groups on the surface and good fluidity, leading to faster lymphatic uptake speed, larger uptake amount, and longer LNs residence time.
lymphatic drainage from the injection site
As is shown in and , AUC(0–12h) of PAMAM-AB (234.170 mg/kg h) in the injection site (IS) was lower than MB-S, MB-ME and MB-MME. Shorter MRT also implied faster drainage from the IS than other formulations. Injection site remaining (% dose) of four administration groups is shown in . Only 10.85% of MB-ME was cleared from IS within 5 min. MB-S, MB-MME and PAMAM-AB eliminated from IS faster than MB-ME did, and more than 50% of MB-S, MB-MME and PAMAM-AB was cleared at 10 min post-dosing. Majorities of formulations were removed within 4 h, and at 4 h after administration, nevertheless, about 20.76% of MB-S, 40.12% of MB-ME, 24.87% of MB-MME and 1.42% of PAMAM-AB remained at IS, respectively. The drainage from IS was in descending order of PAMAM-AB, MB-S, MB-MME and MB-ME. PAMAM-AB group had the least retention at IS at 12 h post-dosing, possibly as a result of electrostatic interactions with the surrounding tissues. The interstitial space consisted of mucopolysaccharides with low isoelectric points resulting in a negative charge at physiological pH, and PAMAM-AB also negatively charged. Consequently, electrostatic interactions between the interstitial space and PAMAM-AB made PAMAM-AB the most drainage from the IS.
Tissue distribution
After a s.c. administration of PAMAM-AB, PAMAM-AB was absorbed by blood vessels and lymphatics, then distributed rapidly and peak PAMAM-AB levels were reached within 10 min for all tissues investigated (). The highest PAMAM-AB concentrations were found in the kidney, followed by the liver. After 10 min of PAMAM-AB treatment, the concentration in the kidney (16.433 µg/g) was 2.5-fold higher than that in the liver (6.542 µg/g), and at later time points, PAMAM-AB concentrations in the kidney were consistently three times higher than that in the liver. The lowest PAMAM-AB concentrations were found in the heart (4.501 µg/g at 10 min) and brain (4.419 µg/g at 10 min). Majorities of PAMAM-AB were removed within 2 h post-dosing, and concentration levels were undetected after 2 h, 4 h, 4 h and 8 h in spleen, brain, heart and lung, respectively. In addition, PAMAM-AB was detected in brain, indicate that PAMAM-AB could cross the blood brain barrier (BBB), possibly as a result of surface modification with AB, making PAMAM possess an appropriate diameter and solubility to cross BBB (Patel et al., Citation2007; Ke et al., Citation2009). The cumulative recovery in tissues for 12 h was in the order of liver > kidney > lung > spleen > brain > heart ().
Recovery of PAMAM-AB in different tissues is shown in . Results showed that most of PAMAM-AB resided at IS after a s.c. injection, and the rest of drug disposed in plasma, PLNs, ILNs, PALNs and other tissues. Concentration levels were much higher in IS than that in other tissues at any time point. The te value of PAMAM-AB in tissues and plasma after s.c. administration is displayed in . It could be seen that te of PAMAM-AB in tissues was in descending order of PLNs, PALNs, ILNs, kidney, liver, lung, brain, heart, spleen and plasma. The highest level was found in PLNs, followed by PALNs and ILNs, which explained that PAMAM-AB had special affinity to lymphatics. The te value in the kidney which was 21.86 showed that kidney might be the primary excretion organ of PAMAM-AB. Results indicated that PAMAM-AB showed a higher distribution to LNs than other tissues (p < 0.01).
Figure 5. Recovery of PAMAM-AB in plasma, PLNs, ILNs, PALNs, IS, heart, liver, spleen, lung, brain and kidney after PAMAM-AB s.c. administration at the dose of 10 mg/kg (n = 5).
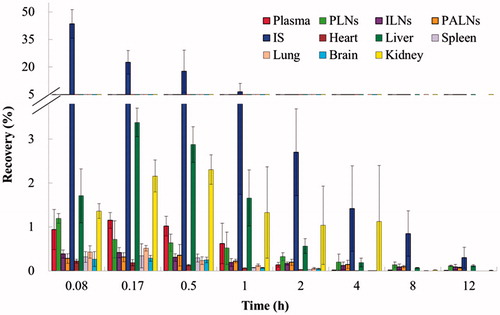
Table 2. The te value of plasma and various tissues of mice after PAMAM-AB s.c. dosing at a dose of 10 mg/kg (n = 5).
Conclusions
In this current study, we report for the first time, a novel lymphatic tracer, PAMAM-AB, was successfully synthesized through amide bonds to conjugate PAMAM and AB. Characteristic peaks of UV-Vis, NMR, FT-IR and HPLC demonstrated the successful synthesis of water-soluble PAMAM-AB, and showed that approximately seven molecules of AB were coupled to a single PAMAM dendrimer that contained 64 surface primary carboxyl groups. With suitable stability, PAMAM-AB showed best lymphatic tracing ability at the dose of 10 mg/kg compared with MB-S, MB-ME and MB-MME, which could obviously blue-stained draining lymph nodes within 10 min. Less retention at the injection site and higher PAMAM-AB concentration in lymph nodes showed that PAMAM-AB promoted both drainage from the IS and uptake into the lymph, and indicated that PAMAM-AB possesses the double function of lymphatic tracing and lymphatic targeting. PAMAM-AB therefore provides an attractive platform for the development of lymphatic targeting vectors or as a lymphatic tracer in its own right.
Declaration of interest
The authors report no declarations of interest.
We wish to acknowledge the support of Pharmacy Laboratory Centre and Animal Centre of Shenyang Pharmaceutical University. This work was supported by the Liaoning Province Natural Science Fund Project (No. 2013020187).
References
- Alex JC, Weaver DL, Fairbank JT, et al. (1993). Gamma-probe-guided lymph node localization in malignant melanoma. Surg Oncol 2:303–8
- Barrett T, Choyke PL, Kobayashi H. (2006). Imaging of the lymphatic system: new horizons. Contrast Media Mol I 1:230–45
- Buhleier E, Wehner W, Vogtle F. (1978). Cascade- and nonskid-chain-like syntheses of molecular cavity topologies. Synthesis 2:155–8
- Chen H, Banaszak Holl M, Orr BG, et al. (2003). Interaction of dendrimers (artificial proteins) with biological hydroxyapatite crystals. J Dent Res 82:443–8
- Choi SH, Moon WK, Hong JH, et al. (2007). Lymph node metastasis: ultra small superparamagnetic iron oxide enhanced MR imaging versus PET/CT in a rabbit model. Radiology 242:137–43
- Clement O, Luciani A. (2004). Imaging the lymphatic system: possibilities and clinical applications. Eur Radiol 14:1498–507
- Dowlatshahi K, Fan M, Snider HC, Habib FA. (1997). Lymph node micrometastases from breast carcinoma: reviewing the dilemma. Cancer 80:1188–97
- Fisher B, Bauer M, Wickerham DL, et al. (1983). Relation of number of positive axillary nodes to the prognosis of patients with primary breast cancer. Cancer 52:1551–7
- Giuliano AE, Kirgan DM, Guenther JM. (1994). Lymphatic mapping and sentinel lymphadenectomy for breast cancer. Ann Surg 220:391–8
- Ke W, Shao K, Huang R, et al. (2009). Gene delivery targeted to the brain using an Angiopep-conjugated polyethyleneglycol-modified polyamidoamine dendrimer. Biomaterials 30:6976–85
- Khalil HH, Elaffandi AH, Afifi A, et al. (2008). Sentinel Lymph Node Biopsy (SLNB) in management of N0 stage T1–T2 lip cancer as a “Same Day” procedure. Oral Oncol 44:608–12
- Kobayashi H, Kawamoto S, Bernardo M, et al. (2006). Delivery of gadolinium-labeled nanoparticles to the sentinel lymph node: comparison of the sentinel node visualization and estimations of intranodal gadolinium concentration by the magnetic resonance imaging. J Control Release 111:343–51
- Kobayashi H, Kawamoto S, Sakai Y, et al. (2004). Lymphatic drainage imaging of breast cancer in mice by micro-magnetic resonance lymphangiography using a nanosize paramagnetic contrast agent. J Natl Cancer Inst 96:703–8
- Kobayashi H, Koyama Y, Barrett T, et al. (2007). Multimodal nanoprobes for radionuclide and fivecolor near-infrared optical lymphatic imaging. ACS Nano 1:258–64
- Kobayashi H, Sato N, Hiraga A, et al. (2001). 3D-micro-MR angiography of mice using macromolecular MR contrast agents with polyamidoamine dendrimer core with reference to their pharmacokinetic properties. Magn Reson Med 45:454–60
- Koller M, Barsuk D, Zipple D, et al. (1998). Sentinel lymph node involvement – a predictor for axillary node status with breast cancer – Has the time come? Eur J Surg Oncol 24:166–8
- Kurtoglu YE, Mishra MK, Kannan S, Kannan RM. (2010). Drug release characteristics of PAMAM dendrimer–drug conjugates with different linkers. Int J Pharmaceut 384:189–94
- Lei XG, Jockusch S, Turro NJ, et al. (2008). EPR characterization of gadolinium (III)-containing-PAMAM-dendrimers in the absence and in the presence of paramagnetic probes. J Colloid Interface Sci 322:457–64
- Lim J, Chouai A, Lo ST, et al. (2009). Design, synthesis, characterization, and biological evaluation of triazine dendrimers bearing paclitaxel using ester and ester/disulfide linkages. Bioconjug Chem 20:2154–61
- Liu Q, Zuo WS, Wang YS, et al. (2000). The study of sentinel lymph nodes biopsy in breast cancer. J Qilu Oncol 7:217–53
- Lohrmann C, Foeldi E, Langer M. (2009). MR imaging of the lymphatic system in patients with lipedema and lipo-lymphedema. Microvasc Res 77:335–9
- Luciani A, Itti E, Rahmouni A, et al. (2006). Lymph node imaging: basic principles. Eur J Radiol 58:338–44
- Menjoge AR, Kannan RM, Tomalia DA. (2010). Dendrimer-based drug and imaging conjugates: design considerations for nanomedical applications. Drug Discov Today 15:171–85
- Misselwitz B. (2006). MR contrast agents in lymph node imaging. Eur J Radiol 58:375–82
- Morton DL, Wen DR, Wong JH, et al. (1992). Technical details of intraoperative lymphatic mapping for early stage melanoma. Arch Surg 127:392–9
- Mounzer R, Shakarin P, Papademetris X, et al. (2007). Dynamic imaging of lymphatic vessels and lymph nodes using a bimodal nanoparticulate contrast agent. Lymphat Res Biol 5:151–8
- Noguchi M, Tsugawa K, Bando E. (1999). Sentinel lymphadenectomy in breast cancer: identification of sentinel lymph node and detection of metastases. Breast Cancer Res Tr 53:97–104
- Patel DA, Henry JE, Good TA. (2007). Attenuation of beta-amyloid-induced toxicity by sialic-acid-conjugated dendrimers: role of sialic acid attachment. Brain Res 1161:95–105
- Ratnesh J, Dandekara P, Patravale V. (2009). Diagnostic nanocarriers for sentinel lymph node imaging. J Control Release 138:90–102
- Reitsamer R, Peintinger F, Prokop E, et al. (2003). Sentinel lymph node biopsy alone without axillary lymph node dissection – follow up of sentinel lymph node negative breast cancer patients. Eur J Surg Oncol 29:221–3
- Satish KN, Padmaja G, Majeti BK, et al. (2011). Advances in lymphatic imaging and drug delivery. Adv Drug Deliv Rev 63:876–85
- Tam JP, Spetzler JC. (2001). Synthesis and application of peptide dendrimers as protein mimetics. Curr Protoc Protein Sci 18:15
- Tomalia DA, Baker H, Dewald JR, et al. (1985). A new class of polymers: starburst-dendritic macromolecules. Polym J 17:117–32
- Tomalia DA, Reyna LA, Svenson S. (2007). Dendrimers as multi-purpose nanodevices for oncology drug delivery and diagnostic imaging. Biochem Soc Trans 3:61–7
- Wang SJ, Yang R, Yao HM, et al. (2009). In vivo lymphatic targeting of methylene blue with microemulsion and multiple microemulsion. Drug Deliv 16:371–7
- Yang H, Lopina ST. (2007). Stealth dendrimers for antiarrhythmic quinidine delivery. J Mater Sci-Mater M 18:2061–5
- Ye TT, Zhang WJ, Sun MS, et al. (2014). Study on intralymphatic-targeted hyaluronic acid-modified nanoliposome: influence of formulation factors on the lymphatic targeting. Int J Pharmaceut 471:245–57