
Abstract
Context: Gliclazide (G) is a commonly prescribed drug for Type 2 diabetes (T2D). In a recent study, we found that when G was combined with a primary bile acid, and gavaged to an animal model of Type 1 diabetes (T1D), it exerted a hypoglycemic effect. We hypothesized this to be due to metabolic activation of the primary bile acid into a secondary or a tertiary bile acid, which enhanced G solubility and absorption. The tertiary bile acid, taurocholic acid (TCA), has shown strong permeation-enhancing effects in vivo. Thus, we aimed to design, characterize, and test microcapsules incorporating G and TCA in an animal model of T1D.
Methods: Microcapsules were prepared using the polymer sodium alginate (SA). G-SA microcapsules (control) and G–TCA–SA microcapsules (test) were extensively examined (in-vitro) at different pH and temperatures. The microcapsules were gavaged to diabetic rats, and blood glucose and G concentrations in serum were examined. Ex-vivo studies were also performed using a muscle cell line (C2C12), and cell viability and glucose intake post-treatment were examined.
Results: G–TCA–SA microcapsules showed good stability, uniformity, and thermal and chemical excipient compatibilities. TCA did not change the size or the shape of the microcapsules, but it enhanced their mechanical resistance and reduced their swelling properties. G–TCA–SA enhanced the viability of C2C12 cells over 24 hours, and exerted a hypoglycemic effect in alloxan-induced type-1 diabetic rats.
Conclusions: The incorporation of TCA into G-microcapsules resulted in functionally improved microcapsules with a positive effect on cell viability and glycemic control in Type-1 diabetic animals.
Introduction
Diabetes mellitus (DM) is one of the most commonly occurring endocrine disorders, affecting 6% of the world’s population (Adeghate et al., Citation2006), and is classified as Type 1 (T1D) and Type 2 (T2D) diabetes. T1D is an autoimmune disease characterized by significant inflammation and the destruction of pancreatic β-cells, with partial or complete cessation of insulin production and the inability of the body to control glycemia. T2D is a metabolic disorder caused by genetic and environmental factors, which result in an inadequate tissue response to insulin. T2D is often associated with obesity and hypertension (Weiss & Caprio, Citation2006), and may result in the eventual destruction of pancreatic β-cells, leading to the need to inject insulin, as is the case in T1D (Phillips, Citation2005). Both T1D and T2D show significant inflammation and the build-up of oxidants and radicals, which worsen diabetes inflammation, complications, and long-term prognosis (Lankin et al., Citation2004; Mathews et al., Citation2004).
Gliclazide (G) is an anti-diabetic drug commonly used in T2D. In addition to its ability to stimulate insulin release from the pancreas, G has shown beneficial extra-pancreatic effects such as anti-oxidant and anti-inflammatory properties, which are also desirable for T1D (Rakel et al., Citation2007). Recent studies in our laboratories have shown that, when incorporated with a primary bile acid, G exerted a moderate but significant hypoglycemic effect in a rat model of T1D (Al-Salami et al., Citation2012), which was hypothesized to be due to the bile acid optimizing the absorption of G in the lower part of the gastrointestinal tract (GIT) (Al-Salami et al., Citation2008b). In another study, we showed that the hypoglycemic effect of G in T1D rats may have been caused by metabolites or secondary or tertiary conformation of the co-administered bile acid (Al-Salami et al., Citation2008e). Accordingly, in this study we hypothesized that the incorporation of a tertiary bile acid with G for oral administration may result in more optimized delivery of G and better hypoglycemic effects. One such bile acid is taurocholic acid (TCA), which is naturally produced in humans. It has been shown that TCA enhances the absorption of heparin-docetaxel conjugates in the lower GIT, and thus, improves their efficacy (Lee et al., Citation2009; Khatun et al., Citation2013). Therefore, this study aimed to design and examine G–TCA microcapsules that target the lower GIT and measure its hypoglycemic effect on a rat model of TID. We also describe the in vitro and ex vivo effects of TCA on G–SA microcapsules in terms of morphology, size, shape, compatibility, drug contents, release patterns, and effect on cell viability (using the muscle cell line, C2C12) at different glucose concentrations.
Materials and methods
Materials
Gliclazide (99.92% pure) and TCA (96.0%) were purchased from Sigma Chemical Co (St. Louis, MO). Sodium alginate was purchased from Acros Organics (Morris Plains, NJ) and Calcium chloride anhydrous was purchased from Scharlab S.L (New South Wales, Australia). All the chemical reagents and solvents used were supplied by Merck (New South Wales, Australia) and were of analytical grade.
Drug preparation
Drug stock suspensions of G (2.5 mg/ml) and TCA (100.0 mg/ml) were prepared by mixing the powder with 10% ultra water-soluble gel (Australia). The 4.0% w/v calcium chloride stock solution was prepared by adding CaCl2 to deionized water. All the freshly prepared solutions were uniformly mixed for 8 hours at room temperature, and were refrigerated and used within 24 hours of their preparation.
Microcapsules production
The microencapsulation of G was performed as per our set protocols (Mooranian et al., Citation2014b). Sodium alginate (SA) and G with or without TCA were made up to a final concentration of G–TCA–SA in a ratio of 1:3:30, as described previously (Al-Salami et al., Citation2008b, Citation2009). For each mixture of microcapsules, three different batches of microcapsules were produced and analyzed in triplicate (n = 3).
Morphological characterization of microcapsules
The freshly prepared microcapsules were refrigerated when not in use, and used within 24 hours of preparation. Morphological analysis was undertaken using optical microscopy (OM), scanning electron microscopy (SEM) and energy dispersive X-ray spectrometry (EDS). The mean particle size diameter of the microcapsules was calculated using the software provided with the instrument.
A Nikon YS2-H mounted with Toup-Tek photonics (Tokyo, Japan) was used. Ten freshly prepared and dried microcapsules were selected randomly to determine the mean particle size using an optical microscope focused on top of a glass slide, and calibrated using a stage micrometer. A Zeiss Neon 40EsB FIBSEM (Cambridge, MA) was used in characterizing the surface morphology of the microcapsules calibrated at 0.8 nm resolutions. EDS (Oxford Instruments, INCA X-Act, Concord, MA) was used to interpret the elemental distribution of the atoms present in the microcapsules (Mooranian et al., Citation2014d).
Determination of viscosity, shear rate, torque, and shear stress
The viscosity measurements were performed at room temperature for the freshly prepared batches of G-SA and G–TCA–SA using the Visco-88 viscometer (Bohlin-Visco 88, Bohlin Instruments Inc., Brunswick, NJ). All the tests for the viscosity were carried out in triplicate (n = 3).
Thermal analysis
Differential scanning calorimetric (DSC) analysis was undertaken using a PerkinElmer DSC 8000 instrument (PerkinElmer Inc., Waltham, MA). A sample weight of 5 mg of G or its physical mixture was used along with the formulated microcapsules. Samples were placed in sealed aluminum pans and were heated at 30 °C/min at a flow rate of 30 ml/min under nitrogen.
Chemical stability studies
Fourier transform infrared (FT-IR) analysis was used to establish the functional group distribution. The spectral images of pure drug materials, their physical mixture, and the microcapsules were analyzed using the FTIR spectrometer-TWO (PerkinElmer Inc., Waltham, MA). A frequency range of 450–4000 cm−1 was used.
Drug content, production yield, and microencapsulation efficiency studies
Two grams of dried microcapsules were carefully weighed and dissolved in 200 ml of phosphate buffer. The suspension was stirred for 6 hours. Two milliliters of the mixture was transferred to a 100 ml volumetric flask and the volume was made with phosphate buffer. Various aliquots of the dissolution medium (2 ml volume) were withdrawn at predetermined time points (every 200 s) and filtered through a Millipore filter (0.22 mm) (Millipore Inc., Billerica, MA). The drug concentration was determined spectrophotometrically at 229 nm using an UV-spectrophotometer (Shimadzu UV-Vis Spectrophotometer 1240, Tokyo, Japan). The drug contents (Equation Equation1(1) ), production yield (Equation Equation2
(2) ), and microencapsulation efficiency (Equation Equation3
(3) ) were calculated as previously published (Barakat et al., Citation2013):
(1)
(2)
(3)
Stability studies
Predetermined amounts of freshly prepared G–SA and G–TCA–SA microcapsules were placed onto sterile petri dishes (20 microcapsules in each) and stored in thermostatically controlled ovens at −15, 5, 25, and 40 °C with relative humidity set at 35% for 3 days. The experiment was conducted using a stability chamber (Angelantoni Environmental and Climatic Test Chamber, Perugia, Italy). Microcapsules were visually examined for color, texture, and size.
Zeta-potential and pH dissolution studies
The Zeta potential was measured using a Zetasizer 3000HS (Malvern Instruments, Malvern, UK). All measurements were performed in triplicate (n = 3) at room temperature and results were expressed as average ± SD. The release studies were carried out using 2 g of G–SA and G–TCA–SA microcapsules, which were weighed and suspended in 40 ml of phosphate buffer solution at pH values of 1.5, 3.0, 6.0, and 7.8 for 6 hours (at two different temperatures of 25 °C and 37 °C) using a Perkin Elmer UV-Visible Spectrophotometer (PerkinElmer Inc., Waltham, MA). The dissolution medium was maintained at 200 rpm and at a flow rate of 30 ml/min. Analysis was carried out in triplicate (n = 3).
Swelling studies
One gram of dry microcapsules was placed in 100 ml of buffer of four pH values (1.5, 3.0, 6.0, and 7.8) and two temperatures (25 °C and 37 °C) for 48 hours. The wet weight of the microcapsules was determined by blotting them with a filter paper (Whatman #40) to remove the moisture, immediately followed by weighing on an electronic scale. The percentage of swelling of the microcapsules was calculated based on the final weight over the initial weight (Barakat et al., Citation2013).
Mechanical resistance studies
The microcapsules (G–SA and G–TCA–SA) were placed on a Boeco Multishaker PSU 20 (Boeco Company, Hamburg, Germany) as described elsewhere (Rokstad et al., Citation2014). At different time intervals, the number of damaged microcapsules was measured and data expressed as mean ± SD.
Diabetes induction and in vivo analysis
Thirty-two male Wistar rats (weight 250 ± 50 g) were maintained in an experimental animal facility with access to diet and water ad libitum. Temperature, humidity, and light were controlled to mimic a natural habitat. The rats were randomly divided into four equal groups of which three of the groups developed diabetes (type-1) by induction of the drug, alloxan (i.v.) at a dose of 30 mg/kg (Korec, Citation1980; Carvalho et al., Citation2003; Stetinova et al., Citation2007; Al-Salami et al., Citation2012). Two to three days after the administration of alloxan, rats that showed blood glucose levels of >18 mmol/L and showed the signs and symptoms of diabetes were considered diabetic (Alam & Rahman, Citation1971; Al-Salami et al., Citation2009). All the diabetic rats showed signs and symptoms of polydipsia, polyuria, weight loss, and asthenia (Carvalho et al., Citation2003; Al-Salami et al., Citation2008a). The experiments were approved by the Animal Ethics Committee at Curtin University and all experiments were performed according to the Australian Code of Practice for the care and use of animals for scientific purposes.
Experimental protocol
The study design of the animal work () shows the four groups. One group was considered healthy and the other three groups were considered diabetic following alloxan administration (30 mg/kg) by intravenous injection (tail vein). Once diabetes was confirmed, the treatment commenced (on day 3.5) by administering the microcapsules orally (Xu et al., Citation2013), with blood collection at various time points over a period of 10 hours.
Figure 1. Study design of animal work.
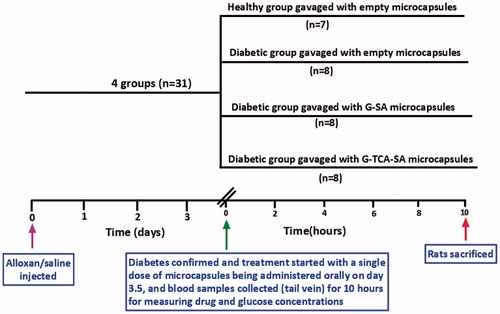
G–SA and G–TCA–SA microcapsules were administered (G as 20 mg/kg, and G:TCA as 20 mg/kg and 4 mg/kg) by gavage as a single dose after diabetes confirmation. Of the diabetic groups (2, 3, and 4), group 2 was gavaged with empty microcapsules, group 3 was gavaged with G-SA microcapsules, and group 4 was gavaged with G-TCA-SA microcapsules. Blood samples (0.05 mL) were collected from the tail vein at 0, 30, 60, 120, 180, 360, and 600 minutes post-dose. Blood glucose levels were measured using an ACCU-CHEK Glucose Advantage Meter (Roche, Munich, Germany). Serum was separated by centrifugation at 15 000 rpm for 15 minutes and stored at −20 °C prior to gliclazide analysis, which was carried out within 24 hours of collection.
High-performance liquid chromatography analysis
Gliclazide concentrations in the serum were measured by HPLC as previously reported (Al-Salami et al., Citation2008d; Mikov et al., Citation2008). Acetonitrile was added to serum in a 2:1 ratio and, after vortexing for 10 seconds and centrifuging (15 000 rpm for 15 minutes), the supernatant (20 µl) was injected into the HPLC system, which consisted of an Agilent auto injector, a C18 guard column (4x2.0 mm, Agilent, Roseville, CA), a C18 analytical column, and an Agilent detector set at 229 nm. The mobile phase was acetonitrile 49% and phosphate buffer 51%, pH 2.7 (adjusted using ortho-phosphoric acid) at a flow rate of 0.8 ml/min. Under these conditions, the retention time for gliclazide was 7.5 min.
Cell viability and glucose uptake assay
C2C12 cells (mouse-cloned muscle cell line) were purchased from the American Type Culture Collection of cell cultures (USA/Australia). Cells were cultured in RPMI (Roswell Park Memorial Institute medium, Roswell Park Memorial Institute, Buffalo, NY)-1640 (Gibco Life Technologies, Waltham, MA) with additional supplements consisting of 5.5 mM of glucose (Sigma Chemical Co., St. Louis, MO), 10% fetal bovine serum, and 5% penicillin–streptomycin solution (Thermo Fischer Scientific, Adelaide, Australia). Cells were stored in incubator and maintained in a humidified atmosphere of 5% CO2, 95% O2 at 37 °C. The effect of G–SA and G–TCA–SA microcapsules on the cell viability was measured by performing an MTT (3-(4, 5-dimethylthiazol-2-yl)-2, 5-diphenyltetrazolium bromide) assay.
Cells were divided into three groups. Group 1 had no treatment (negative control), group 2 had G–SA microcapsules (positive control), and group 3 had G–TCA–SA (test) microcapsules (102 per well). Following the MTT testing at three different glucose concentrations (3.13, 5.5, and 25 mM) 24 hours post-treatment, a glucose uptake assay was carried out by exposing the cells to different treatments and then measuring the change in glucose concentrations in the media (at 5.5 mM glucose) at 24, 48, and 72 hours post-treatment. The change in glucose concentrations was considered to be due to cellular uptake.
The cells were cultured in a T-75 cm2 cell culture flask (obtained from Thermo Fischer Scientific, Australia). The MTT stock solution (5 mg/mL, purchased from Sigma Chemical Co., USA) was prepared using a phosphate buffer of pH-7.4 (Thermo Fischer Scientific, Australia). The undissolved solid residues of the reagent were filtered using a 0.45 µm syringe filter under sterile conditions, and the MTT stock solutions were stored at 4 °C and kept protected from light.
The MTT assay was carried out on 96-well plates (Thermo Fischer Scientific, Australia) that contained 100 µL of RPMI media. The cultured cells were treated with SA, G–SA, and G–TCA–SA microcapsules, placed in three different media-glucose concentrations (3.13, 5.5, and 25 mM) and left for incubation at 37 °C for 24 hours under 5% CO2. To each of the wells, 20 µL of the MTT reagent was added and left for incubation for 4 hrs, followed by the addition of 100 µL of dimethyl sulfoxide (DMSO, Sigma Chemical Co., USA). The analysis was carried out using a microplate spectrophotometer system at 560 nm (Enspire Multimode Plate Readers, PerkinElmer Inc.).
Glucose concentrations in the medium were determined using the infinity glucose assay reagent (Thermo Fisher Scientific Inc., USA). Totally 300 μL of reagent was added to 15 μL aliquots of each diluted sample, pre-culture media controls, or glucose standard solutions in duplicate, and the reactions were incubated at 37 °C for 10 minutes before recording the absorbance at 560 nm using a plate reader (Enspire Multimode Plate Readers).
Statistical analysis
Student’s t-test was used to calculate the drug content, microencapsulation efficiency, and the production yield. Comparisons of statistical data between G concentrations in different microencapsulated formulations were expressed in repeated measures analysis of variance (ANOVA) using each individual formulation excipient as fixed terms. Two-way ANOVA was used in assessing the swelling studies. Tukey HSD post-hoc comparison of means was used only when the associated main effect or interaction was statistically significant. The statistical significance was set at p < 0.05. SPSS (IBM SPSS, Version 20, Chicago, IL) was used for all analyses.
Results and discussion
Microscopic imaging and surface analysis
show that both microcapsules (G–SA and G–TCA–SA) maintained their spherical shape, and the addition of TCA did not compromise their shape and size.
Figure 2. Light microscopy of G–SA microcapsule (a); G–TCA–SA microcapsule (c); SEM image of G–SA microcapsule (b) and SEM image of G–TCA–SA microcapsule (d) at 100 µm scale, 20 µm scale, 10 µm scale, and 1 µm scale.
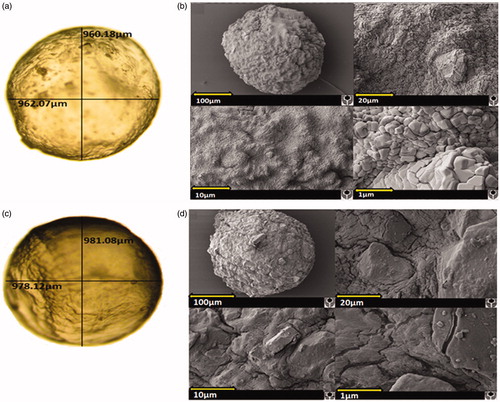
shows that G–SA microcapsules presented a solid structure with a granular-like surface, which was also noticed, but to a lesser extent, in G–TCA–SA microcapsules (; smaller microcapsule, probably due to over-heating or over-drying). This suggests a more flat and compact surface in the presence of the bile acid (TCA) and this is in line with our recently published work (Mooranian et al., Citation2014e). This may optimize drug release and microcapsule stability and result in full release of contents in the targeted site in the lower part of the intestine.
Further analysis of the elemental components of the microcapsules’ surface ( and ) revealed consistent results with that seen in . shows the presence predominantly of Ca, Na, and Cl atoms, suggesting that the small cubes shown in are sodium chloride (NaCl) crystals. NaCl is one of the by-products of the ionic gelation in microcapsule preparation (Mooranian et al., Citation2014b). There were few other elements found such as O and C, which are part of the polymer used and this is expected. This is also in line with our previous studies in bile acid-based microcapsules showing even distribution throughout the microcapsule layers (Mooranian et al., Citation2014a).
Figure 3. EDXR of G–SA microcapsules and the corresponding elemental analysis.
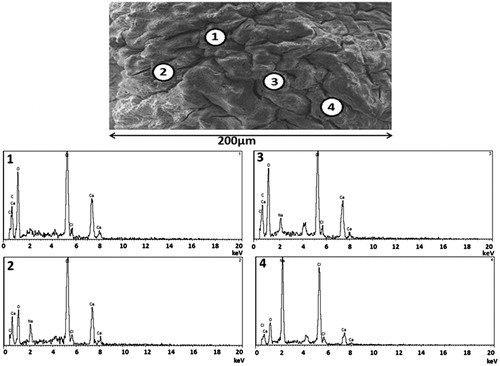
Figure 4. EDXR of G–TCA–SA microcapsules and the corresponding analysis.
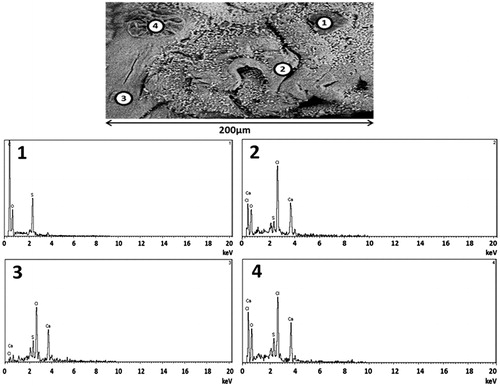
Interestingly, the incorporation of TCA resulted in the presence of S atoms on the surface of the microcapsules in all analyzed spectra (), suggesting the presence of G. This is consistent with our recently published studies showing that the incorporation of bile acids with G results in deposition of G molecules on the surface as well as in the core of the microcapsules (Mooranian et al., Citation2014d).
Viscosity, shear rate, torque, and shear stress analysis
shows that the increase of stress (mixing speed) resulted in lower viscosity, higher shear rate, higher torque, and higher shear stress; while TCA did not have any effect. Thus, the incorporation of TCA did not affect the overall rheological behavior of the G formulations. Both (G–SA and G–TCA–SA) showed non-Newtonian flow with the viscosity decreasing and the stress increasing. Both formulations behaved in a thixotropic way and their shear rate, torque, and shear stress increased with increasing stress. This is expected from this polymer matrix and is consistent with our previously published work (Mooranian et al., Citation2014b), which suggests that the incorporation of TCA did not compromise the rheological behavior of the polymer matrix.
Table 1. Viscosities and related rheological parameter of both microencapsulated formulations: G–SA and G–TCA–SA.
Thermal stability studies
Differential scanning calorimetry (DSC) was used to investigate the excipients’ compatibilities, especially after the incorporation of TCA during the pre- and post-microencapsulation process. The DSC analysis of TCA powder showed a single large peak at 223 °C, which corresponds to TCA melting point; while the DSC analysis of G-powder exhibited a large peak at 176 °C, which corresponds to G melting point. The DSC analysis of G-TCA-SA microcapsules showed two main peaks, a small one at 169 °C and a bigger one at 207 °C, suggesting a slight shift to the left for both TCA (176 °C) and G (223 °C). This suggests that G-SA interactions resulted in an endothermic shift and an overlap between G and SA melting points, with the SA melting point expected to lie in between 225 °C and 235 °C, as per our previously published work with bile acid based microcapsules (Mooranian et al., Citation2014e). The DSC analysis of G-SA microcapsules showed one large peak at 219 °C, which correlates to the G melting point and supports the potential overlap with the SA peak. The DSC analysis of the G-TCA-SA powder mixture showed two distinct peaks at 170 °C and 204 °C, which again supports the overlapping between G and SA (at 204 °C) in addition to the TCA peak at 170 °C. In line with our previous work, DSC analysis of SA powder () showed one single peak at 231 °C corresponding to the SA melting point (Mooranian et al., Citation2014c). Overall, the DSC results () suggest that the endothermic shift in melting points of G and SA pre- and post-microencapsulation may arise due to ionic interferences within the polymer matrix. In addition, it is evident from all the spectra obtained that there are no significant interactions between the drug and its excipients, suggesting compatibility (Mooranian et al., Citation2014f). Accordingly, DSC results show that the thermal stability of G has been maintained throughout the microencapsulation process and this was further confirmed by chemical stability studies using FTIR analysis ().
Figure 5. Fourier Transform Infrared spectra of (a) TCA powder, (b) G powder, (c) G–TCA–SA microcapsule, (d) G–SA microcapsule, (e) G–TCA–SA powder, and (f) SA powder.
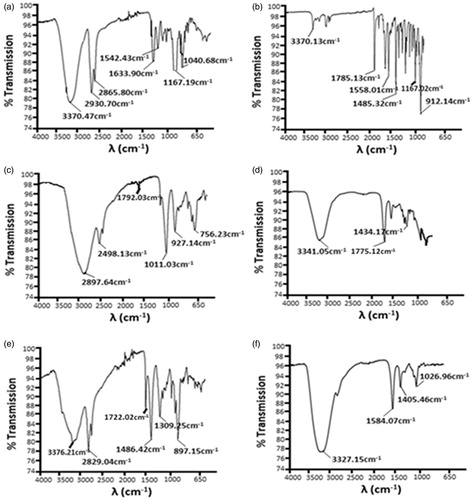
Table 2. Dominant peaks measured by DSC analysis.
Chemical stability studies
The frequency variations that appear by the presence of different functional groups within the molecule can be explained by FTIR studies (Chan et al., Citation2005; Kazarian et al., Citation2005; Kazarian & Chan, Citation2006). The TCA powder analysis () shows identical peaks to previously published work and confirms the presence of TCA (Mooranian et al., Citation2014g). shows the presence of a carbonyl group for G by exhibiting a sharp concave peak at 1785.13 cm−1, as well as the presence of sulfonyl group (R–S(=O)2–R′). No changes were seen in G-FTIR spectra and no significant changes were observed within the microcapsule formulations during the shifting process. A significant peak was noticed for the presence of an amino group at 3341.05 cm−1 in the G microcapsules () (Yang et al., Citation2005).
A minor shift towards the right side of the G peak was observed in the G–TCA–SA powder () and G–TCA–SA microcapsules (). Dilution of the bile acid in the mixture is expected to be the reason for the chemical shift. The spectrum analysis of SA powder () shows predominant O–H stretching at 3327.15 cm−1 in the form of a strong intense peak; followed by two medium intensity peaks at 1584.07 and 1405.46 cm−1 (Sartori et al., Citation1997).
The FTIR analysis showed that there were no prominent interferences seen between the G, TCA, or the polymer matrix, thereby maintaining the stability and structural integrity of the microcapsules without being altered or affected by chemical reactions (Prajapati et al., Citation2013). This supports the chemical stability of the G–TCA–SA microcapsules and confirms that the incorporation of TCA did not compromise G microcapsules.
Drug content, production yield, microencapsulation efficiency, and stability studies
As expected, and as shown in , there is less G in the G-TCA-SA microcapsules compared with G–SA microcapsules (p < 0.01), which supports the DSC findings () showing G displacement brought about by TCA addition. The total production yield of G–SA and G–TCA–SA microcapsules ranged from 80% to 90% and was not significantly different. Good levels of G-loading (microencapsulation) efficiency were achieved for all microcapsules, with values averaging 86 ± 10%.
Table 3. Drug contents (%), production yield (%), microencapsulation efficiency (%), Zeta-potential and mean particle size.
There was a reduction in Zeta potential (p < 0.01) after TCA incorporation; however, it remained high, which suggests good stability. In addition, the particle size remained similar after TCA incorporation, suggesting that the microencapsulating system was capable of efficiently maintaining a uniform size distribution of the microcapsules. When viewed visually, both microcapsules (G–SA and G–TCA–SA) retained their original morphological characteristics by preserving their sphericity and homogeneity. However, there were a few changes observed in the color, quality, and texture of the microcapsules. At −15 °C, microcapsules retained their original size and some of the microcapsules formed agglomerates. The microcapsules maintained their spherical shape and white color. At the higher temperatures, the microcapsules changed color, suggesting oxidation of the matrix (cream to yellowish-orange at 5 °C and 25 °C, and dark brown at 40 °C). The size of the microcapsules was reduced by up to 40%, with the smallest microcapsules being seen at the highest temperature, which may be explained by the loss of moisture contents.
G analysis of the microcapsules in both the formulations showed neither appearance of peaks for a biodegradable polymer nor any alteration of the chromatographic pattern, suggesting that the experimental conditions did not compromise the analysis. In addition, the small variation in the microencapsulation efficiency confirmed the reproducibility of the method. The dispersion system remained stable as indicated by the large value of the Zeta-potential ().
pH drug dissolution studies
In order to investigate the targeted release of G–SA and G–TCA–SA microcapsules, G solubility and release patterns were examined at different pH values (1.5, 3.0, 6.0, and 7.8) over a 6-hour period. The aims were to examine whether the microcapsules exert targeted release properties of G at the lower side of the intestine, which for our T1D rat model was found to be at pH 7.8 (Al-Salami et al., Citation2008c), and also to determine if TCA incorporation will affect the release patterns of G from the microcapsules. shows that, in line with our hypothesis, TCA incorporation into G-microcapsules resulted in slower release of G (p < 0.01) at pH 7.8. In addition, there was no release of G from the microcapsules at the lower pH (1.5, 3.0, and 6.0), suggesting a targeted release pattern in the lower part of the intestine. Thus, the release of G was slower and largely dependent on both the pH and the composition of the coating.
Figure 6. In vitro G-dissolution from G–SA and G–TCA–SA microcapsules at pH of 1.5 and 3.0 (a), and 6.0 and 7.8 (b). Average ± SD (n = 3).
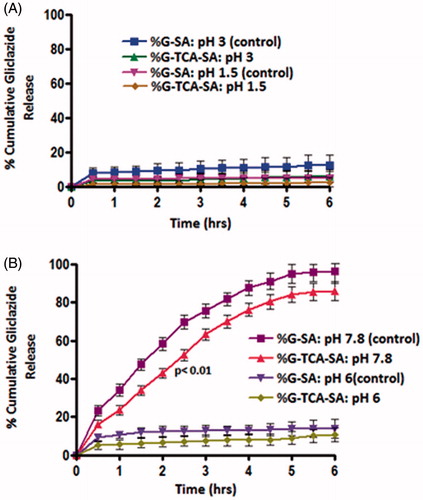
Our results demonstrate that the G–TCA–SA-reinforced microcapsules showed slower G release at the targeted pH of 7.8. At low pH, the SA matrix presents as a porous structure known as alginic acid (Al-Salami et al., Citation2008e). This insoluble structure results in the shrinkage of alginate and, thus, encapsulated G remained within the core of the microcapsules. However, at the higher pH (>6.0 pH), the alginic acid forms a soluble viscous layer due to its rapid dissolution and solubilization, resulting in the release of G. G release for the TCA-based microcapsules showed targeted release and potential applications after oral delivery.
Swelling studies
The swelling characteristics of the microcapsules at different pH values (1.5, 3.0, 6.0, and 7.8) compliment the microscopic analysis and the release studies. and show G–SA and G–TCA–SA swelling properties at different pH values and different temperatures (room temperature and body temperature). Our results demonstrate that TCA incorporation exerted a membrane stabilizing effect on G-microcapsules and resulted in more stable and swelling-resistant membrane (p < 0.01). This is in line with our previous studies that showed that bile acids strengthen and stabilize SA-based microcapsules through ion-crossing and ion-gelation with SA (Mooranian et al., Citation2014d).
Figure 7. Swelling index at 25 °C and at (a) pH 1.5 and 3.0, and (b) pH 6.0 and 7.8. Data are mean ± SD, n = 3.
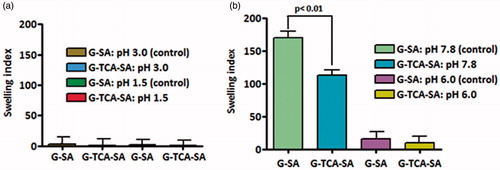
Figure 8. Swelling index at 37 °C and at (a) pH 1.5 and 3.0, and (b) pH 6.0 and 7.8. Data are mean ± SD, n = 3.
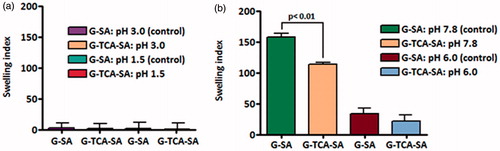
Interestingly, the swelling resistance of G-microcapsules showed a further dissolution and release pattern at pH 7.8 (p < 0.01) (), which favors their potential applications after oral administration. Thus, the results also support more stable G-microcapsules in the presence of TCA, and their physical stability as well as release pattern is desirable for oral delivery of G in T1D. The results also illustrate targeted oral delivery of G combined with a permeation enhancing bile acid, which should further optimize drug efficacy and long-term treatment. In order to compliment the swelling findings, mechanical resistance studies were carried out to investigate the effect of TCA on G-microcapsules.
Mechanical resistance
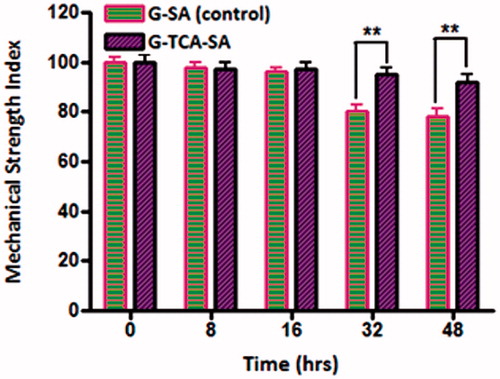
Mechanical resistance investigates the ability of microcapsules to withstand stress and pressure and remain intact. shows the percentage of intact microcapsules (control and test) during a 48 hour stress test. All the G-SA microcapsules maintained their structure for 16 hours, after which they started losing their physical adherence and ability to maintain their shape as well as dry-contents. After 48 hours, about 70% of G–SA microcapsules remained intact while all G–TCA–SA microcapsules remained intact and maintained their shape and drug contents significantly better than control (p < 0.01). Overall, our findings for the release studies, swelling studies, and mechanical resistance testing showed clearly that TCA exerted G-targeted control and membrane stabilizing effects on G-microcapsules. In addition, its permeation enhancing effect may optimize further G-delivery after oral administration in our T1D rats, and show a potential in the oral delivery of G.
Figure 9. Mechanical index of both, G–SA and G–TCA–SA microcapsules. Data expressed as mean ± SD and n = 3. **p < 0.01.
In vivo and ex vivo measurements
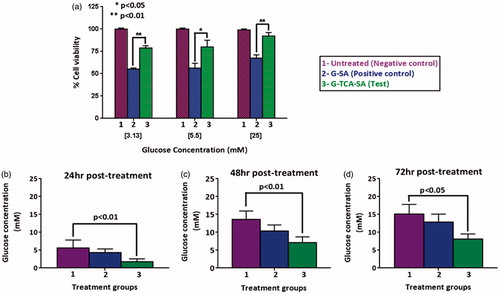
G–TCA–SA microcapsules exerted a hypoglycemic effect on diabetic rats compared with controls (). In addition, TCA incorporation enhanced G absorption () and improved cell viability (). TCA incorporation also enhanced glucose uptake by the muscle cell line C2C12 over 24, 48, and 72 hours post-exposure (). This suggests that TCA either enhanced G uptake or subsequently optimized glucose uptake by muscles independent of insulin (Tsiani et al., Citation1995), or TCA itself exerted a direct hypoglycemic effect. This is line with our previous studies demonstrating a hypoglycemic effect by a primary semi-synthetic bile acid in a rat model of Type-1 diabetes (Al-Salami et al., Citation2008a). Thus, the in-vitro findings (G release at pH 7.8) correlate with the G in-vivo absorption suggesting a suitability of our in-vitro methodology to predict drug release and absorption. It is also consistent with recently published work suggesting a permeation enhancing effect of TCA following an oral dose and a similar effect has been clearly demonstrated in our findings.
Figure 10. Blood glucose measurements (a), and Gliclazide serum concentration (b). Data are expressed as mean ± SD; n = 8 and each sample analyzed in triplicates.
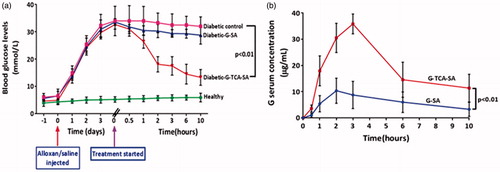
Figure 11. Cell viability at three glucose concentrations, 24 hours post exposure (a), and media-glucose concentrations at 24 (b), 48 (c), and 72 hours (d) post exposure to 5.5 mM glucose, and three different formulations of untreated (1), G–SA (2), and G–TCA–SA (3) microcapsules. Values are mean ± SD, n = 3.
This study further demonstrated a unique role of TCA in the delivery and efficacy of an anti-diabetic drug in T1D. The unique role includes improved microcapsules, cell viability, and a hypoglycemic/insulin-mimetic effect on an alloxan-induced rat model of T1D. The hypoglycemic effect may be due to better absorption or a synergistic effect. This remains to be investigated further in future studies.
Acknowledgements
The authors would like to extend sincere thanks to Professor Deirdre Coombe for providing the muscle cell lines (C2C12). The authors also acknowledge the Pharmaceutical Technology Laboratory (Curtin School of Pharmacy).
Declaration of interest
The authors declare that there is no conflict of interest. The authors acknowledge Curtin Research Scholarship (CRS) granted from Curtin University for their support. The authors also acknowledge the CHIRI at Curtin University, and the Curtin-seeding grant for support to Hani Al-Salami. Sangeetha Mathavan was a recipient of a Curtin University CUPS Scholarship. We also acknowledge the use of laboratory equipment, scientific and technical assistance of the Curtin University, Electron Microscope Facility, which has been partially funded by the University, State and Commonwealth Governments.
References
- Adeghate E, Schattner P, Dunn E. (2006). An update on the etiology and epidemiology of diabetes mellitus. Ann N Y Acad Sci 1084:1–29
- Al-Salami H, Butt G, Tucker I, et al. (2009). Gliclazide reduces MKC intestinal transport in healthy but not diabetic rats. Eur J Drug Metab Pharmacokinet 34:43–50
- Al-Salami H, Butt G, Tucker I, et al. (2012). Probiotics decreased the bioavailability of the bile acid analog, monoketocholic acid, when coadministered with gliclazide, in healthy but not diabetic rats. Eur J Drug Metab Pharmacokinet 37:99108
- Al-Salami H, Butt G, Tucker I, Mikov M. (2008a). Influence of the semisynthetic bile acid (MKC) on the ileal permeation of gliclazide in healthy and diabetic rats. Pharmacol Rep 60:532
- Al-Salami H, Butt G, Tucker I, Mikov M. (2008b). Influence of the semisynthetic bile acid (MKC) on the ileal permeation of gliclazide in healthy and diabetic rats. Pharmacol Rep 60:532–41
- Al-Salami H, Butt G, Tucker I, Mikov M. (2008c). Influence of the semisynthetic bile acid MKC on the ileal permeation of gliclazide in vitro in healthy and diabetic rats treated with probiotics. Method Find Exp Clin Pharmacol 30:107–13
- Al-Salami H, Butt G, Tucker I, Mikov M. (2008d). Probiotic treatment proceeded by a single dose of bile acid and gliclazide exert the most hypoglycemic effect in Type 1 diabetic rats. Med Hypotheses Res 4:93–101
- Al-Salami H, Butt G, Tucker I, et al. (2008e). Probiotic pre-treatment reduces gliclazide permeation (ex vivo) in healthy rats but increases it in diabetic rats to the level seen in untreated healthy rats. Arch Drug Inf 1:35–41
- Alam MJ, Rahman MA. (1971). Changes in the saccharoid fraction in rats with alloxan-induced diabetes or injected with epinephrine. Clin Chem 17:915–20
- Barakat NS, Shazly GA, Almedany AH. (2013). Influence of polymer blends on the characterization of gliclazide – encapsulated into poly (epsilon–caprolactone) microparticles. Drug Dev Ind Pharm 39:352–62
- Carvalho END, Carvalho NASD, Ferreira LM. (2003). Experimental model of induction of diabetes mellitus in rats. Acta Cirurg Brasil 18:60–4
- Chan KIA, Elkhider N, Kazarian SG. (2005). Spectroscopic imaging of compacted pharmaceutical tablets. Chem Eng Res Des 83:1303–10
- Kazarian SG, Chan KLA. (2006). Applications of ATR-FTIR spectroscopic imaging to biomedical samples. Biochim Biophys Acta – Biomembr 1758:858–67
- Kazarian SG, Kong KWT, Bajomo M, et al. (2005). Spectroscopic imaging applied to drug release. Food Bioprod Process 83:127–35
- Khatun Z, Nurunnabi M, Reeck GR, et al. (2013). Oral delivery of taurocholic acid linked heparin-docetaxel conjugates for cancer therapy. J Control Release 170:74–82
- Korec R. (1980). Treatment of alloxan and streptozotocin diabetes in rats by intrafamiliar homo (allo) transplantation of neonatal pancreases. Endocrinol Exp 14:191–8
- Lankin VZ, Korchin VI, Konovalova GG, et al. (2004). Role of antioxidant enzymes and antioxidant compound probucol in antiradical protection of pancreatic beta-cells during alloxan-induced diabetes. Bull Exp Biol Med 137:20–3
- Lee E, Kim Y-S, Bae SM, et al. (2009). Polyproline-type helical-structured low-molecular weight heparin (LMWH)–taurocholate conjugate as a new angiogenesis inhibitor. Int J Cancer 124:2755–65
- Mathews CE, Bagley R, Leiter EH. (2004). ALS/Lt: a new type 2 diabetes mouse model associated with low free radical scavenging potential. Diabetes 53:S125–9
- Mikov M, Al-Salami H, Golocorbin-Kon S, et al. (2008). The influence of 3alpha,7alpha-dihydroxy-12-keto-5beta-cholanate on gliclazide pharmacokinetics and glucose levels in a rat model of diabetes. Eur J Drug Metab Pharmacokinet 33:137–42
- Mooranian A, Negrulj R, Arfuso F, Al-Salami H. (2014a). Characterization of a novel bile acid-based delivery platform for microencapsulated pancreatic beta-cells. Artif Cells Nanomed Biotechnol. [Epub ahead of print]. DOI:10.3109/21691401.2014.934457
- Mooranian A, Negrulj R, Chen-Tan N, et al. (2014b). Novel artificial cell microencapsulation of a complex gliclazide-deoxycholic bile acid formulation: a characterization study. Drug Des Dev Ther 8:1003–12
- Mooranian A, Negrulj R, Chen-Tan N, et al. (2014c). Microencapsulation as a novel delivery method for the potential antidiabetic drug, Probucol. Drug Des Dev Ther 8:1221
- Mooranian A, Negrulj R, Chen-Tan N, et al. (2014d). An optimized probucol microencapsulated formulation integrating a secondary bile acid (deoxycholic acid) as a permeation enhancer. Drug Des Dev Ther 8:1673–83
- Mooranian A, Negrulj R, Chen-Tan N, et al. (2014e). An optimized probucol microencapsulated formulation integrating a secondary bile acid (deoxycholic acid) as a permeation enhancer. Drug Des Dev Ther 8:1673
- Mooranian A, Negrulj R, Mathavan S, et al. (2014f). An advanced microencapsulated system: a platform for optimized oral delivery of antidiabetic drug-bile acid formulations. Pharm Dev Technol 20:1–8
- Mooranian A, Negrulj R, Mathavan S, et al. (2014g). An advanced microencapsulated system: a platform for optimized oral delivery of antidiabetic drug-bile acid formulations. Pharm Dev Technol 20:702–9
- Phillips P. (2005). Type 2 Diabetes-failure, blame and guilt in the adoption of insulin therapy. Rev Diabet Stud 2:35–9
- Prajapati VD, Mashru KH, Solanki HK, Jani GK. (2013). Development of modified release gliclazide biological macromolecules using natural biodegradable polymers. Int J Biol Macromol 55:6–14
- Rakel A, Renier G, Roussin A, et al. (2007). Beneficial effects of gliclazide modified release compared with glibenclamide on endothelial activation and low-grade inflammation in patients with type 2 diabetes. Diabetes Obes Metab 9:127–9
- Rokstad AMA, Lacík I, De Vos P, Strand BL. (2014). Advances in biocompatibility and physico-chemical characterization of microspheres for cell encapsulation. Adv Drug Deliv Rev 67–68:111–30
- Sartori C, Finch DS, Ralph B, Gilding K. (1997). Determination of the cation content of alginate thin films by FTIR spectroscopy. Polymer 38:43–51
- Stetinova V, Kvetina J, Pastera J, et al. (2007). Gliclazide: pharmacokinetic-pharmacodynamic relationships in rats. Biopharm Drug Dispos 28:241–8
- Tsiani E, Ramlal T, Leiter LA, et al. (1995). Stimulation of glucose uptake and increased plasma membrane content of glucose transporters in L6 skeletal muscle cells by the sulfonylureas gliclazide and glyburide. Endocrinology 136:2505–12
- Weiss R, Caprio S. (2006). Development of type 2 diabetes in children and adolescents. Minerva Med 97:263–9
- Xu W, Ling P, Zhang T. (2013). Polymeric micelles, a promising drug delivery system to enhance bioavailability of poorly water-soluble drugs. J Drug Deliv 2013:340315. DOI: 10.1155/2013/340315
- Yang L, Xu Y, Su Y, et al. (2005). FT-IR spectroscopic study on the variations of molecular structures of some carboxyl acids induced by free electron laser. Spectrochim Acta Part A Mol Biomol Spectrosc 62:1209–15