
Abstract
Objective: Lopinavir (LPV), an antiretroviral protease inhibitor shows poor bioavailability because of poor aqueous solubility and extensive hepatic first-pass metabolism. The aim of the present work was to investigate the potential of the solid self-nanoemulsifying drug delivery system (S-SNEDDS) in improving dissolution rate and oral bioavailability of LPV.
Materials and methods: Liquid SNEDDS (L-SNEDDS) of LPV were prepared using Capmul MCM C8, Cremophor RH 40 and propylene glycol and their amounts were optimized by Scheffe’s mixture design. L-SNEDDS formulations were evaluated for different physicochemical and in vitro drug release parameters. S-SNEDDS were prepared by adsorbing L-SNEDDS on Neusilin US2 and characterized for solid-state properties. In vivo bioavailability of S-SNEDDS, marketed Lopinavir + Ritonavir (LPV/RTV) formulation and pure LPV was studied in Wistar rats. Stability study of S-SNEDDS was performed as per ICH guidelines.
Results and discussion: Optimized L-SNEDDS obtained by Scheffe design had drug loading 160 ± 1.15 mg, globule size 32.9 ± 1.45 nm and drug release >95% within 15 min. Solid state studies suggested the transformation of the crystalline drug to amorphous drug. The size and zeta potential of globules obtained on dilution S-SNEDDS remained similar to L-SNEEDS. In vivo bioavailability study revealed that S-SNEDDS has 2.97 and 1.54-folds higher bioavailability than pure LPV and LPV/RTV formulation, respectively. The optimized S-SNEDDS was found to be stable and had a shelf life of 2.85 years.
Conclusion: The significant increase in drug dissolution and bioavailability by prepared SNEDDS suggest that the developed S-SNEDDS is a useful solid platform for improving oral bioavailability of poorly soluble LPV.
Introduction
Lopinavir (LPV) is an antiretroviral protease inhibitor used in the therapy and prevention of human immunodeficiency virus (HIV) infection and the acquired immunodeficiency syndrome (AIDS). LPV is a peptidomimetic HIV protease inhibitor that inhibits both HIV-1 and HIV-2 (Brunton et al., Citation2011). LPV has become the most important component in combined chemotherapy commonly referred to as highly active anti-retroviral therapy (Flexner et al., Citation2010). LPV shows poor bioavailability when administered orally because of poor aqueous solubility and hepatic first-pass metabolism, mediated by cytochrome P450 and P-glycoprotein (P-gp) efflux which may limit intestinal uptake (Hsu et al., Citation2003; Chattopadhyay et al., Citation2008; Griffin & O’Driscoll, Citation2008; Jain et al., Citation2009). Marketed formulation of LPV is available as fixed-dose combination of LPV and another protease inhibitor ritonavir (RTV). RTV acts as a pharmacokinetic booster for LPV’s bioavailability by inhibiting CYP3A4 and P-gp system. RTV has side effects like glucose intolerance, gastrointestinal intolerance, lipid elevation and perioral paresthesia (Max & Sherer, Citation2000) and so there is a need for a formulation of LPV that has better bioavailability and does not include RTV. A number of attempts have been made to enhance the dissolution rate and, therefore, bioavailability of LPV. Researcher have used various approaches like solid lipid nanoparticles (Aji Alex et al., Citation2011; Ravi et al., Citation2014), peptide prodrug (Agarwal et al., Citation2008), polymeric nanoparticles (Ravi et al., Citation2015), solid dispersion (Tiwari et al., Citation2012) for dissolution enhancement of LPV. Since LPV belongs to Biopharmaceutical Classification System (BCS) class II, it would be advantageous to prepare lipid-based drug delivery systems like self-nanoemulsifying drug delivery systems (SNEDDS) (Balakrishnan et al., Citation2009). SNEDDS are the most widely used approach to improve the oral bioavailability of BCS class II drugs such as irbesartan, nevirapine, sirolimus, lornoxicam, piperine, carvedilol (Singh et al., Citation2011; Chudasama et al., Citation2014; Li et al., Citation2014; Patel et al., Citation2014; Shao et al., Citation2014; Ding et al., Citation2015). SNEDDS are isotropic mixtures of natural or synthetic oils with surfactants and co-surfactants. These systems spontaneously emulsify when exposed to GIT fluids to form an oil-in-water nanoemulsion with nanometric droplet size, in the range of 20–200 nm (Mou et al., Citation2008; Porter et al., Citation2008). The small droplet size confirms the highly efficient absorption of these oil droplets due to the rapid drug dissolution and release (Rao & Shao, Citation2008). SNEDDS can be used to improve oral bioavailability by enhancing permeation across the intestinal membrane, reducing or eliminating food effect, solubilization, droplet size reduction and improvement of drug dissolution (Rane & Anderson, Citation2008; Wasan et al., Citation2009; Wang et al., Citation2010). The drug can also be delivered by lymphatic transport through the intestine avoiding the hepatic first-pass metabolism (Porter et al., Citation2008). Furthermore, the surfactant component of SNEDDS formulations, i.e. Cremophor, Tween-80 and Labrasol, are reported to improve the bioavailability of absorbed compounds by facilitating transcellular and paracellular absorption. Additionally, these surfactants inhibit P-gp and/or CYP450 enzymes and so decrease intestinal efflux and drug biotransformation (Yu et al., Citation1999; Chen, Citation2008; Elnaggar et al., Citation2009; Basalious et al., Citation2010). SNEDDS formulation contains multiple components which affect product characteristics and hence preparation of optimized formulation is not achievable using the traditional drug delivery approach of changing one variable at a time. Systematic optimization of such isotropic delivery system can be achieved by the design of experiments (Singh et al., Citation2011). Application of Scheffe mixture design to pharmaceutical formulation development has been demonstrated to be an efficient and satisfactory method for optimization of the formulation and to acquire the information necessary to understand the relationship between controllable (independent) variables and performance or quality (dependent variables) of the formulation (Gao et al., Citation2004).
However, the L-SNEDDS has some limitations like low stability, drug leakage, the interaction of SNEDDS with capsule shell, etc. These potential problems can be overcome by transforming L-SNEDDS into solid dosage forms using solid carriers having high surface area. This approach combines advantages of SNEDDS with those of a solid dosage form. Different solid carriers like Aerosil 200, Neusilin US2, spray-dried lactose, etc., can be used to adsorb L-SNEDDS and convert them to free flowing powder having better stability and self-emulsification ability (Inugala et al., Citation2015).
The aim of the present study was to prepare the L-SNEDDS formulation that had high drug loading capacity and dissolution rate. The identification and optimization was done using Scheffe mixture design. The optimized formulation was characterized for relevant parameters and was then adsorbed on solid carriers. The best carrier having highest adsorption capacity and dissolution rate was chosen. In vivo bioavailability study of the S-SNEDDS was compared to pure drug.
Materials and methods
Materials
LPV was obtained as a gift sample from Hetero Drugs Ltd., Andhra Pradesh, India. Capmul MCM C8, Captex 100 and Captex 200 were generous gifts from Abitec Corporation, Janesville, WI. Sunflower oil, peppermint oil and castor oil were purchased from Hi Media Pvt. Ltd., Mumbai, India. Oleic acid was purchased from Loba Chemie Pvt. Ltd., Mumbai, India. Cremophor RH 40 and Cremophor EL were obtained from BASF, Germany. Tween-20, Tween-80, Span 80, Span 20, propylene glycol and PEG 400 were purchased from S.D. Fine Chemicals Ltd., Mumbai, India. Neusilin US2 (magnesium aluminometasilicate) was obtained as a gift sample from Fuji Chemical Industry Co., Ltd., Toyama, Japan. Aerosil 200 and Aerosil 300 were obtained from Evonik Degussa GmbH, Germany. Dialysis bag (LA653; MWCO 12000) was purchased from Hi Media. Deionized water was prepared using Milipore system, Molseim, France. Methanol and acetonitrile HPLC grade were purchased from S.D. Fine Chemicals Ltd. Freshly prepared distilled water was used throughout the study.
Methods
HPLC analysis of LPV
The HPLC system consisted of analytical HPLC with UV detector including isocratic mode of elution. The amount of LPV dissolved in each aliquot was determined at 210 nm using Phenomenex Luna 100 C 18 column (250 mm length × 4.60 mm internal diameter, 5 μm) at a flow rate of 1 ml/min. The mobile phase used was monobasic disodium phosphate buffer (pH 3.5) – acetonitrile (10:90 v/v). Filtration of the buffer was done using 0.45-μm membrane filter, and it was degassed by sonication for 15 min. The samples were diluted with acetonitrile, and each of them was filtered using 0.45-μm membrane filter. The aliquots of filtered supernatant (20 μl) were injected using a Rheodyne injector to HPLC system, and the peak areas were determined to calculate the amount of LPV.
Solubility study of LPV in oil
Saturation solubility of LPV was determined in commonly used oils. For solubility study, an excess amount of LPV was added to the vials each containing 1 ml of oil. The mixture was vortexed for 60 min to facilitate proper mixing and solubilization of LPV in the oil. The mixtures were then allowed to equilibrate at room temperature for 48 h (Wang et al., Citation2009). The samples were then centrifuged at 5000 rpm for 20 min to separate the undissolved drug. Aliquots of supernatant were suitably diluted with acetonitrile and LPV dissolved in oils was quantified using the HPLC method as mentioned above.
Screening of surfactant and co-surfactant
The solubility of LPV was determined in different surfactants (S) like Tween-80, Tween-20, Span 80, Span 20, Cremophor RH 40 and Cremophor EL and co-surfactant (CoS) like PEG-400 and propylene glycol by using the same procedure as described for the solubility study of oil. To determine the emulsification ability, an equal volume of surfactant and selected oil was mixed thoroughly. The mixtures were gently heated at 40 °C for homogenization of the components. Then, 0.1 ml of this mixture was diluted to 100 ml with distilled water. Emulsification ability of surfactant was monitored by the number of inversions required to produce a uniform emulsion in a volumetric flask. The emulsions were allowed to stand for 2 h and the transmittance was measured at 638.2 nm using UV-spectrophotometer against distilled water as the blank (Date & Nagarsenker, Citation2007). Co-surfactants were screened based on their efficacy to improve the emulsification ability of the selected surfactants. For this, surfactant was mixed with the co-surfactant in 1:1 ratio. Then selected oil was added to this mixture in oil: Smix (a mixture of surfactant and co-surfactant) ratio of 1:1 and the thereafter mixture was gently heated in a water bath to allow proper mixing and emulsification ability and transmittance were measured as for surfactant.
Construction of phase diagrams
The phase diagrams of oil, surfactant/co-surfactant (Smix) and water were constructed to determine nanoemulsification region by water titration method (Wu et al., Citation2011; Cho et al., Citation2013; Singh et al., Citation2013). Homogeneous liquid mixtures of oil (Capmul MCM C8), surfactant (Cremophor RH 40) and co-surfactant (propylene glycol) were titrated with water phase, at room temperature. Initially, S:CoS mixture was prepared in ratio 1:1, 2:1 and 3:1 by mixing them in a vortex mixture. Each of these ratios was mixed with increasing amount of oil i.e. 10–90%. The total amount of oil, surfactant:co-surfactant and water was kept 100%. Mixtures having a different proportion of oil and S:CoS were prepared and titrated with distilled water till transparent solution was obtained. Only, homogeneous, transparent, low viscosity mixtures were considered as nanoemulsions. The data obtained was fed into Chemix 3.0® (Arne Standnes, Bergen, Norway) software for construction of ternary phase diagram.
Formulation of LPV-loaded L-SNEDDS
Oil (Capmul MCM C8), surfactant (Cremophor RH 40) and co-surfactant (propylene glycol) were mixed in different proportions as mentioned in . Initially, LPV was dissolved in Capmul MCM C8 using magnetic stirrer at ambient temperature. Cremophor RH 40 and propylene glycol were mixed properly to form a homogeneous phase. Finally, the LPV-loaded oil phase was added dropwise in the mixture of S:CoS. The mixture was stirred continuously for 30 min to obtain LPV-loaded L-SNEDDS at ambient temperature.
Table 1. Experimental matrix for the Scheffe design and results (mean ± SD, n = 3).
Optimization of LPV-loaded L-SNEDDS by Scheffe’s mixture design
Scheffe’s mixture design (Scheffe, Citation1958) was developed for the optimization of three-component system: oil (X1), surfactant (X2) and co-surfactant (X3). The total amount of the three components summed to 100%. Based on the results obtained from phase diagram, the range of each component was selected as follows:
A Design-Expert® software trial version (8.0.7.1; Stat-Ease, Inc., Minneapolis, MN) was used to generate the Scheffe design. Scheffe design was selected since it minimizes the variance associated with the estimates of the coefficients in the model (Holm et al., Citation2006). The software selected a set of candidate points as a base design. These included factorial points (high and low level from the constraints on each factor, centers of edges, constraint plane centroids, axial checkpoint and an overall center point). The base design consisted of 19 runs as shown in .
Drug loading (Y1), mean droplet size (Y2) and drug released after 15 min (Y3) were used as the dependent variables. The responses of all model formulations were treated by Design-Expert® software. A suitable model for mixture designs consisting of three components includes special cubic and quadratic model. The best fitting mathematical model was selected based on the comparisons of several statistical parameters including the standard deviation (SD), the multiple correlation coefficients (R2), adjusted multiple correlation coefficient (adjusted R2) and the predicted residual sum of square (PRESS). Among them, PRESS indicates how well the model fits the data, and for the chosen model it should be small relative to the other models under consideration (Huang et al., Citation2005). The optimum formulation of this study is expected to have a droplet size as small as possible (<100 nm), high drug loading (>100 mg) and high drug release after 15 min (>90%).
Characterization of LPV-loaded L-SNEDDS
Optimized L-SNEDDS of LPV were characterized for % transmittance, droplet size and PDI of the resultant nanoemulsion. They were evaluated for robustness to dilution, zeta potential, self-emulsification time, viscosity, phase separation on centrifugation, conductivity, dye solubilization, cloud point and in vitro drug release.
Percentage transmittance
The LPV-loaded L-SNEDDS were reconstituted with distilled water and the resulting nanoemulsion was observed visually for any turbidity. Thereafter, its % transmittance was measured at 638.2 nm using UV-Vis spectrophotometer (Shimadzu 1800, Kyoto, Japan) against distilled water as the blank. The studies were conducted after 50, 100 and 1000 times’ dilution.
Determination of droplet size and zeta-potential
The droplet size and zeta potential of the reconstituted LPV-loaded L-SNEDDS were determined using Malvern Zetasizer (Nano ZS90, Malvern, Worcestershire, UK). The samples were put in “folded capillary cells” and results obtained for size, PDI and zeta-potential were recorded (Gupta et al., Citation2011).
Self-emulsification time
A quantity of 1 ml of each formulation was added to 900 ml of distilled water under continuous stirring (50 rpm) using USP 31 dissolution test apparatus II at 37 ± 0.5 °C. The time required to disperse the system completely and uniformly was determined, and the emulsification time was recorded in second (Beg et al., Citation2014).
Dilution study
LPV-loaded L-SNEDDS were diluted 50, 100 and 1000 times with distilled water and evaluated for changes in transmittance, droplet size and PDI. To check the effect of pH, optimized LPV SNEDDS were diluted with 0.1 N HCl (pH 1.2) and phosphate buffer (pH 6.8) and % transmittance and droplet size of the resultant nanoemulsion were measured (Patel & Sawant, Citation2007).
Drug content
LPV from an optimized SNEDDS formulation (1 ml) was dissolved in 10 ml methanol and sonicated for 5 min. Methanolic extract was suitably diluted and analyzed by HPLC (Patel et al., Citation2011).
Viscosity
The viscosity of LPV SNEDDS was determined with Brookfield viscometer using S62 spindle at 20 rpm at room temperature (25 °C).
Centrifugation test
The sample was diluted 100 times with distilled water, centrifuged at 4000 rpm on Remi centrifuge (Remi Equipments, Mumbai, India) for 30 min and then examined visually for any phase separation.
Dye solubilization test
Type of emulsion form after dilution was checked by dye solubilization test. A water-soluble dye was sprinkled onto the surface of the prepared nanoemulsion and observed for spontaneous dispersion to confirm the oil in water nature of the emulsion.
Cloud point measurement
Optimized L-SNEDDS were diluted with distilled water in the ratio of 1:250, placed in a water bath and its temperature was increased gradually. Cloud point was measured as the temperature at which there was a sudden appearance of cloudiness, both visually and by determining transmittance using UV-Vis spectrophotometer.
Optical birefringence
The optical clarity and isotropic nature of the optimized L-SNEDDS formulation was determined in terms of refractive index using Abbes’ refractrometer (Mettler Toledo, Mumbai, India).
Thermodynamic stability study
The effect of temperature on phase separation of optimized L-SNEDDS formulation was evaluated. The optimized SNEDDS was subjected to freeze-thaw cycles (−20 °C for 2 d followed by 40 °C for 2 d) and was observed for any phase separation.
Formulation of LPV-loaded solid SNEDDS
Optimized LPV-loaded L-SNEDDS was converted into S-SNEDDS by adsorbing it to different porous solid carriers. One milliliter of L-SNEDDS was taken in a porcelain dish and increasing quantities of solid carriers were added till it formed a solid mass. Different solid carriers like Aerosil 200, Aerosil 300, Neusilin US2, Maltodextrin and spray-dried lactose (Ahuja & Pathak, Citation2009; Chen et al., Citation2011; Beg et al., Citation2012; Milović et al., Citation2012; Mohd et al., Citation2014) were used for the adsorption of L-SNEDDS. A solid carrier which gives good flow properties, high adsorption capacity and faster drug release was selected for adsorption of L-SNEDDS.
Characterization of LPV-loaded S-SNEDDS
The reconstituted S-SNEDDS were characterized for various micrometric properties. Drug content and reconstitution properties of S-SNEDDS like % transmittance, Z-average size, PDI and zeta potential were measured as described for L-SNEDDS by dispersing 100 mg of S-SNEDDS in 10 ml of deionized water. Further solid state and surface characterization was done by Fourier-transform infrared spectroscopy (FT-IR), differential scanning calorimetry (DSC), scanning electron microscopy (SEM) and X-ray diffractometry (XRD) study.
Differential scanning calorimetry (DSC)
The physical state of LPV in S-SNEDDS was characterized using differential scanning calorimeter (DSC-60, Shimadzu). Thermograms were taken for pure LPV, S-SNEDDS without LPV and S-SNEDDS with LPV. The samples (about 1–2 mg) were placed in standard aluminum boats and an empty aluminum boat was used as the reference for all measurements at a heating rate of 10 °C/min in a nitrogen atmosphere and at the heat flow from 0 to 300 °C.
Fourier-transform infrared spectroscopy (FT-IR)
Physicochemical compatibility between LPV and excipient used to prepare S-SNEDDS was studied by using FTIR (FTIR-8300, Shimadzu) spectroscopy. The infrared (IR) spectra were recorded using an FTIR by the KBr pellet method and spectra were recorded in the wavelength region between 400 and 4000 cm−1. The spectra obtained for LPV and S-SNEDDS were compared.
X-ray diffractometry (XRD)
X-ray powder scattering measurements of LPV, S-SNEDDS without LPV and LPV-loaded S-SNEDDS were carried out with XRD (Philips PW 1729 XRD, Holland). Tungsten filament with the copper target, 40 kV, 3.3 kW and 40 mA was used as the X-ray tube. The samples were exposed to the radiation, over an angular range (2) of 360 ° at a scanning velocity of 200°/min. Scintillation detector and the DIFRAC plus software were used for signal processing.
Scanning electron microscopy (SEM)
Scanning electron micrographs of the pure LPV and S-SNEDDS were taken using field emission gun-SEM (JSM-7600F, JEOL USA, Peabody, MA) having a resolution of 1.0 nm (15 kv), 1.5 nm (1 kv) at the accelerating voltage of 0.1–30 kv. The samples were dispersed in distilled water and a drop was placed on a double adhesive tape stuck to an aluminum stub. The stubs were then coated with platinum to a thickness of about 10 Å under an argon atmosphere using a gold sputter module in a high vacuum evaporator. The stub containing the coated samples was placed in the SEM chamber.
Drug release studies
In vitro drug release from pure LPV, L-SNEDDS and S-SNEDDS was determined by in vitro dissolution as well as by dialysis bag method (Elnaggar et al., Citation2009). In this study, the drug release has been measured by both the methods.
In vitro dissolution study
In vitro release studies of pure LPV, L-SNEDDS and S-SNEDDS were performed using USP 31 dissolution test apparatus II at 37 ± 0.5 °C with a rotation speed of 50 rpm. Pure LPV drug, L-SNEDDS and S-SNEDDS equivalent to 50 mg of LPV were transferred into dissolution vessel containing 900 ml phosphate buffer (pH 6.8). For estimation of drug release, 5 ml of samples were withdrawn at 0, 5, 10, 15, 30, 45, 60, 75, 90, 120, 150 and 180 min time interval, replaced by equal volume of fresh dissolution medium. The sample were filtered through 0.45-μm membrane filter, suitably diluted with acetonitrile and drug content analyzed by developed HPLC method.
In vitro diffusion study by dialysis-bag method
Pure LPV, L-SNEDDS and S-SNEDDS equivalent to 5 mg of LPV were filled in an activated dialysis membrane (cut-off 12 000 Da) and suspended in glass beakers containing 100 ml of phosphate buffer (pH 6.8) maintained at 37 °C. The beakers were placed on magnetic stirrers and stirred with magnetic beads and were covered with paraffin film to prevent any evaporative loss during the experimental run. Aliquots were withdrawn from the receptor compartments at 0, 5, 10, 15, 30, 45, 60, 75, 90, 120, 150 and 180 min time interval, replaced with equivalent amounts of fresh phosphate buffer (pH 6.8). The sample were filtered through 0.45-μm membrane filter, suitably diluted with acetonitrile and drug content analyzed by HPLC method. All the experiments were performed in triplicate.
In vivo bioavailability study
The experimental protocol was approved by Institutional Animal Ethics Committee of K. B. Institute of Pharmaceutical Education and Research affiliated to University of Kadi Sarva Vishwavidyalaya (KBIPER/2013/473). The national guidelines for the care and use of laboratory animals were followed during the preparation of protocol-handling of animals. Female Wistar rats weighing 250 ± 20 g were used for oral bioavailability studies. Eighteen rats were distributed randomly in three groups. Group A received pure LPV suspension, Group B received S-SNEDDS (reconstituted) and Group C received LPV/RTV-marketed formulation. LPV is available in tablet form containing 200 mg of LPV and 50 mg of RTV (LPV/RTV co-formulation) by Aurobindo Pharma Limited, Hyderabad, India and was used for the present study. Animals were kept in the animal house for 1 week (stabilization period) prior to the study. The animals were fasted overnight prior to the experiment but had free access to water. S-SNEDDS and LPV/RTV-marketed formulation equivalent to LPV or pure LPV at a dose of 30 mg/kg body mass mixed with 1 ml of 0.5% of sodium carboxylmethyl cellulose solution and were given to a respective group of rats orally. Blood samples (300 μl) were collected from the orbital sinus into microfuge tubes containing anticoagulant (3.8% w/v sodium citrate) at pre-dose (0), 0.25, 0.5, 1, 2, 3, 4, 6, 8, 10 and 12 h post-dose for oral studies. These samples were further harvested for plasma by centrifuging at 4 °C for 10 min at 10 000 rpm and then stored at −20 °C until further analysis. The samples were analyzed by a validated HPLC method for estimation of LPV in rat plasma matrix.
HPLC analysis of plasma samples
All plasma samples were thawed to room temperature by keeping them in a water bath. Single-step protein precipitation method was followed for extraction of LPV from plasma. One hundred microliters of drug-spiked plasma sample was pipetted into an RIA vial and 350 μl of acetonitrile (protein precipitating solvent) was added to it and vortex mixed for 2 min. Samples were then centrifuged at 9000 rpm at 4 °C for 20 min. From the centrifuged samples, 300 μl of supernatant was transferred to a sample loading vial and injected into the HPLC system.
Pharmacokinetic data analysis
After oral administration of pure LPV, S-SNEDDS and LPV/RTV-marketed formulation, bioavailability in terms of area under the curve (AUC) was measured using the arithmetic plot of plasma concentration versus time data. AUC from time point 0 h to last sampling point (12 h) was calculated using trapezoidal equation (AUC0→t). AUC beyond the last observed plasma concentration to infinite time point (AUC0→∞) was calculated using Cn/Kel. The overall elimination constant (Kel) was determined from the slope of terminal elimination phase of log C versus time plot using linear regression analysis. The elimination half-life was then calculated from Kel. Mean residence time (MRT) was calculated by dividing AUC0−t with AUMC0−t. Percentage relative bioavailability (%F) was estimated by dividing the AUC0→∞ of formulations with the pure drug.
Statistical analysis
The statistical significance of observed variation in pharmacokinetic parameters (t1/2, Ka and Cmax) for different formulations was established using Graph Pad software (San Diego, CA) using one-way ANOVA followed by Tukey–Kramer multiple comparison tests.
Accelerated stability studies and shelf-life estimation
The S-SNEDDS containing 50 mg of LPV were filled into hard gelatin capsules. The stability was assessed at 40 ± 2 °C/75 ± 5% RH, 30 ± 2 °C/70 ± 5% RH and 25 ± 2 °C/65 ± 5% RH as per ICH guideline. Capsules were kept in a glass bottle and stored for 3 months. After a period of 1–3 months, the samples were withdrawn and evaluated for droplet size, zeta potential, % transmittance and drug content for checking physical and chemical stability.
Order of reaction was determined to identify the degradation kinetics under accelerated conditions. For estimation of shelf life, formulations were stored at 30, 40 and 50 °C and drug content were measured after 1, 2 and 3 months. The reaction rate constant (K) for drug degradation was measured from the slope of the lines at each elevated temperature using equation: slope = −K/2.303. Arrhenius plot was constructed for log K values at various elevated temperatures against the reciprocal of respective absolute temperature. From the Arrhenius plot, K value at 25 °C (K25) was determined and used to calculate shelf life (t90) by substituting in the equation: t90= 0.1052/K25.
Results and discussion
HPLC analysis of LPV
The amount of LPV in samples was determined using validated HPLC method. The HPLC method found to be linear in the range of 0.25–5 μg/ml. The calibration curve was repeated thrice with freshly prepared solutions each time. The regression equation for determination of LPV in the system is: Y = 160.5X + 34 100, where Y represents peak area and X represents the concentration of LPV. A high degree of correlation was observed between the concentration of LPV and peak area as it had an R2 value of 0.999. The run time was found to 7.58 min for LPV. The % RSD (percentage relative SD) values were found to be 0.32 and 1.03 for interday and intraday precision study, respectively (n = 6). The % RSD values <2% indicate that the method is precise for estimation of LPV. The % recovery value was found to be 100.17% for LPV indicating that the method is accurate for estimation of LPV (n = 9). The limit of detection and limit of quantification values were found to be 0.038 μg/ml and 0.115 μg/ml. All parameters suggested that developed HPLC method can be satisfactorily used for estimation of LPV.
Simple single-step precipitation method was used for estimation of LPV in rat plasma. The absolute recovery of LPV from the spiked rat plasma samples was within 98.1–100.15%, when compared with analytical standards of the same concentration. The high mean % recovery values preclude the use of internal standard (Vats et al., Citation2011). The correlation coefficient value (R2) obtained was 0.996 and % RSD for intraday and interday variation were found to be less than 5% suggesting the high precision of the method.
Solubility study of LPV in oil
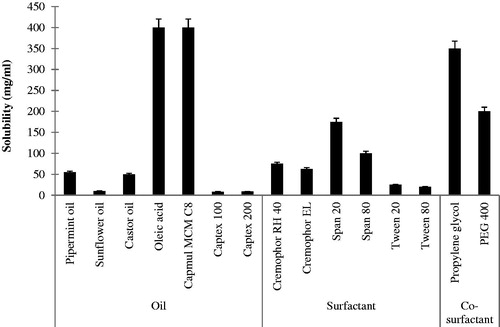
The solubility of LPV in different oils is shown in . Oil which has higher the solubilization capacity of the drug has higher drug loading potential (Pouton, Citation2000,Citation2006). shows that LPV has higher solubility in the novel semi-synthetic medium chain derivatives (Capmul MCM C8) as compared to the natural edible oils. LPV shows the highest solubility in Capmul MCM C8 and oleic acid (more than 400 mg/ml). Thus, Capmul MCM C8 and oleic acid were chosen for further study.
Figure 1. The solubility of LPV in various excipients (mean ± SD, n = 3).
Screening of the surfactant and co-surfactant
For the oral administration, non-ionic surfactants are generally considered safer than ionic surfactants (Nazzal et al., Citation2002). They form stable emulsion over a wider range of pH and ionic strength and they produce reversible changes in intestinal mucosal permeability (Swenson et al., Citation1994), additionally facilitating absorption of the co-administered drug. Hence, different non-ionic surfactants were screened for their solubilization capacity and emulsifying ability with selected oil phase. The solubility of LPV in different surfactants is shown in .
The surfactants having high HLB values show better emulsification ability due to the hydrophilicity of the surfactants which enables rapid and simplistic dispersion of the oil in the aqueous phase as a very fine oil-in-water emulsion (Constantinides, Citation1995). Span 80 and Span 20 had high solubilization capacity for LPV but showed poor emulsification with oleic acid and Capmul MCM C8 as they have transmittance value less than 90% and required more number of inversion (>20) to form an emulsion. Hence, they were not used in further study. Cremophor RH 40 has less solubilization capacity, but it shows good emulsification ability (transmittance above 90%, the number of inversion <10) as compared to Span 80 and Span 20. Hence, Cremophor RH 40 was used as a surfactant in the present study. Cremophor RH 40 was studied for its emulsification ability with Capmul MCM C8 and oleic acid. It shows poor emulsification with oleic acid (% transmittance below 95% and number of inversion >5) than Capmul MCM C8 (% transmittance 98.1% and a number of inversion <5). Hence, Capmul MCM C8 was selected as oil for further study.
Co-surfactants screened for improving the nanoemulsification ability of the selected surfactant were found to increase the spontaneity of nanoemulsion formation which was monitored by a number of inversions required to produce nanoemulsion. Propylene glycol required less number of inversions than PEG 400 indicating spontaneous nanoemulsion formation. Additionally, propylene glycol showed high solubility for the drug (>400 mg/ml) and hence was selected for further study.
Phase diagram
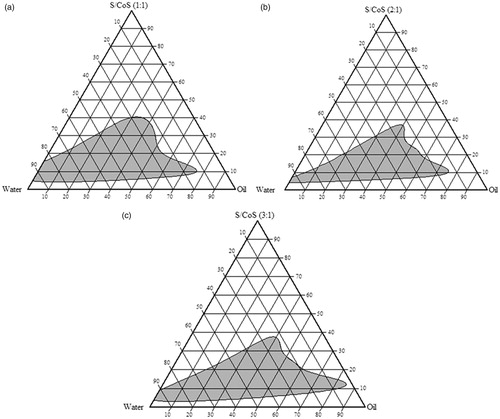
Phase diagram study is useful for the determination of the composition of three-component system which gives nanoemulsion region. Apexes of the ternary phase diagram represent 100% of the corresponding component. The shaded area shown in indicates microemulsion region. In the present study, Capmul MCM C8, Cremophor RH 40 and propylene glycol use as oil, surfactant and co-surfactant, respectively. It was observed that all three components show good miscibility with each other and no phase separation. As shown in , microemulsion region was increased as the ratio of S/CoS was increased from 1:1 to 3:1. The broad microemulsion region indicated enhanced self-emulsifying ability may be due to the increasing concentration of Cremophor RH 40 with propylene glycol, which forms uniform interfacial film resulting in narrow droplet size and greater emulsification. It was found that when S/CoS ratio was 3:1, microemulsion region widened, but at this ratio it lost the flowability because of increasing the viscosity of system and hence it was not studied further. Based on these combinations, the range for Capmul MCM C8, Cremophor RH 40 and propylene glycol was chosen as mentioned in Scheffe mixture design.
Figure 2. Phase diagram showing nanoemulsion region for various ratio of S/CoS (a) 1:1, (b) 2:1, (c) 3:1 taking Capmul MCM C8 as oil, Cremophor RH 40 as surfactant and propylene glycol as co-surfactant.
Optimization of LPV-loaded L-SNEDDS by Scheffe’s mixture design
The system components were selected based on the ability of the previously prepared ternary systems to form nanoemulsion. In order to rapidly obtain the optimal LPV-loaded SNEDDS, Scheffe mixture experimental design was applied in this study.
For SNEDDS system, it is expected that the globule size should be small, so as to have better permeation; drug loading should be more if the volume of the final formulation is to be kept small and the release should be prompt to give immediate effect. Hence, the mixture of Capmul MCM C8, Cremophor RH 40 and propylene glycol were chosen as formulation variables and mean droplet size (Y1), drug loading in SNEDDS (Y2) and cumulative drug released after 15 min (Y3) were selected as dependent variables.
The responses of these formulations are summarized in .
The independent and dependent variables were related using the polynomial equation with statistical analysis through Design-Expert® software. As shown in , the approximation of response values of Y1 based on the special cubic model while that of Y2 and Y3 based on the quadratic model, as their PRESS were smallest. The values of the coefficients X1, X2 and X3 are related to the effect of these variables on the response:
(1)
(2)
(3)
Table 2. Regression results of the measured responses.
A positive sign of coefficient indicates a synergistic effect while a negative term indicates an antagonistic effect upon the response (Huang et al., Citation2005). The larger coefficient means the independent variable has a more prominent influence on the response.
As shown in , mean droplet size for given design ranges from 21.64 to 64.12 nm. Mean droplet size of the emulsion is the important factor because it decides the drug release and absorption. As shown in Equationequation (1)(1) , interaction term X1X2 has a negative sign and high magnitude, suggesting that as the concentration Cremophor RH 40 and Capmul MCM C8 increased the size of the droplet will decrease. Previous reports demonstrate that medium chain monoglycerides like Capmul MCM C8 shows good solvent capacity for hydrophobic drugs and also promote water penetration and self-dispersibility of lipid formulations upon hydration. Additionally, Capmul is likely to increase the interfacial fluidity of surfactant boundaries in the micelles because the entrapment of Capmul in high HLB surfactant enhances the emulsification process upon dilution with an aqueous medium (Taha et al., Citation2004). These will result in narrow size of oil droplet with good surface stability. Here, the magnitude of interaction terms is higher as compared to their individual terms indicates the complex behavior of SNEDDS. The result indicates that droplet size of SNEDDS not only affected by surfactant or co-surfactant but the interaction of oil with surfactant and co-surfactant. The results are supported by 2D counter plot shown in .
Figure 3. 2D contour plots for the effect of variables on (a) mean droplet size, (b) drug loading and (c) % drug release after 15 min.
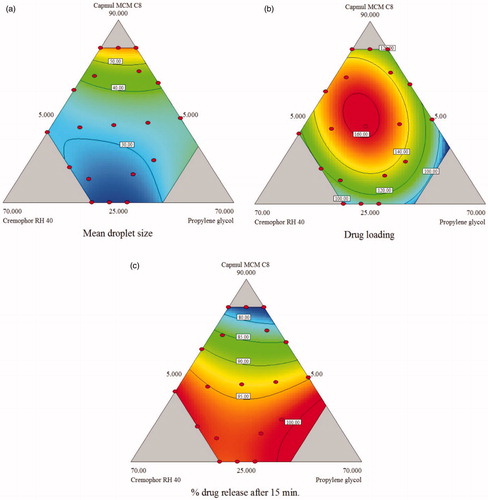
Drug loading of the studied SNEDDS varied between 81.67 and 161.5 mg/ml. EquationEquation (2)(2) indicate that coefficient of X1 have a positive sign indicating that increase in oil amount should increase drug loading. However, the coefficient of interaction terms had high magnitude indicating that interaction of the individual components plays a major role in determining drug loading. Counter plot indicates that the drug loading increases as the amount of oil and co-surfactant increase. As shown in , counterplot suggests that oil provides the largest contribution to the solubility of LPV, as the amount of oil increases drug loading is increased. This finding also supported by regression coefficient which shows a higher value than other two components.
Drug release after 15 min for prepared L-SNEDDS ranged from 75.2 to 99.2%. The quadratic model is best suitable model for the response Y3 (drug release after 15 min.). As shown in Equationequation (3)(3) amounts of surfactant and co-surfactant has a more prominent effect on drug release, as their level increase drug release also increases. shows p value for the different factors in ANOVA. Interaction term X1X2 has a positive effect on drug release (p< 0.05). shows Counter plot illustrating the effect of varying ratio of X1, X2 and X3 on the release of drug from LPV-loaded SNEDDS. As shown in counter plot indicates that more than 90% drug release is obtained when SNEDDS formulation is prepared with oil concentration <60% and surfactant concentration > 20%.
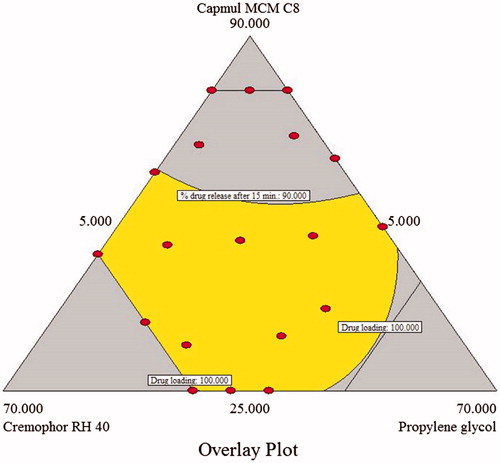
The aim of the optimization of SNEDDS is generally to determine levels of a variable from which a robust product with high quality can be produced. In this study, the desirable responses for optimized formulation are: drug loading (>100 mg), droplet size (<100 nm) and drug release after 15 min (>90%). These three responses were then combined to determine an all over the optimum region. shows an acceptable region that met the selected constraints for these responses.
Figure 4. Overlay plot for the effect of different variables on the three responses; mean droplet size (Y1), drug loading (Y2) and the cumulative amount of LPV released after 15 min from SNEDDS (Y3).
To validate the predictability of the generated mathematical models, a check point batch was identified from the desirable zone and the batch was prepared. The SNEDDS composition of this is reported in , along with the predicted and observed responses. There is a good correlation between observed and predicted value, thus the validity of the generated model is established.
Table 3. Comparison of observed values with predicted values for checkpoint batch.
Characterization of optimized L-SNEDDS
The optimized L-SNEDDS was diluted with distilled water and % transmittance of resultant nanoemulsion was found to be 99.4 ± 0.93% indicate the formation of the clear and transparent nanoemulsion. The average droplet size of optimized formulation was 32.9 ± 1.45 nm and PDI value of 0.142 ± 0.012. The lower PDI value indicates uniform droplet size distribution. The zeta potential for the formulation was −22.7 ± 1.2 mV, the negative charge may be due to surfactant and co-surfactant present in the formulation. Previous reports show that a zeta potential value in between −20 and −11 mV leads to threshold agglomeration. Here, the optimized formulation has zeta potential −22.7 mV means it would not exhibit threshold agglomeration (Zang & Gu, Citation2006). Self-emulsification time of L-SNEDDS was found to be 15 ± 4 s indicates spontaneous nanoemulsion formation on contact with physiological fluids. Effect of dilution medium and robustness to dilution was monitored by diluting the SNEDDS 50, 100 and 1000 times with distilled water, 0.1 N HCl (pH 1.2) and phosphate buffer (pH 6.8). The results of this study indicate that resultant nanoemulsion was stable and transparent at all pHs having % transmittance more than 95%. There is an absence of drug precipitation after dilution, showing the stability of reconstituted emulsion. Drug content of the optimized formulation was found to be 99.03 ± 0.42%. The viscosity of the optimized L-SNEDDS was found 523 ± 10 centipoises at 25 °C indicating good flowability. Results of centrifugation test indicate that diluted SNEDDS does not show phase separation when centrifuged at 4000 rpm. Dye solubilization test indicate rapid incorporation of a water-soluble dye, indicating o/w type of emulsion. Cloud point for the optimized L-SNEDDS is 78 °C, indicating that it will form a stable emulsion at physiological pH without precipitation. The optical clarity of the optimized liquid SNEDDS formulation was determined in terms of refractive index, the value of it for L-SNEDDS 1.453 indicating isotropic nature of SNEDDS formulation. The optimized SNEDDS was subjected to freeze-thaw stability study, no phase separation was observed after this study.
Selection of carrier for preparation of S-SNEDDS
The optimized L-SNEDDS was adsorbed on different solid carriers like Aerosil 200, Aerosil 300, Neusilin US2, maltodextrin and spray-dried lactose. For adsorption of 1 ml of liquid SNEDDS, 423 mg of Aerosil 200, 395 mg of Aerosil 300, 380 mg of Neusilin US2, 3860 mg of maltodextrin and 3643 mg of spray-dried lactose were required. So among this Neusilin US2 was chosen as a solid carrier for adsorption of optimized L-SNEDDS, as it had the highest adsorption capacity and good flow properties (angle of repose < 25).
Characterizations of LPV-loaded S-SNEDDS
The S-SNEDDS was characterized for flow property by measuring the angle of repose, Carr’s index and Hausner’s ratio; values for these tests are 28.61 ± 2.13, 13.89 ± 1.23 and 1.16 ± 0.02, respectively. These values indicate that prepared S-SNEDDS have good flowability. Drug content of optimized S-SNEDDS is 99.03 ± 0.54%; indicate good recovery of LPV after reconstitution. S-SNEDDS when evaluated for self-emulsification time and droplet size had a value of 20 ± 2 s and 30.63 ± 2.34 nm, indicating that when it contact with physiological fluid nanoemulsion is formed rapidly and droplets are nano size and so it should show fast absorption.
Differential scanning calorimetry
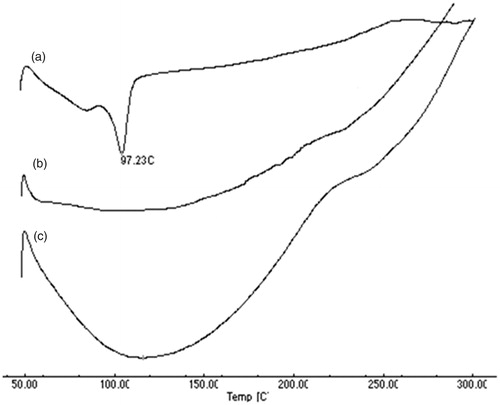
As shown in , DSC thermogram of pure LPV shows a sharp endothermic peak at 97.23 °C which is absent in placebo S-SNEDDS. The sharp endothermic peak indicates crystalline nature of the drug, which is also supported by XRD study. The intensity of peak was significantly reduced in the thermogram of the LPV-loaded S-SNEDDS which indicates the incorporation of LPV in the S-SNEDDS.
Figure 5. DSC thermogram for (a) LPV, (b) placebo S-SNEDDS without LPV and (c) LPV-loaded S-SNEDDS.
Fourier-transform infrared spectroscopy study
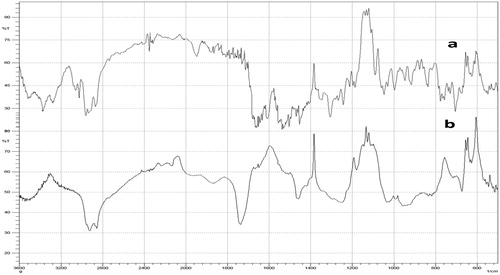
To check compatibility of the LPV with selected excipient, FT-IR was carried out. shows the spectra of LPV and LPV S-SNEDDS, respectively, in the region 400–4000 cm−1. The FT-IR spectra of pure LPV shows major peaks at 3030–3060 cm−1 (CH aromatic), 2962 cm−1 (aliphatic -CH stretching), 1760 cm−1 (C = O), 1510–1600 cm−1 (C-C aromatic) and 1350 cm−1 (C-N). The characteristic absorption peaks of LPV were retained in S-SNEDDS formulation without any additional peaks and, therefore, signify no interaction between drug and other component.
Figure 6. FT-IR spectra for (a) LPV and (b) LPV-loaded S-SNEDDS.
X-ray diffraction study
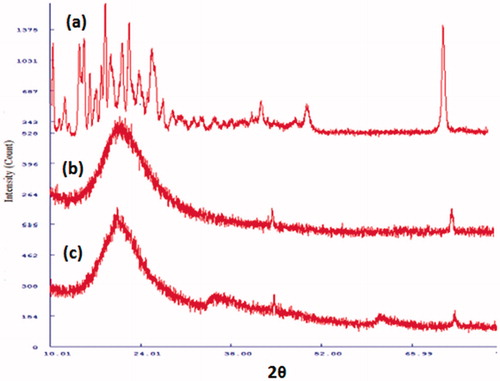
The physical state of LPV in S-SNEDDS was studied by XRD study. As shown in , XRD pattern of LPV shows sharp peaks at 14.68, 18.69, 21.58, 26.32, 43.67, 50.96 and 72.72° indicates crystalline nature of the drug. As shown in , XRD patterns of S-SNEDDS without LPV and LPV-loaded S-SNEDDS are characterized by diffuse spectra without sharp peaks of LPV indicative of amorphous nature of the formulation. The result suggests a loss of crystallinity of LPV when S-SNEDDS are formed.
Figure 7. X-ray diffraction patterns for (a) LPV, (b) placebo S-SNEDDS without LPV and (c) LPV-loaded S-SNEDDS.
Scanning electron microscopy
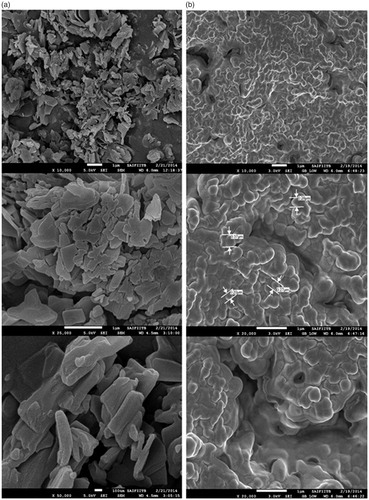
SEM of LPV and S-SNEDDS at different magnification is shown in . SEM image of LPV shows that it is present as rectangular irregular crystal (). SEM image of S-SNEDDS show irregular-shaped granular particles () indicating complete incorporation of the drug on the surface of Neusilin US 2.
Figure 8. SEM images of (a) pure LPV, (b) LPV-loaded S-SNEDDS at a magnification of 10 000×, 20 000×, 25 000× and 50 000×. Scale bars are shown in the individual micrograph.
Drug release study
In vitro dissolution study
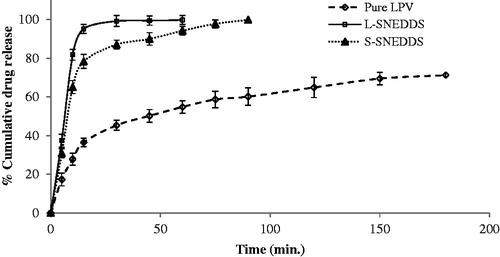
In vitro dissolution profile of LPV, L-SNEDDS and S-SNEDDS in phosphate buffer pH 6.8 is shown in . In vitro drug release studies shows that optimized L-SNEDDS and S-SNEDDS formulations exhibited faster drug release up to 99.23% and 87.11% within 30 min in phosphate buffer 6.8 while the LPV shows maximum drug release up to 45.35% in 30 min. Drug release from S-SNEDDS was slightly slower compared to L-SNEDDS because of the time required for desorption of L-SNEDDS from silica surface and diffusion through interparticulate voids of porous carrier slows down the release process. L-SNEDDS and S-SNEDDS have higher dissolution as compared to pure LPV; which might be because of the presence of surfactant, co-surfactant and porous carrier in S-SNEDDS. The presence of surfactant causes spontaneous nanoemulsion formation with small droplet size permitting higher dissolution rate as compared to pure LPV. The increase in dissolution rate can be further attributed to amorphization of the drug.
Figure 9. Dissolution profile for pure LPV, L-SNEDDS and S-SNEDDS in phosphate buffer (pH 6.8) (mean ± SD, n = 3).
In vitro drug diffusion study using dialysis bag
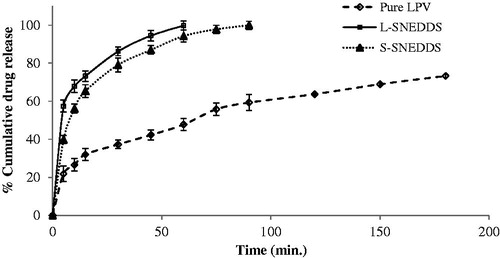
As shown in , in vitro drug diffusion from pure LPV is less as compared to L-SNEDDS and S-SNEDDS. Drug release through S-SNEDDS is low as compared to L-SNEDDS. S-SNEDDS shows 99% drug release after 90 min while that of the pure drug is only 59%. The release study suggests the enhancement of diffusion rate by SNEDDS formulation. The data of in vitro diffusion study was fitted to zero-order, first-order and Higuchi mathematical models to determine the best-fit model for studying the release of LPV from S-SNEDDS. The Higuchi model was found to be the best-fit for the release of LPV from S-SNEDDS (K= 7.217, R2 = 0.956). Hence, it could be concluded that the release of LPV from S-SNEDDS was through the diffusion of LPV from oily droplets.
Figure 10. In vitro diffusion study for pure LPV, L-SNEDDS and S-SNEDDS in phosphate buffer (pH 6.8) (mean ± SD, n = 3).
In vivo bioavailability study
In vivo oral bioavailability studies were conducted in Wistar rats and comparative pharmacokinetic profiles of LPV from pure LPV, S-SNEDDS and LPV/RTV-marketed product were shown in . The non-compartmental pharmacokinetic parameters were calculated () to evaluate the absorption behavior of LPV from pure LPV, S-SNEDDS and LPV/RTV marketed product. The AUC is a significant pharmacokinetic parameter which indicates life span of the drug inside the body after its release from the dosage form. AUC0→∞ was found to be 5784.25 ± 213, 17234.88 ± 345 and 11208.43 ± 122 for pure LPV, S-SNEDDS and LPV/RTV-marketed product, respectively. Higher values of AUC from S-SNEDDS may be because of many factors which, either in combination or alone contribute for favored magnitude of absorption by lymphatic transport of drug through intestinal transcellular pathways. In addition, the vehicles used in the formulation modulate the P-gp efflux pumps and/or CYP450 enzymes function at intestine region and improve the absorption of the drug. S-SNEDDS showed significantly better absorption than pure LPV and LPV/RTV-marketed product. The value absorption rate constant (Ka) for S-SNEDDS was significantly higher than LPV and LPV/RTV-marketed product (p < 0.001). The peak drug concentration (Cmax) of S-SNEDDS (1664.2 ± 202 ng/ml) was approximately 2.58 and 1.4-fold higher than pure LPV (645.72 ± 91 ng/ml) and LPV/RTV-marketed product (1187.54 ± 105 ng/ml). Higher Cmax value of S-SNEDDS indicates that metabolism of LPV has reduced to a significant extent (p < 0.05). Time to reach the peak drug concentration (Tmax) was less for S-SNEDDS as compared to pure LPV clearly indicates that the transformation of the emulsion from S-SNEDDS was spontaneous. No significant difference was observed for MRT values for S-SNEDDS, pure LPV and LPV/RTV-marketed product. Overall, these results confirm the improved rate and extent of the drug absorption from developed S-SNEDDS. Earlier reports suggest that the majority of the lipid-based systems comprising of long chain and medium fatty acids gain access to intestinal lymph and bypass the portal circulation, whereas a larger portion of shorter chain lipids get absorbed into the systemic circulation (Caliph et al., Citation2000). Results of in vivo study also shows favored absorption of LPV from S-SNEDDS formulation because of the medium chain triglycerides in Capmul MCM C8 enhances lipoprotein synthesis and subsequent lymphatic absorption (Porter et al., Citation2008).
Figure 11. Plasma concentration versus time profile after oral administration of LPV suspension reconstituted LPV-loaded S-SNEDDS and LPV/RTV marketed formulation (mean ± SD, n = 6).
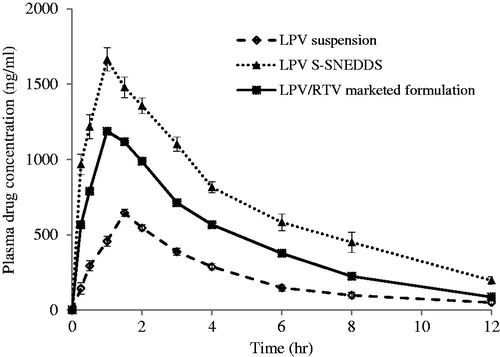
Table 4. Pharmacokinetic parameters calculated using Wagner–Nelson method (mean ± SD, n = 6).
Stability study
The stability study was performed for S-SNEDDS as per ICH guidelines, periodically samples were removed and checked for droplet size, zeta potential, % transmittance and drug content. S-SNEDDS filled capsule did not show any significant change in these parameters indicating stability of S-SNEDDS for a period of 3 months. To determine the shelf life of prepared S-SMEDDS stored at 30, 40 and 50 °C, drug concentration and log drug concentration remain were measured. The order of drug degradation found to follow first-order kinetic. The reaction rate constant K were measure for each temperature from the slope of log drug remained versus time graph. Arrhenius plot for S-SNEDDS was drawn between log K against reciprocal of absolute temperature (1/T×103); from this K25 value was determined to estimate shelf-life. Shelf life for S-SNEDDS at room temperature found to be 34.2 months or 2.85 years.
Conclusion
In the present study, L-SNEDDS and S-SNEDDS of LPV were prepared and characterized for in vitro characteristics. All the formulations showed good release profiles and exhibited a rapid rate of emulsification. Scheffe mixture experimental design was applied in order to rapidly obtain the optimal LPV-loaded SNEDDS formulation so to contain a minimum amount of surfactant, a maximum amount of lipid, highest emulsification and dissolution rates. The optimized L-SNEDDS of LPV was converted into solid SNEDDS by adsorbing it onto Neusilin US2. The significant increase in drug dissolution and the inclusion of bioenhancement agents in the developed SNEDDS of LPV propose that the prepared system could be promising to improve oral absorption of LPV. In vivo pharmacokinetic study indicate improved oral bioavailability which might be due to combining effect of nanoemulsion formation with greater surface area, improved drug dissolution and release, preventing cytochrome P450 metabolism and P-gp modulation potential of excipient. Optimized LPV-loaded S-SNEDDS was stable at ambient storage condition having a shelf life of 2.85 years.
Acknowledgements
The authors acknowledge the help of Hetero Drugs Limited (Hyderabad, India) for providing the generous gift sample of LPV. They also acknowledge the Abitec Corporations (Cleveland, OH, USA), BASF Corp. (Ludwigshafen, Germany) and Fuji Chemical Industry Co., Ltd. (Toyama, Japan) for providing the gift samples of Capmul MCM C8, Captex 100, Captex 200, Cremophor RH 40, Cremophor EL and Neusilin US2.
Declaration of interest
The authors report no declarations of interest.
Related Research Data
References
- Agarwal S, Boddu SH, Jain R, et al. (2008). Peptide prodrugs: improved oral absorption of lopinavir, a HIV protease inhibitor. Int J Pharm 359:7–14
- Ahuja G, Pathak K. (2009). Porous carriers for controlled/modulated drug delivery. Indian J Pharm Sci 71:599
- Aji Alex MR, Chacko AJ, Jose S, et al. (2011). Lopinavir loaded solid lipid nanoparticles (SLN) for intestinal lymphatic targeting. Eur J Pharm Sci 42:11–18
- Balakrishnan P, Lee BJ, Oh DH, et al. (2009). Enhanced oral bioavailability of dexibuprofen by a novel solid self-emulsifying drug delivery system (SEDDS). Eur J Pharm Biopharm 72:539–45
- Basalious EB, Shawky N, Badr-Eldin SM. (2010). SNEDDS containing bioenhancers for improvement of dissolution and oral absorption of lacidipine. I: development and optimization. Int J Pharm 391:203–11
- Beg S, Sandhu PS, Batra RS, et al. (2015). QbD-based systematic development of novel optimized solid self-nanoemulsifying drug delivery systems (SNEDDS) of lovastatin with enhanced biopharmaceutical performance. Drug Deliv 22:765–84
- Beg S, Swain S, Singh HP, et al. (2012). Development, optimization, and characterization of solid self-nanoemulsifying drug delivery systems of valsartan using porous carriers. AAPS PharmSciTech 13:1416–27
- Brunton L, Chabner B, Knollman B. (2011). Goodman and Gilman’s the pharmacological basis of therapeutics. 12th ed. New York: McGraw-Hill Education
- Caliph SM, Charman WN, Porter CJ. (2000). Effect of short-, medium-, and long-chain fatty acid-based vehicles on the absolute oral bioavailability and intestinal lymphatic transport of halofantrine and assessment of mass balance in lymph-cannulated and non-cannulated rats. J Pharm Sci 89:1073–84
- Chattopadhyay N, Zastre J, Wong HL, et al. (2008). Solid lipid nanoparticles enhance the delivery of the HIV protease inhibitor, atazanavir, by a human brain endothelial cell line. Pharm Res 25:2262–71
- Chen ML. (2008). Lipid excipients and delivery systems for pharmaceutical development: a regulatory perspective. Adv Drug Deliv Rev 60:768–77
- Chen Y, Chen C, Zheng J, et al. (2011). Development of a solid supersaturatable self-emulsifying drug delivery system of docetaxel with improved dissolution and bioavailability. Biol Pharm Bull 34:278–86
- Cho W, Kim MS, Kim JS, et al. (2013). Optimized formulation of solid self-microemulsifying sirolimus delivery systems. Int J Nanomedicine 8:1673–82
- Chudasama A, Patel V, Nivsarkar M, et al. (2015). Role of lipid-based excipients and their composition on the bioavailability of antiretroviral self-emulsifying formulations. Drug Deliv 22:531–40
- Constantinides PP. (1995). Lipid microemulsions for improving drug dissolution and oral absorption: physical and biopharmaceutical aspects. Pharm Res 12:1561–72
- Date AA, Nagarsenker MS. (2007). Design and evaluation of self-nanoemulsifying drug delivery systems (SNEDDS) for cefpodoxime proxetil. Int J Pharm 329:166–72
- Ding W, Hou X, Cong S, et al. (2015). Co-delivery of honokiol, a constituent of Magnolia species, in a self-microemulsifying drug delivery system for improved oral transport of lipophilic sirolimus. Drug Deliv. [Epub ahead of print]. doi: 10.3109/10717544.2015.1020119
- Elnaggar YS, El-Massik MA, Abdallah OY. (2009). Self-nanoemulsifying drug delivery systems of tamoxifen citrate: design and optimization. Int J Pharm 380:133–41
- Flexner C, Tierney C, Gross R, et al. (2010). Comparison of once-daily versus twice-daily combination antiretroviral therapy in treatment-naive patients: results of AIDS clinical trials group (ACTG) A5073, a 48-week randomized controlled trial. Clin Infect Dis 50:1041–52
- Gao P, Witt MJ, Haskell RJ, et al. (2004). Application of a mixture experimental design in the optimization of a self-emulsifying formulation with a high drug load. Pharm Dev Technol 9:301–9
- Griffin BT, O’Driscoll CM. (2008). An examination of the effect of intestinal first pass extraction on intestinal lymphatic transport of saquinavir in the rat. Pharm Res 25:1125–33
- Gupta S, Chavhan S, Sawant KK. (2011). Self-nanoemulsifying drug delivery system for adefovir dipivoxil: design, characterization, in vitro and ex vivo evaluation. Colloids Surf A Physicochem Eng Asp 392:145–55
- Holm R, Jensen IH, Sonnergaard J. (2006). Optimization of self-microemulsifying drug delivery systems (SMEDDS) using a D-optimal design and the desirability function. Drug Dev Ind Pharm 32:1025–32
- Hsu A, Isaacson J, Brun S, et al. (2003). Pharmacokinetic-pharmacodynamic analysis of lopinavir-ritonavir in combination with efavirenz and two nucleoside reverse transcriptase inhibitors in extensively pretreated human immunodeficiency virus-infected patients. Antimicrob Agents Chemother 47:350–9
- Huang Y-B, Tsai YH, Lee SH, et al. (2005). Optimization of pH-independent release of nicardipine hydrochloride extended-release matrix tablets using response surface methodology. Int J Pharm 289:87–95
- Inugala S, Eedara BB, Sunkavalli S, et al. (2015). Solid self-nanoemulsifying drug delivery system (S-SNEDDS) of darunavir for improved dissolution and oral bioavailability: in vitro and in vivo evaluation. Eur J Pharm Sci 74:1–10
- Jain V, Prasad V, Jadhav P, et al. (2009). Preparation and performance evaluation of saquinavir laden cationic submicron emulsions. Drug Deliv 16:37–44
- Li F, Song S, Guo Y, et al. (2015). Preparation and pharmacokinetics evaluation of oral self-emulsifying system for poorly water-soluble drug Lornoxicam. Drug Deliv 22:487–98
- Max B, Sherer R. (2000). Management of the adverse effects of antiretroviral therapy and medication adherence. Clin Infect Dis 30:S96–116
- Milović M, Djuriš J, Djekić L, et al. (2012). Characterization and evaluation of solid self-microemulsifying drug delivery systems with porous carriers as systems for improved carbamazepine release. Int J Pharm 436:58–65
- Mohd AB, Sanka K, Bandi S, et al. (2015). Solid self-nanoemulsifying drug delivery system (S-SNEDDS) for oral delivery of glimepiride: development and antidiabetic activity in albino rabbits. Drug Deliv 22:499–508
- Mou D, Chen H, Du D, et al. (2008). Hydrogel-thickened nanoemulsion system for topical delivery of lipophilic drugs. Int J Pharm 353:270–6
- Nazzal S, Smalyukh I, Lavrentovich O, et al. (2002). Preparation and in vitro characterization of a eutectic based semisolid self-nanoemulsified drug delivery system (SNEDDS) of ubiquinone: mechanism and progress of emulsion formation. Int J Pharm 235:247–65
- Patel D, Sawant KK. (2007). Oral bioavailability enhancement of acyclovir by self-microemulsifying drug delivery systems (SMEDDS). Drug Dev Ind Pharm 33:1318–26
- Patel J, Dhingani A, Garala K, et al. (2014). Quality by design approach for oral bioavailability enhancement of irbesartan by self-nanoemulsifying tablets. Drug Deliv 21:412–35
- Patel J, Patel A, Raval M, et al. (2011). Formulation and development of a self-nanoemulsifying drug delivery system of irbesartan. J Adv Pharm Technol Res 2:9–16
- Porter CJ, Pouton CW, Cuine JF, et al. (2008). Enhancing intestinal drug solubilisation using lipid-based delivery systems. Adv Drug Deliv Rev 60:673–91
- Pouton CW. (2000). Lipid formulations for oral administration of drugs: non-emulsifying, self-emulsifying and ‘self-microemulsifying’ drug delivery systems. Eur J Pharm Sci 11:S93–8
- Pouton CW. (2006). Formulation of poorly water-soluble drugs for oral administration: physicochemical and physiological issues and the lipid formulation classification system. Eur J Pharm Sci 29:278–87
- Rane SS, Anderson BD. (2008). What determines drug solubility in lipid vehicles: is it predictable? Adv Drug Deliv Rev 60:638–56
- Rao SV, Shao J. (2008). Self-nanoemulsifying drug delivery systems (SNEDDS) for oral delivery of protein drugs: I. Formulation development. Int J Pharm 362:2–9
- Ravi PR, Vats R, Dalal V, et al. (2014). A hybrid design to optimize preparation of lopinavir loaded solid lipid nanoparticles and comparative pharmacokinetic evaluation with marketed lopinavir/ritonavir coformulation. J Pharm Pharmacol 66:912–26
- Ravi PR, Vats R, Dalal V, et al. (2015). Design, optimization and evaluation of poly-ɛ-caprolactone (PCL) based polymeric nanoparticles for oral delivery of lopinavir. Drug Dev Ind Pharm 41:131–40
- Scheffe H. (1958). Experiments with mixtures. J Roy Statist Soc Ser B 20:344–60
- Shao B, Cui C, Ji H, et al. (2014). Enhanced oral bioavailability of piperine by self-emulsifying drug delivery systems: in vitro, in vivo and in situ intestinal permeability studies. Drug Deliv 22:740–7
- Singh B, Khurana L, Bandyopadhyay S, et al. (2011). Development of optimized self-nano-emulsifying drug delivery systems (SNEDDS) of carvedilol with enhanced bioavailability potential. Drug Deliv 18:599–612
- Singh B, Singh R, Bandyopadhyay S, et al. (2013). Optimized nanoemulsifying systems with enhanced bioavailability of carvedilol. Colloids Surf B Biointerfaces 101:465–74
- Swenson ES, Milisen WB, Curatolo W. (1994). Intestinal permeability enhancement: efficacy, acute local toxicity, and reversibility. Pharm Res 11:1132–42
- Taha EI, Al-Saidan S, Samy AM, et al. (2004). Preparation and in vitro characterization of self-nanoemulsified drug delivery system (SNEDDS) of all-trans-retinol acetate. Int J Pharm 285:109–19
- Tiwari R, Agarwa R, et al, Kailya JR. (2012). Process for the preparation of solid dispersion of lopinavir and ritonavir. Google Patents
- Vats R, Murthy AN, Ravi PR. (2011). Simple, rapid and validated LC determination of lopinavir in rat plasma and its application in pharmacokinetic studies. Sci Pharm 79:849–63
- Wang L, Dong J, Chen J, et al. (2009). Design and optimization of a new self-nanoemulsifying drug delivery system. J Colloid Interface Sci 330:443–8
- Wang Z, Sun J, Wang Y, et al. (2010). Solid self-emulsifying nitrendipine pellets: preparation and in vitro/in vivo evaluation. Int J Pharm 383:1–6
- Wasan EK, Bartlett K, Gershkovich P, et al. (2009). Development and characterization of oral lipid-based amphotericin B formulations with enhanced drug solubility, stability and antifungal activity in rats infected with Aspergillus fumigatus or Candida albicans. Int J Pharm 372:76–84
- Wu Z, Guo D, Deng L, et al. (2011). Preparation and evaluation of a self-emulsifying drug delivery system of etoposide-phospholipid complex. Drug Dev Ind Pharm 37:103–12
- Yu L, Bridgers A, Polli J, et al. (1999). Vitamin E-TPGS increases absorption flux of an HIV protease inhibitor by enhancing its solubility and permeability. Pharm Res 16:1812–7
- Zang XX Q, Gu N. (2006). Preparation of All-Trans Retinoic Acid nanosuspensions using a modified precipitation method. Drug Dev Ind Pharm 32:857–63