
Abstract
Improvement of water solubility, dissolution rate, oral bioavailability, and reduction of first pass metabolism of OL (OL), were the aims of this research. Co-amorphization of OL carboxylic acid dispersions at various molar ratios was carried out using rapid solvent evaporation. Characterization of the dispersions was performed using differential scanning calorimetry (DSC), Fourier transform infrared spectrometry (FTIR), X-ray diffractometry (XRD), and scanning electron microscopy (SEM). Dispersions with highest equilibrium solubility were formulated as fast dissolving oral films. Modeling and optimization of film formation were undertaken using artificial neural networks (ANNs). The results indicated co-amorphization of OL-ascorbic acid through H-bonding. The co-amorphous dispersions at 1:2 molar ratio showed more than 600-fold increase in solubility of OL. The model optimized fast dissolving film prepared from the dispersion was physically and chemically stable, demonstrated short disintegration time (8.5 s), fast dissolution (97% in 10 min) and optimum tensile strength (4.9 N/cm2). The results of in vivo data indicated high bioavailability (144 ng h/mL) and maximum plasma concentration (14.2 ng/mL) compared with the marketed references. Therefore, the optimized co-amorphous OL-ascorbic acid fast dissolving film could be a valuable solution for enhancing the physicochemical and pharmacokinetic properties of OL.
Introduction
Typical antipsychotic drugs are usually classified by their chemical structure and the potency of binding to the dopamine type 2 (D2) receptors, while new antipsychotic agents differ from selective dopamine antagonist in having a broader receptor affinity and hence called atypical antipsychotics. The atypical antipsychotics are characterized by improved clinical efficacy against schizophrenia and bipolar disorders with fewer side effects such as hallucinations and delusions (Worrel et al., Citation2000). These are also better than the typical analogs at relieving the negative symptoms of the illness, such as withdrawal, thinking problems, and lack of energy (Ayala et al., Citation2006). Olanzapine (OL) is one of the recent atypical antipsychotics that belongs to the thienobenzodiazepine-class(2-methyl-4-(4-methyl-1-piperazinyl)-10H-thieno-[2,3-b][1,5] benzodiazepine) (Ayala et al., Citation2006). It is widely used in the treatment of schizophrenia and acute mixed or manic episodes. It is highly efficient with no or minimal side effects such as weight gain and agranulocytosis being similar to the first line treatment such as clozapine (Volavka et al., Citation2004). However, OL exhibits very slight solubility in water and suffers from extensive first pass metabolism and, therefore, possesses low bioavailability (40%) after oral administration (Sood et al., Citation2013). Numerous trials were reported in the literature for improving bioavailability of OL using solid lipid nanoparticles or through formation of solid dispersions with various polymeric carriers (Krishnamoorthy et al., Citation2009; Harde et al., Citation2011; Cavallari et al., Citation2013; Sood et al., Citation2013).
Intraoral fast dissolving films (FDF) are non-bulky oral dosage forms that have several advantages over conventional oral dosage forms including the ease of administration with no need for water thus improving patient compliance particularly elderly and pediatrics. It also enables availability of larger surface area that leads to rapid disintegration and release of the drug into the oral cavity within seconds and hence a rapid onset of action could be achieved (Liang & Chen, Citation2001; Dixit & Puthli, Citation2009; Hoffmann et al., Citation2011). Owing to pregastric or oro-mucosal absorption, drugs can directly enter systemic circulation avoiding first-pass metabolism thus improving bioavailability with possibility of reduced dosing and fewer side effects (Saurabh et al., Citation2011). Many studies on orodispersible polymer films have been conducted for various reasons; as enhancing solubility of poorly soluble BCS class II drugs, taste masking of antihistamines, or increasing patient compliance for administration of antidepressant drugs (El-Setouhy & El-Malak, Citation2010; Preis et al., Citation2012; Sievens-Figueroa et al., Citation2012). Optimized formulations of orodispersible polymer films were also studied in the literature using simple methodologies such as solvent casting, hot-melt extrusion, and freeze drying (ElMeshad & El Hagrasy, 2011; Low et al., Citation2013; Kumria et al., Citation2016; Shamma & Elkasabgy, Citation2016). The aim of the current study was to improve the dissolution properties of the poorly water-soluble OL via formation of stable OL co-amorphous dispersions (COADs) from successful solid dispersions with some polycarboxylic acids (CAPs) (Ali et al., Citation2015). Solid dispersion method adjustment could result in co-amorphization of the active pharmaceutical ingredients using numerous coformers and many successful examples were employed in the pharmaceutical research for improving the physicochemical properties especially for poorly soluble drugs (Jensen et al., Citation2015; Qian et al., Citation2015). Co-milling and freeze drying with hydrophilic polymers were used to form amorphous glass solutions and hot-melt extrusion of drugs using mixtures of low-melting polymers and surfactants were also employed for co-amorphization (Zhang et al., Citation2014). Some di and tri-carboxylic acids have the ability to adjust the glass transition temperature of the composite solid dispersion by the antiplasticizing effects thus protecting the amorphous state of the resulting dispersion (Curtin et al., Citation2012). In this study, solvent evaporation under vacuum was used for the preparation of solid dispersions of OL and poly carboxylic acids followed by incorporation of successful co-amorphous dispersions into different film formulations, followed by incorporation in different film formulations. Modeling and optimization of the effects of film formulation parameters on its mechanical strength, disintegration, and dissolution properties were extensively studied using response surface models (Hosny et al., Citation2016). However, in this work, modeling was undertaken using artificial neural networks and genetic algorithms (Abdelrahman et al., Citation2015). Oral bioavailability and pharmacokinetics of OL from the optimized fast dissolving films (OFDF) were evaluated in human volunteers in comparison with marketed products of OL.
Materials and method
Materials
Olanzapine was obtained as a free sample from the Egyptian Pharmaceutical Industries Company (EPICO, Cairo, Egypt). Hydroxy propyl methyl cellulose (HPMC-E5) and sodium carboxy methyl cellulose (NaCMC) were purchased from Sigma-Aldrich, Darmstadt, Germany. Glycerol, menthol, propylene glycol, anhydrous carboxylic acids (CAPs); ascorbic acid, tartaric acid, and citric acid were purchased from Natco Pharma, Hyderabad, India. Ethanol (95%) and acetone were purchased from El-Gomhoria Company (Cairo, Egypt). Methanol HPLC grade was purchased from Sigma Aldrich, Gillingham, UK. Other chemicals were of analytical grade and were used as obtained.
Preparation of OL/carboxylic acid solid dispersions
Solid dispersion preparation was carried out using fast solvent evaporation under reduced pressure according to a reported method (Ali et al., Citation2015). The calculated equivalent amounts of anhydrous CAPs, ascorbic, citric and D-tartaric acid according to molar ratios (), were dissolved in ethanol 95% (10 mL). The weighted amounts of OL (200 mg) were dissolved in acetone (10 mL) and then mixed with the ethanolic solution of CAPs in a rotary evaporation flask. The flask contents were sonicated for 10 min in a water bath sonicator (Ultrasonic Cleaner Model 57 H, Ney Instruments Co. Ltd, Melville, NY) until all contents were completely dissolved. The resulting solution was evaporated under vacuum (0.25 MPa) using arotary evaporator (Barloworld Scientific Ltd., Stone, UK). The water bath temperature was kept at 50 °C. After complete dryness, the collected mass was pulverized and passed through sieve number 60 (250 μm apertures), then kept in a desiccator until further examination.
Table 1. Composition of OL-carboxylic acid solid dispersions.
Characterization of OL-carboxylic acid solid dispersions
Saturated solubility
Saturated solubility of the dispersions was measured by adding known excess amount of each formula to the dissolution medium (10 mL). The dispersion was kept in a shaking water bath (37 °C) for 24 h. The samples were taken out of the shaker and left aside for an extra 12 h to equilibrate then filtrated using membrane filter (0.45 μm, Millipore®, Billerica, MA). The filtrate was analyzed spectrophotometrically at λmax 273 nm (Seju et al., Citation2011).
Scanning electron microscopy (SEM)
The morphology of the prepared dispersions was examined using SEM (Analytical Scanning Microscope, JEOL-JSM-6510LA, JEOL, Tokyo, Japan). Few specks from each formulation were placed on the carbon stubs and then coated using a gold sputter (SPI-Module Sputter Coater, SPI Supplies Inc., West Chester, PA) followed by microscopical scanning.
Differential scanning calorimetry (DSC)
DSC analysis of pure OL, CAPs, physical mixtures, and the prepared dispersion formulations (5 mg) were carried out using DSC (TA-60WSI, Shimadzu, Tokyo, Japan). The instrument was calibrated using purified Indium (99.99%). Samples were sealed in a flat bottom aluminum pan (Shimadzu DSC-60, Tokyo, Japan). The pan was placed in the DSC instrument and scanned between 30 and 300 °C at a rate of 10 °C/min. Dry nitrogen was used as a carrier gas to eliminate the oxidative and pyrrolytic effects with a flow rate of 10 mL/min. The melting and transition point measurements were performed using the software provided with the device.
Fourier transform infrared analysis (FTIR)
Sample (5 mg) of OL, CAPs, and prepared dispersions were individually mixed with 100 mg dry potassium bromide. The powder mixtures were compressed into discs under a pressure of 10 000–15 000 PSI. The infrared spectrum was determined at a scanning range of 400–4000 cm−1 using a Fourier Transform Infrared instrument (IR435-U-04, Shimadzu, Kyoto, Japan).
X-ray diffraction (XRD)
Samples of OL powder, CAPs as well as the solid dispersion formulations were subjected to X-ray diffraction analysis using Shimadzu XRD-6000 X-ray powder diffractometer (XRD-610, Shimadzu, Tokyo, Japan). The equipment was coupled with a standard Cu sealed X-ray tube with 40 kV voltage and 30 mA current (Ali et al., Citation2015). Data collection was performed at 2θ 5–80° in steps of 0.05° and a scanning speed of 0.5 s per step.
Preparation of OL fast dissolving films (FDF)
Solvent casting method was adopted for the preparation of OL FDF using mixtures of the successful co-amorphous dispersions (COADs) with film-forming polymers, hydroxyl propyl methyl cellulose (HPMC) and sodium carboxy methyl cellulose (Na–CMC) as shown in . Glycerin, propylene glycol (PG), or PEG 400 were used as plasticizers, citric acid as saliva stimulant, Na-saccharine as sweetening agent, and menthol as flavoring agent. The film-forming polymer was dissolved in cold water then OL co-amorphous dispersion (COAD) was added in the required quantity. Menthol was dissolved in 1 mL ethanol, and then added to the aqueous dispersion. The mixture was kept under magnetic stirring at room temperature until complete dissolution. Before film casting, the aqueous solution was sonicated for 1 h to ensure complete removal of the entrapped air bubbles. To cast the film, the aqueous solution was poured into a dry clean Teflon plate and then kept in hot air oven at 60 °C for the first 30 min and then the temperature was decreased to 40 °C for the next 24 h (El-Setouhy & El-Malak, Citation2010). After complete drying, the films were peeled off carefully from the Teflon plates, wrapped in aluminum foil, and stored in airtight containers at room temperature until further investigations.
Table 2. Different formulation variables included into OL thin film.
Physicochemical evaluation of OL fast dissolving films
Physical appearance and weight variation
The appearances of the prepared films were evaluated by visual observation of transparency or opaqueness. Weight variation test was carried out by individually weighing 10 films of each formula then calculating the average compared with other formulations. The thickness of the film was measured using Vernier caliper micrometer (Shanghai Measuring and Cutting Tools Limited Company, Shanghai, China). The thickness was measured at five different locations (four corners and one at center) and the average was recorded.
Surface pH determination
A combined pH electrode was used for testing the surface pH of the film. The prepared film (4 cm2) was immersed in 2 mL distilled water at room temperature. The pH was measured by bringing the electrode in contact with the surface of the oral film (Kunte & Tandale, Citation2010). The experiments were performed in triplicate and the average was recorded.
Tensile strength
Tensile strength was determined using an apparatus fabricated in laboratory. Increased stress was applied to the point at which the strip specimen breaks (Felton et al., Citation2008). The prepared film strips with dimensions of 1 × 3 cm2 were fixed from both ends between two clamps. During measurement (n = 5), the strips were pulled at the top clamp by adding weights in pan till the film broke. The tensile strength represented by the weight in grams required to break the film was determined using the following equation (Yoon et al., Citation2012):
(1)
where F is the maximum load applied on the film in Newtons (N) and A is the original cross-sectional area measured in squared centimeter (cm2).
Folding endurance
This test was measured manually (n = 3) for the prepared FDF formulae, where the prepared film (4 cm2) was folded repeatedly at the same place for several times till visible cracks were developed. The folding endurance is expressed as the number of folds (number of times the film is folded at the same place) required to break the film or to develop visible cracks. This test was applied to check the ability of the sample to withstand folding and also it gives an estimation of film brittleness (Mishra & Gilhotra, Citation2008).
Drug content determination
Ten film pieces were used in this test, where 4 cm2 was cut and dissolved in stoppered flask containing 100 mL of 20 mM phosphate buffer pH 6.8. The contents were sonicated until complete dissolution of the film. One mL of the solution was filtered through Millipore filter (0.45 μm pore size) then introduced into 25 mL volumetric flask and completed to volume by the buffer solution. The absorbance of the solution was measured using UV–visible spectrophotometer at λmax of 273 nm.
In vitro disintegration and dissolution studies
The disintegration test was carried out using disintegration apparatus (Erweka, Milford, CT), where each one of the six films was placed in the tubes of the container and the cover disks were placed over it (Dahiya et al., Citation2009). The disintegration test of the film was carried out according to specifications of fast dissolving tablets reported in the United State Pharmacopeia (USP). To mimic the mouth saliva, 10 mM phosphate buffer pH 5.8 (900 mL) at 37 °C ± 0.5 °C was used as a disintegration medium and the time taken for complete disappearance of the film was measured in seconds.
The in vitro dissolution of OL from the investigated films (cut into 4 cm2 pieces equivalent to 5 mg OL) was tested by using USP dissolution tester, apparatus II (Hanson Research, Chatsworth, CA). The paddles were rotated at 50 rpm in 900 mL of 10 mM phosphate buffer pH 5.8 with a temperature of water bath kept at 37 ± 0.5 °C. Aliquots of 5 mL were withdrawn from the dissolution medium at pre-determined time intervals (1, 3, 5, 7, 10, 15, 20, 25, and 30 min) and then replaced with fresh medium. The samples were filtered through Millipore® filter (0.45 μm) and OL content was determined using UV spectrophotometer at λmax 273 nm using simulated salivary fluid (SSF) as blank. The dissolution profiles were plotted using average % OL released (n = 3) from FDF and crystalline OL.
Modeling and optimization of OFDF preparation
The data set of OL FDF composed of 24 records () based on different formulation variables was subjected to the modeling and optimization process. The inputs included polymer type, polymer concentration, plasticizer type, and concentration. The polymer types were coded with numerical values as follows: HPMC E5 (1) and NaCMC (2) while the plasticizer types were encoded as 3 for PG, 4 for PEG400, and 5 for Glycerol. The measured dependent variables included tensile strength (N/cm2), disintegration time (s), folding endurance, and percentage drug released after 10 min. Modeling and optimization of the data were carried out using artificial neural networks (ANNs)-Genetic algorithm software package (INForm V3.71, Intelligensys Ltd., London, UK) (Ali & Ali, Citation2013). The experimentally collected data set was divided into training records (80%), testing records (10%), and validation records (10%) for model training, testing, and model validation, respectively. Predictability of trained models was evaluated using the correlation coefficient (R2) values computed automatically during training, testing, and validation steps (EquationEquation (2)(2) ). High R2 values closer to unity indicate appropriate predictability of the trained model (Plumb et al., Citation2002):
(2)
where yi is the individual value of the dependent variable, yi is the predicted value from the model, and yi- is the mean of the dependent variable. In this formula, the numerator represents the sum of squares for the error term (SSE) and the denominator represents the total sum of variable is accounted for in the model. The artificial neural network structure I(4)–HL(3)–O(1) was used for model training (linking inputs and the out-put properties), with four nodes representing the input layer, three nodes in the hidden layer, and one node in the output layer. Trusted models should result in validation correlation R2 as high as those obtained during model training and testing. The root mean-squared errors (RMSE) were also calculated and compared with those of training and testing (Ali & Abdelrahim, Citation2014).
Table 3. Input and output film formulation variables used in the modeling and optimization process.
After developing of the predictive models for each property of the film, optimization was carried out by setting the desired range for each of the out-put properties into the model optimization screen and the desirability function was selected as “tent” in the model optimization window (Plumb et al., Citation2005). The desired minimum and maximum values for the out-put properties were assigned as follows: tensile strength (4–5 N/cm2), disintegration time (20–30 s), and percentage dissolved in 10 min (95–100%). The model generated solution represented a suggested optimized formula for the FDF which was then prepared, characterized, and the experimentally obtained properties were compared to those previously predicted by the model.
Accelerated stability testing
The optimized FDF formula obtained by the model was chosen for testing the physicochemical stability. First, the film was wrapped in butter paper as one layer and above which a second layer of aluminum foil was tightly applied. Samples of the optimized films were stored at 40 °C/75% RH for a period of 12 weeks (Akil et al., Citation2011; Farid et al., Citation2015). Periodically, samples were withdrawn at different predetermined time intervals (0, 1, 2, 4, 6, 9, and 12 weeks) and examined physically for any changes in color, appearance thickness, and surface pH as well as chemically for their drug content.
In vivo evaluation of OL film in human volunteers
This study was carried out to compare the pharmacokinetics of OL from the optimized fast dissolving film formulation (FDF) to the reference products: A (Olazine oral tablets, EIPICO, Cairo, Egypt) and product B (fast dissolving tablet Zyprexa® Velotab, Lilly, Indianapolis, IN). A single oral dose equivalent to 10 mg OL was given to the volunteers using randomized crossover design in three phases with 1 week washout period between phases. Nine healthy man volunteers aged between 23 and 34 years (median weight: 75 kg and median height: 183 cm) were chosen and divided into three groups each containing three volunteers. Health status of the volunteers was confirmed by complete medical history, physical examination, and laboratory analysis for complete hematological and biochemical examination. The subjects were instructed to take no other drugs for 1 week prior to and during the course of study. No consumption of nicotine was permitted 12 h before and 24 h after drug intake. Moreover, on each test day, coffee, tea, and cola beverages were withheld from subjects 12 h before the administration and till the blood sampling was completed. The protocol of the study was conducted according to Helsinky agreement protocol for human subjects and according to the requirements of the ethical committee of faculty of medicine, Assuit University, Assiut, Egypt. The OFDF and the references were administered orally to the volunteers after fasting overnight. Venous blood samples (5 mL) were collected into heparinized tubes at certain time intervals (0, 0.5, 1, 2, 3, 4, 6, 8, 12, and 24 h). Plasma was obtained by centrifugation at 3000 rpm (centrifuge R32, Bombay, India) for 10 min and then samples were stored at −20 °C until the time of analysis.
Chromatographic conditions
Plasma samples were analyzed using a sensitive, reproducible, and accurate LC-MS/MS method, developed, and validated before the study. The isocratic mobile phase consisted of methanol and 0.1% formic acid pH 4.3 (90:10 v/v), which was delivered at a flow rate of 0.2 mL/min into the mass spectrometer’s electrospray ionization chamber. Quantitation was achieved by LC-MS/MS detection in positive ion mode for both OL and atorvastatin using a QT mass detector (Matuszewski et al., Citation1998). The ion spray voltage was set at 3500 V. The common parameters: nebulizer N2 gas temperature: 350 °C, drying N2 gas flow: 200 ml/min, sheath gas pressure: 30 Arb, and auxiliary gas pressure: 5 Arb. The peak area of transition from the m/z 313.17 precursor ion to m/z 256.13, with an collision energy of 30 eV for OL and the m/z 559.39 precursor ion to m/z 440.27, with an collision energy of 20 eV for atorvastatin.
A calibration curve of OL in plasma was conducted in concentrations ranged from 0.1 to 30 ng/ml. A solvent extraction procedure was used. Human plasma samples (500 μL) and 50 μL of internal standard solution were placed in 10 mL glass tubes then vortexed for 15 s. Five mL methyl-ter-butyl ether was added and samples were then vortexed for 1 min. The tubes were then centrifuged for 5 min at 4000 rpm. The upper organic phases were then transferred to clean glass tubes and evaporated to dryness at 45 °C. Dry residues were dissolved in 150 μL of mobile phase and vortexed for 1 min to reconstitute residues, and 10 μL were injected using the autosampler.
Pharmacokinetic analysis
Pharmacokinetic parameters were calculated from plasma data using WinNonlin® (version 1.5, Scientific consulting, Inc., Cary, NC). Non-compartmental analysis was adopted for the calculation of the observed maximal drug concentration Cmax (ng/mL) and the time needed to reach this concentration tmax (h). The relative bioavailability was calculated from the 24 h area-under-the-plasma concentration versus time curve as shown in the following equation:
(3)
Statistical analysis of the data was undertaken using analysis of variance (ANOVA) test performed for the untransformed data for the pharmacokinetic parameters Cmax, tmax, AUC0–24, and t1/2 using the software SPSS 11.0 (SPSS Inc., Chicago, IL). The significance level was set at p value= 0.05.
Result and discussion
Characterization of the co-amorphous dispersions
Saturated solubility
All the tested COAD samples showed increased OL water solubility over the crystalline form (). The maximum solubility (602-folds) was observed with ascorbic acid at a molar ratio 1:2 (COAD2), so it was selected for performing further solid state analysis and formulation of the oral fast dissolving film.
Table 4. Saturated solubility of co-amorphous dispersions compared to pure OL.
Scanning electron microscopy
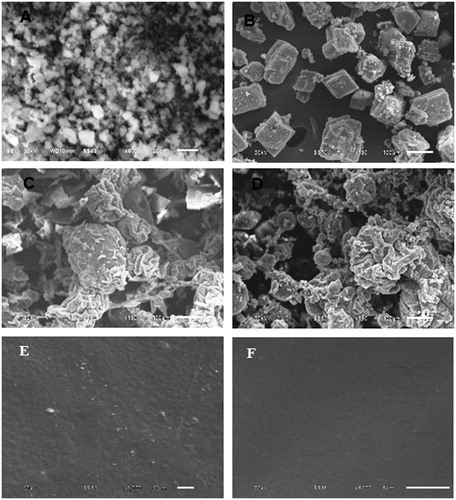
The results of SEM () indicated that large difference in size and shape existed between the crystalline OL and the ascorbic acid with smaller OL and larger cubic crystals of ascorbic acid (). The co-amorphous dispersions COAD1 and COAD2 demonstrated the characteristic amorphous aggregates and absence of the defined shape of crystals () The OFDF prepared from both dispersions showed almost clear, transparent glassy, and homogenous layer with completely dissolved OL into the polymer matrix ().
Figure 1. Scanning electron micrographs of pure olanzapine (A), its physical mixture with ascorbic acid (B), co-amorphous dispersion 1:1 (C), co-amorphous dispersion 1:2 (D), 1:1 film (E), and 1:2 film (F).
Differential scanning calorimetry
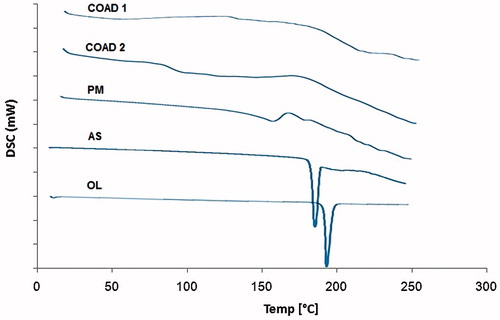
DSC thermograms of the drug, ascorbic acid, physical mixture, and solid dispersion systems are shown in . The thermogram of OL showed a highly crystalline component with a sharp endothermic peak at 194.01 °C (ΔH = 126.83 J/g) corresponding to its melting point. The thermogram of ascorbic acid also showed a melting endothermic peak at 191.24 °C. Physical mixtures showed broad endotherm without sharp melting indicating interactions and/or miscibility of the two components. Thermograms of the dispersions containing OL–ascorbic acid in molar ratios; 1:1 (COAD1)and 1:2 (COAD2), showed broad peaks with complete disappearance of the characteristic melting endotherms of parent components.
Figure 2. DSC thermograms for olanzapine (OL), ascorbic acid (As), (1:1) physical mixture (PM), and co-amorphous dispersions COAD 1 (1:1) and COAD 2 (1:2).
Fourier transform infra-red analysis
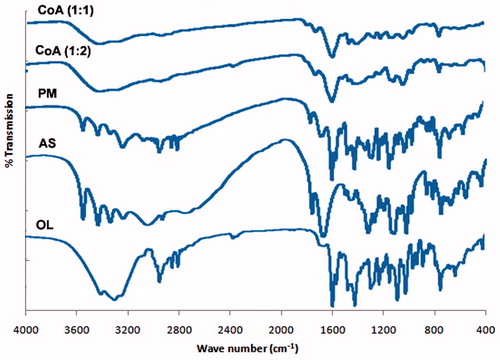
The FTIR spectra of OL, ascorbic acid, physical mixture (1:1), and solid dispersions are presented in . Pure OL showed characteristic absorption bands at 3217 cm−1 (NH stretching), 2929, 2836, and 2791 cm−1 (C–H stretching), 1586 cm−1 (C = C stretching), 1461 cm−1 (C = N stretching), and 1283 cm−1 C–N stretching.(Ayala et al., Citation2006; Hiriyanna et al., Citation2008) The FTIR spectra of ascorbic acid indicated a characteristic peak at 1754 cm−1 which is attributed to the C = O stretching vibration commonly observed for carboxyl groups (Zhang et al., Citation2015). The characteristic peaks of pure OL and ascorbic acid were found to be present in the spectra of the physical mixture; however, they were shorter than original components. The prepared solid dispersion formulations (COAD1 and COAD2) showed shortening, broadening, and shifting of certain peaks of OL.
Figure 3. IR spectra for olanzapine (OL), ascorbic acid (AS), their 1:1 physical mixture (PM), and co-amorphous dispersions COAD1 (1:1) and COAD2 (1:2).
X-ray diffraction
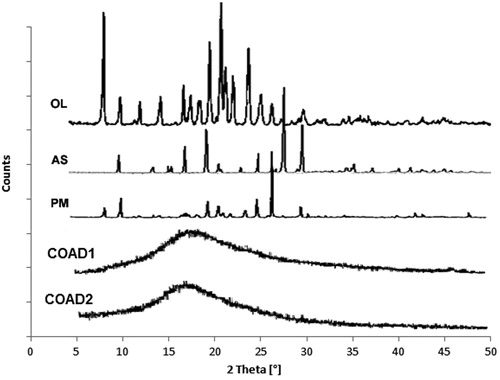
The diffraction spectrum of pure OL () showed highly crystalline component as demonstrated by the characteristic intense peaks at 2θ 8.67, 17.09, 19.87, 21.05, 21.54, and 23.95° which were identical to those reported in the literature (Tiwari et al., Citation2007). The XRD pattern for ascorbic acid also showed multiple sharp characteristic diffraction lines at 2θ 10.63, 15.89, 17.59, 25.33, 27.25, 28.19, 30.18, and 34.85° indicating a purely crystalline compound. The XRD spectra of the drug–ascorbic acid 1:1 physical mixture showed less intense spectrum compared with the parent components. The diffraction lines of the expected COADs demonstrated the disappearance of the characteristic peaks of both OL and ascorbic acid.
Figure 4. X-ray diffraction lines of olanzapine (OL), ascorbic acid (AS), 1:1 physical mixture (PM), 1:1 co-amorphous dispersion (COAD1), and 1:2 co-amorphous dispersion (COAD2).
Physicochemical evaluation of the prepared films
The prepared films were elegant, transparent, and flexible with smooth surface and showed no blooming. The measured average thickness of the films was 0.18 ± 0.02 mm. The surface pH of all prepared films was 5.90–6.90 which is in the range of salivary pH, hence no expected sensation of irritation to the oral cavity was found. The drug content values were in the range of 96.79–99.37% for the different formulations with standard deviation less than 2% indicating that the drug was uniformly dispersed throughout the film. The TS of the films was found to be in the ranged 2.41–7.08 N/cm2, which is considered adequate TS for handling and certain flexibility to guarantee patient compliance (Lim & Hoag, Citation2013). The results of folding endurance were found to be between 95 and 278 times, which could be considered relatively variable due to subject hand errors. The folding endurance was directly proportional to concentration of polymer and inversely to plasticizer concentration.
Assessment of in vitro disintegration and dissolution of the film
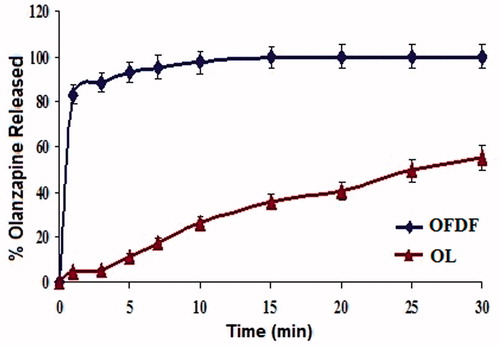
The disintegration time of the films was in the ranged of 4.00–51.00 s which is less than 1 min and considered acceptable time as reported in previous studies (Liew et al., Citation2012). It was clear that the time was increased as the polymer concentration increased. The in vitro dissolution profiles of OL from the optimized film in SSF (pH = 5.8) compared with OL powder are shown in . The optimized fast dissolving film achieved almost complete dissolution within 10 min compared with only 55.34% dissolved for those containing crystalline drug (30 min) which were also compatible with fast dissolving films reported in the literature (Vila et al., Citation2014). These results indicated that the COAD used to prepare the films greatly enhanced the extent and rate of dissolution of OL from the prepared OFDF. This enhancement was a result of the synchronized dissolution of OL and ascorbic acid brought about by the co-amorphous dispersion (Löbmann et al., Citation2011). The cumulative percentage of drug released after 10 min (Q10min) was evaluated among different films. The drug dissolution from all formulae decreased as the concentration of the polymer increased, this expected result was in agreement with the data reported in the literature for fast dissolving oral films (Scott et al., Citation2013).
Figure 5. Dissolution profiles of pure olanzapine (OL) compared with the optimized fast dissolving film (OFDF).
Modeling of film formulation
The relationships between film formulation variables and each of the output properties could be explained from the response surface plots shown in . The results of the modeling experiment indicated a highly trusted predictive model as confirmed by high training correlation R2 (92–99%), testing R2 (78–94%), and validation R2 (87–89.90%). The model trustability is also confirmed by the low values of the RMSE of training, testing, and validation data sets ( and ). The effects of polymer type and concentration on the film disintegration time demonstrated that polymer 1 (HPMC E15) resulted in lower disintegration time than polymer 2 (NaCMC). The time was also increased at higher concentration of polymers (200 mg) as shown in . The plasticizer type 4 (PEG 400) showed lowest values of disintegration time of the film compared with PG (type 3) and glycerin (type 5) and the time linearly decreased with increased plasticizer concentration (). For tensile strength, both polymer type and concentration were found to directly increase film tensile strength (). As previously noted with disintegration time, the tensile strength of the film had its lowest values with plasticizer 4 (PEG 400) as demonstrated by the large curvature of . It was also noticed that PG showed somewhat higher tensile strength than glycerin and the increased concentration of any of the plasticizers led to a direct decrease in film strength. On one hand, for, percentage OL released from the film, the relationship observed with polymer type indicated that HPMC E5 (type 1) resulted in higher % drug release than type 2 (NaCMC) as illustrated in . This could be due to the formation of stronger matrix layer with higher tortuosity and poor water porosity for diffusion of drug caused by more intimate contact between particles of HPMC at high concentration (Sapkal et al., Citation2011). Moreover, higher polymer concentration resulted in viscous environment of the system retarding water movement into the matrix and diffusion of the drug into the surroundings (Dunn & English, Citation2002). On the other hand, NaCMC has higher molecular weight than HPMC E5 which supports the formation of stronger matrix and lower release rates ().
Figure 6. 3D response surface plots showing effects of different input variables on film disintegration time (A and B), tensile strength (C and D), and % OL released (E and F).
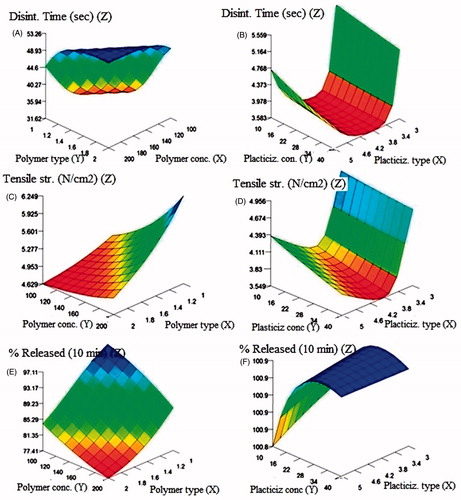
Table 5. Model training and testing ANOVA statistics for OL fast dissolving film output properties.
Table 6. Model validation ANOVA statistics for each output property.
Table 7. Model optimized solution for desirable film properties.
The type of plasticizer showed a slow increase in % drug released moving from plasticizer 3-4-5 (PG-PEG400-Gly) and the increased concentration of the three polymers led to a direct increase in % OL released up to a plasticizer concentration of 20–22% followed by a slow decrease possibly due to increased viscosity of the film matrix (). Folding endurance unfortunately did not result in a good model during preliminary model training most probably due to high variability and scatter of its values and hence was excluded from the final model.
Model optimization
The model-generated optimized formulation for OL film was composed of HPMC E5 or polymer 1 (178.01 mg) and PEG 400 or plasticizer type 4 (40 mg) as demonstrated in . The desirability of the obtained model exceeded 99% which represents high closeness of the obtained model predictions from the desired values entered during optimization. The experimental testing of the optimized formulation indicated similar properties to those predicted by the model. The actual tensile strength was found to be 4.93 N/cm2, the disintegration time was 8.52 (s), and the percentage OL released was 97.47(%), respectively. The difference between the actual and the model predicted properties was found to be statistically insignificant (p < 0.05) which ensured model trustability.
Table 8. Comparative pharmacokinetics following oral administration of OL film and reference formulations (products A and B) to human volunteers.
Accelerated stability studies
Fast dissolving films were found to be physically and chemically stable at the selected temperature and humidity (40 °C/75%RH) with no significant change in terms of physical characteristics and drug content (98.33%). The percentage OL remaining up to the end of the storage period (3 months) at the above-mentioned storage conditions was found to be within the USP-permitted values (90–110%) of the original content in the film (5 mg/4 cm2).
In vivo evaluation of the film
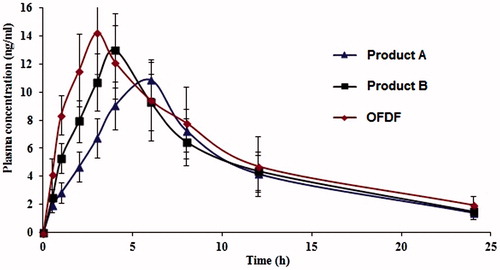
The mean plasma concentration–time curves of OL following oral administration of the optimized formula (OFDF), the oral generic product A, and the fast dissolving Product B tablets are shown in . Higher mean Cmax were obtained from the OFDF followed by product B and product A tablets. However, the differences between the three treatments for Cmax were found to be statistically insignificant (p < 0.05). The mean AUC0–24 h which reflects the total amount of drug absorbed over the 24 h time period was significantly higher for the fast dissolving film under test compared with the two reference formulations (). Shorter tmax was observed with the film followed by the references B and A tablets.
Figure 7. Plasma concentration versus time curves of olanzapine following oral administration of Olazine tablets (product A), Zyprexa® velotab (product B), and fast dissolving film (OFDF) to human volunteers.
Discussion
The use of ascorbic acid in the preparation solid dispersions and successful OL COAD systems was found to be useful in enhancing water solubility of OL by more than 600-folds which led to high dissolution and expected maximized absorption. This approach is considered a highly effective method usually used for the formation of cocrystals to improve solubility of poorly soluble drugs (McNamara et al., Citation2006). However, in this study, a co-amorphous dispersion was obtained at molar ratios of OL:ascorbic acid; 1:2 and 1:3 using rapid solvent evaporation under vacuum. The interaction between ascorbic acid and OL was effected most probably by H-bonding of the NH group of OL and the carbonyl group of ascorbic acid (Forster et al., Citation2001). In addition to its solubility enhancing effect in the prepared dispersions, ascorbic acid also is expected to provide antioxidant and neuroprotective effects to the final film formulation (Allahtavakoli et al., Citation2015; Xu et al., Citation2015).
The DSC results above confirmed the formation of homogenous single phases between OL and ascorbic acid through complete amorphization and absence of true melting endotherms. This complete miscibility between the two components at 1:1 and 1:2 molar ratios as indicated by the broad DSC thermograms of the dispersions () may suggest the formation of homogenous co-amorphous dispersions (Ali et al., Citation2015; Jensen et al., Citation2015).
From the IR data, it becomes obvious also that interactions between functional groups of OL and As acid have taken place. For example, the C–H stretching and C = N stretching were shortened and broadened and the shallow peak of N–H stretching also demonstrated shifting to 3394 cm−1 instead of 3217 cm−1 (). These results strongly suggest that the interaction between OL and ascorbic acid may have taken place through H-bonding (Mistry et al., Citation2015).
The XRD results () also confirm the interactions and formation of single homogenous phase by the appearance of the amorphous halo characteristic of single co-amorphous dispersions (Löbmann et al., Citation2013; Dengale et al., Citation2014).
The incorporation of OL–ascorbic acid co-amorphous dispersions in fast dissolving oral film was intended to provide a simple easily administered dosage form for the application inside the mouth. The formulated film was found to have acceptable transparent appearance and mechanical properties, disintegration, and dissolution. Almost complete dissolution from the film was attained within 10 min. Also, the drug was found to be stable in the film for up to 12 weeks at 40 °C and 75% RH which could be attributed to compatibility between polymers used in the film (PEG 400 and HPMC E5) and the COAD system. This increased phase stability possibly occurred through extending the supersaturation state (Kawakami, Citation2012).
From the above response surface plots, it could be concluded that HPMC E5 as the film forming polymer and PEG 400 as the plasticizer had the major effects on optimum film properties (tensile strength, disintegration time, and % OL released). Therefore, the model optimization resulted in a suggested formula with maximum dissolution and fast disintegration containing the above-mentioned polymers. This formula when tested for the actual properties was found to have the required disintegration, dissolution, and mechanical strength as those predicted by the model. The comparative pharmacokinetic evaluation of the film proved that formulation of OL in the form of OFDF using the co-amorphous phase was a successful strategy for enhancing the pharmacokinetic parameters. The higher Cmax, short tmax, and the improved bioavailability observed for OFDF relative to the commercially available formulations could be attributed to the rapid disintegration and dissolution of OL in saliva brought about by the COAD system incorporated into the optimized film leading to fast absorption.
Conclusion
The physicochemical properties of OL were highly improved using the principle of solid dispersion amorphization with a highly soluble coformer such as ascorbic acid. The results of solid state characterization of OL COADs indicated the formation of single homogenous phase through H-bonding interactions. This homogenous dispersion was further stabilized through incorporation with selected polymers to form a fast dissolving oral film. The optimized fast dissolving films were successful formulations which provided highly dissolving OL in a simple and easily administered dosage form for psychotic patients. The pharmacokinetics data indicated that the OFDF ensured improved bioavailability of OL compared with the marketed reference products. This can be attributed to faster dissolution leading to rapid absorption of OL from the buccal mucosa which undoubtedly resulted in a decreased pre-systemic biotransformation and maximized the bioavailability.
Acknowledgements
The authors of this manuscript acknowledge the help given by the technicians working at the central laboratory of Beni Suef University for help and support during use of the LC-MS and SEM equipment. Also, a special acknowledgment is directed to all members of the human research ethical committee at Faculty of medicine, Assiut University, Egypt. The human in vivo study performed in this research paper was undertaken according to the guidelines outlined in the Helsinki agreement for human research.
Declaration of interest
The authors report that they have no conflicts of interest
References
- Abdelrahman AA, Salem HF, Khallaf RA, Ali AMA. (2015). Modeling, optimization, and in vitro corneal permeation of chitosan–lomefloxacin HCl nanosuspension intended for ophthalmic delivery. J Pharm Innov 10:254–68
- Akil A, Parniak MA, Dezzutti CS, et al. (2011). Development and characterization of a vaginal film containing dapivirine, a non-nucleoside reverse transcriptase inhibitor (NNRTI), for prevention of HIV-1 sexual transmission. Drug Deliv Transl Res 1:209–22
- Ali AA, Ali AM. (2013). Optimization of propranolol HCl release kinetics from press coated sustained release tablets. Pharm Dev Technol 18:1238–46
- Ali AMA, Abdelrahim MEA. (2014). Modeling and optimization of terbutaline emitted from a dry powder inhaler and influence on systemic bioavailability using data mining technology. J Pharm Innov 9:38–47
- Ali AMA, Ali AA, Maghrabi IA. (2015). Clozapine–carboxylic acid plasticized co-amorphous dispersions: preparation, characterization and solution stability evaluation. Acta Pharm 65:133–46
- Allahtavakoli M, Amin F, Esmaeeli‐Nadimi A, et al. (2015). Ascorbic acid reduces the adverse effects of delayed administration of tissue plasminogen activator in a rat stroke model. Basic Clin Pharmacol Toxicol 117:335–9
- Ayala AP, Siesler H, Boese R, et al. (2006). Solid state characterization of olanzapine polymorphs using vibrational spectroscopy. Int J Pharm 326:69–79
- Cavallari C, Fini A, Ceschel G. (2013). Design of olanzapine/lutrol solid dispersions of improved stability and performances. Pharmaceutics 5:570–90
- Curtin V, Amharar Y, Hu Y, et al. (2012). Investigation of the capacity of low glass transition temperature excipients to minimize amorphization of sulfadimidine on comilling. Mol Pharm 10:386–96
- Dahiya M, Saha S, Shahiwala AF. (2009). A review on mouth dissolving films. Curr Drug Deliv 6:469–76
- Dengale SJ, Ranjan OP, Hussen SS, et al. (2014). Preparation and characterization of co-amorphous Ritonavir–Indomethacin systems by solvent evaporation technique: improved dissolution behavior and physical stability without evidence of intermolecular interactions. Eur J Pharm Sci 62:57–64
- Dixit R, Puthli S. (2009). Oral strip technology: overview and future potential. J Control Release 139:94–107
- Dunn RL, English JP. (2002). Biodegradable polymer composition, US Patent 20,020,090,398
- El-Setouhy DA, El-Malak NSA. (2010). Formulation of a novel tianeptine sodium orodispersible film. AAPS PharmSciTech 11:1018–25
- El Meshad AN, El Hagrasy AS. (2011). Characterization and optimization of orodispersible mosapride film formulations. AAPS PharmSciTech 12:1384–92
- Farid M, El-Setouhy DA, El-Nabarawi MA, El-Bayomi T. (2015). Particle engineering/different film approaches for earlier absorption of meloxicam. Drug Deliv. [Epub ahead of print]. doi: 10.3109/10717544.2014.982262
- Felton LA, Donnell PBO, McGinity JW. (2008). Mechanical properties of polymeric films prepared from aqueous dispersions. Drugs Pharm Sci 176:105
- Forster A, Hempenstall J, Rades T. (2001). Characterization of glass solutions of poorly water-soluble drugs produced by melt extrusion with hydrophilic amorphous polymers. J Pharm Pharmacol 53:303–15
- Harde H, Das M, Jain S. (2011). Solid lipid nanoparticles: an oral bioavailability enhancer vehicle. Expert Opin Drug Deliv 8:1407–24
- Hiriyanna S, Basavaiah K, Goud P, et al. (2008). Identification and characterization of olanzapine degradation products under oxidative stress conditions. Acta Chromatogr 20:81–93
- Hoffmann EM, Breitenbach A, Breitkreutz J. (2011). Advances in orodispersible films for drug delivery. Expert Opin Drug Deliv 8:299–316
- Hosny KM, El-Say KM, Ahmed OA. (2016). Optimized sildenafil citrate fast orodissolvable film: a promising formula for overcoming the barriers hindering erectile dysfunction treatment. Drug Deliv 23:355–61
- Jensen KT, Blaabjerg LI, Lenz E, et al. (2015). Preparation and characterization of spray-dried co-amorphous drug–amino acid salts. J Pharm Pharmacol. [Epub ahead of print]. doi: 10.1111/jphp.12458
- Jensen KT, Larsen FH, Cornett C, et al. (2015). Formation mechanism of coamorphous drug-amino acid mixtures. Mol Pharm 12:2484–92
- Kawakami K. (2012). Modification of physicochemical characteristics of active pharmaceutical ingredients and application of supersaturatable dosage forms for improving bioavailability of poorly absorbed drugs. Adv Drug Deliv Rev 64:480–95
- Krishnamoorthy V, Nagalingam A, Priya Ranjan Prasad V, et al. (2009). Characterization of olanzapine-solid dispersions. Iran J Pharmaceut Resh: IJPR 10:13–24
- Kumria R, Nair AB, Goomber G, Gupta S. (2016). Buccal films of prednisolone with enhanced bioavailability. Drug Deliv 23:471–8
- Kunte S, Tandale P. (2010). Fast dissolving strips: a novel approach for the delivery of verapamil. J Pharm Bioallied Sci 2:325–8
- Liang AC, Chen LlH. (2001). Fast-dissolving intraoral drug delivery systems. Expert Opin Ther Pat 11:981–6
- Liew KB, Tan YTF, Peh KK. (2012). Characterization of oral disintegrating film containing donepezil for Alzheimer disease. AAPS PharmSciTech 13:134–42
- Lim H, Hoag SW. (2013). Plasticizer effects on physical-mechanical properties of solvent cast Soluplus® films. AAPS PharmSciTech 14:903–10
- Löbmann K, Grohganz H, Laitinen R, et al. (2013). Amino acids as co-amorphous stabilizers for poorly water soluble drugs – Part 1: preparation, stability and dissolution enhancement. Eur J Pharm Biopharm 85:873–81
- Löbmann K, Laitinen R, Grohganz H, et al. (2011). Coamorphous drug systems: enhanced physical stability and dissolution rate of indomethacin and naproxen. Mol Pharm 8:1919–28
- Low AQJ, Parmentier J, Khong YM, et al. (2013). Effect of type and ratio of solubilising polymer on characteristics of hot-melt extruded orodispersible films. Int J Pharm 455:138–47
- Matuszewski B, Constanzer M, Chavez-Eng C. (1998). Matrix effect in quantitative LC/MS/MS analyses of biological fluids: a method for determination of finasteride in human plasma at picogram per milliliter concentrations. Anal Chem 70:882–9
- McNamara DP, Childs SL, Giordano J, et al. (2006). Use of a glutaric acid cocrystal to improve oral bioavailability of a low solubility API. Pharm Res 23:1888–97
- Mishra D, Gilhotra R. (2008). Design and characterization of bioadhesive in-situ gelling ocular inserts of gatifloxacin sesquihydrate. DARU J Pharm Sci 16:1–8
- Mistry P, Mohapatra S, Gopinath T, et al. (2015). Role of the strength of drug–polymer interactions on the molecular mobility and crystallization inhibition in ketoconazole solid dispersions. Mol Pharm 12:3339–50
- Plumb AP, Rowe RC, York P, Brown M. (2005). Optimisation of the predictive ability of artificial neural network (ANN) models: a comparison of three ANN programs and four classes of training algorithm. Eur J Pharm Sci 25:395–405
- Plumb AP, Rowe RC, York P, Doherty C. (2002). The effect of experimental design on the modeling of a tablet coating formulation using artificial neural networks. Eur J Pharm Sci 16:281–8
- Preis M, Pein M, Breitkreutz J. (2012). Development of a taste-masked orodispersible film containing dimenhydrinate. Pharmaceutics 4:551–62
- Qian S, Heng W, Wei Y, et al. (2015). Coamorphous lurasidone hydrochloride − saccharin with charge-assisted hydrogen bonding interaction shows improved physical stability and enhanced dissolution with pH-independent solubility behavior. Cryst Growth Des 15:2920–28
- Sapkal NP, Kilor VA, Daud AS, Bonde MN. (2011). Development of fast dissolving oral thin films of ambroxol hydrochloride: effect of formulation variables. J Adv Pharm Res 2:102–9
- Saurabh R, Malviya R, Sharma PK. (2011). Trends in buccal film: formulation characteristics, recent studies and patents. Eur J Appl Sci 3:93–101
- Scott RA, Park K, Panitch A. (2013). Water soluble polymer films for intravascular drug delivery of antithrombotic biomolecules. Eur J Pharm Biopharm 84:125–31
- Seju U, Kumar A, Sawant KK. (2011). Development and evaluation of olanzapine-loaded PLGA nanoparticles for nose-to-brain delivery: in vitro and in vivo studies. Acta Biomater 7:4169–76
- Shamma R, Elkasabgy N. (2016). Design of freeze-dried Soluplus/polyvinyl alcohol-based film for the oral delivery of an insoluble drug for the pediatric use. Drug Deliv 23:489–99
- Sievens-Figueroa L, Bhakay A, Jerez-Rozo JI, et al. (2012). Preparation and characterization of hydroxypropyl methyl cellulose films containing stable BCS Class II drug nanoparticles for pharmaceutical applications. Int J Pharm 423:496–508
- Sood S, Jawahar N, Jain K, et al. (2013). Olanzapine loaded cationic solid lipid nanoparticles for improved oral bioavailability. Curr Nanosci 9:26–34
- Tiwari M, Chawla G, Bansal AK. (2007). Quantification of olanzapine polymorphs using powder X-ray diffraction technique. J Pharm Biomed Anal 43:865–72
- Vila MM, Tardelli ER, Chaud MV, et al. (2014). Development of a buccal mucoadhesive film for fast dissolution: mathematical rationale, production and physicochemical characterization. Drug Deliv 21:530–9
- Volavka J, Czobor P, Sheitman B, et al. (2004). Clozapine, olanzapine, risperidone, and haloperidol in the treatment of patients with chronic schizophrenia and schizoaffective disorder. Focus 2:59–67
- Worrel JA, Marken PA, Beckman SE, Ruehter VL. (2000). Atypical antipsychotic agents: a critical review. Am J Health Syst Pharm 57:238–55
- Xu KX, Tao J, Zhang N, Wang JZ. (2015). Neuroprotective properties of vitamin C on equipotent anesthetic concentrations of desflurane, isoflurane, or sevoflurane in high fat diet fed neonatal mice. Int J Clin Exp Med 8:10444–58
- Yoon SD, Park MH, Byun HS. (2012). Mechanical and water barrier properties of starch/PVA composite films by adding nano-sized poly (methyl methacrylate-co-acrylamide) particles. Carbohydr Polym 87:676–86
- Zhang C, Dabbs DM, Liu LM, et al. (2015). Combined effects of functional groups, lattice defects, and edges in the infrared spectra of graphene oxide. J Phys Chem C 119:18167–76
- Zhang Y, Liu Y, Luo Y, et al. (2014). Extruded Soluplus/SIM as an oral delivery system: characterization, interactions, in vitro and in vivo evaluations. Drug Deliv. [Epub ahead of print]. doi: 10.3109/10717544.2014.960982