
Abstract
This study aimed to investigate the synergistic effect of trans-activator of transcription (Tat) and niosomes for the improvement of hypoglycemic activity of orally delivered human insulin. The elastic anionic niosomes composing of Tween 61/cholesterol/dicetyl phosphate/sodium cholate at 1:1:0.05:0.02 molar ratio loaded with insulin–Tat mixture (1:3 molar ratio) was prepared. Deformability of the elastic anionic niosomes decreased after loaded with the mixture of 1.35 times. For the in vitro release, the insulin (T10 = 4 h) loaded in the elastic anionic niosomes indicated the slower release rate than insulin in the mixture (T10 = 3 h) loaded in niosomes. At room temperature (30 ± 2 °C), the mixture loaded in elastic anionic niosomes was more chemical stable than the free mixture of 1.3, 1.4 and 1.7 times after stored for 4, 8 and 12 weeks, respectively. Oral administration in the alloxan-induced diabetic mice of the mixture loaded in elastic anionic niosomes with the insulin doses at 25, 50 and 100 IU/kg body weight indicated significant hypoglycemic activity with the percentage fasting blood glucose reduction of 1.95, 2.10 and 2.10 folds of the subcutaneous insulin injection at 12 h, respectively. This study has demonstrated the synergistic benefits of Tat and elastic anionic niosomes for improving the hypoglycemic activity of the orally delivered human insulin as well as the stability enhancement of human insulin when stored at high temperature. The results from this study can be further developed as an effective oral insulin delivery.
Introduction
Insulin, a polypeptide hormone, is essential for controlling the blood sugar level of the body. Administration of insulin is the most effective therapy for lowering the blood sugar level in diabetic mellitus patients (Snow, Citation2009). However, this therapy presently available only in an injection form and the dosage regimen of insulin often needs daily multiple injections. Some diabetic patients may not comply with this approach because of anxiety, inconvenience, needle phobia, pain, risk of infection and dermatologic reactions such as itching, swelling, and atrophy or hypertrophy of adipose tissue at the injection site (Snow, Citation2009). Various routes of administration have been widely investigated to be an alternative of insulin delivery (Heller et al., Citation2007; Khafagy et al., Citation2007). One of the interesting routes is an oral administration because it is convenient, non-invasive and patient-friendly. Moreover, insulin absorbed through the gut is delivered directly to liver, the major action site of insulin, by hepatic first-pass phenomenon. This can mimic the physiological fate of endogenous insulin which is transferred from pancreas to liver via hepatic portal system (Heller et al., Citation2007; Sabetsky & Ekblom, Citation2010). Nevertheless, insulin is degraded by the gastrointestinal enzymes and the absorption of insulin through gastrointestinal membrane is also limited by its hydrophilic macromolecular property (Heller et al., Citation2007; Khafagy et al., Citation2007). Several approaches have been proposed such as absorption enhancers, enzyme inhibitors, carrier-based delivery systems, including liposomes, niosomes, micro- and nano-particles to overcome these barriers for oral insulin delivery (Heller et al., Citation2007; Khafagy et al., Citation2007; Sabetsky & Ekblom, Citation2010). Recently, none of these approaches are in the clinical study.
Niosomes, which are non-ionic surfactant lamellar bilayer vesicles, can encapsulate both water and oil-soluble substances at the hydrophilic inner core and the hydrophobic bilayer membranes, respectively. Niosomes can serve as drug, cosmetic and plant extracts delivery systems. The advantages of substances when entrapped in niosomes are the increasing of stability and absorption, prolongation of therapeutic activity and decreasing of the unwanted effect or toxicity (Uchegbu & Vyas, Citation1998; Manosroi et al., Citation2005). Charged niosomes have been developed to enhance the entrapment efficiency of many ionized substances such as the peptide drugs which can display different charges according to their isoelectric point value (pI) and the pH of the environments (Junyaprasert et al., Citation2008; Manosroi et al., Citation2010b). Niosomes with highly elastic membrane have been reported to be capable of penetrating through the pores smaller than their diameters (Honeywell-Nguyen & Bouwstra, Citation2005; El Zaafarany et al., Citation2010; Manosroi et al., Citation2011a, 2013a).
In our previous study, insulin–Tat mixture with the molar ratio of 1:3 showed the highest hypoglycemic activity of insulin when administered orally in alloxan-induced diabetic mice (Manosroi et al., Citation2013b). Tat is a short peptide derived from a trans-activating transcriptional activator of human immunodeficiency virus type 1 (HIV-1) (Brooks et al., Citation2005). It is one of the well-studied cell-penetrating peptides. Tat is a group of short peptides sharing the ability of translocation across several biological membranes and can also carry various macromolecular cargoes such as proteins, antibodies, toxins, oligonucleotides, DNA, imaging agents and nanoparticles through membranes without affecting the activity of the cargoes (Gupta et al., Citation2005; Hansen et al., Citation2008; Fonseca et al., Citation2009; Koren et al., Citation2011). In this present study, the physical properties, chemical stability and hypoglycemic activity of the insulin–Tat mixture loaded in niosomes were investigated and evaluated for the oral delivery efficacy of this mixture.
Materials and methods
Materials
Chemicals
Human insulin (28.82 IU/mg) was provided from Boehringer Ingelheim Pharma GmbH in Germany. The synthesized Tat peptide (GRKKRRQRRRPPQRKC) purchased from Chengdu Kaijie Biopharm Co., Ltd., China and EMC microcollections GmbH, Germany. Polyoxyethylene sorbitan monostearate (Tween 61), cholesterol (Chol), dicetyl phosphate (DP), 2-mercaptoethanol and alloxan monohydrate were purchased from Sigma-Aldrich, Inc., St. Louis, MO. Sephadex G-50 was from GE Healthcare Bio-Sciences AB, Uppsala, Sweden. SulfoLink® coupling resin was from Pierce Biotechnology, Rockford, IL. Sodium cholate (NaC) was from HiMedia Laboratories Pvt. Ltd., India. Triton X-100 was purchased from Panreac Química S.L.U., Spain. Sodium acetate and trifluoroacetic acid (TFA) were from Merck KGaA, Germany. Chloroform, methanol, acetonitrile and glacial acetic acid were analytical grade from RCI Labscan in Thailand. FinetestTM strips and meter for the measurement of blood glucose level were from Government Pharmaceutical Organization (GPO), Thailand. All other reagents were of analytical grade.
Animals
Adult male ICR mice weighing between 25 and 40 g were from National Laboratory Animal Centre, Nakhon Pathom, Thailand. Mice were maintained under the standard condition for laboratory animal housing controlled at 24 ± 1 °C and humidity at 45–55% with the cycle of 12 h light and 12 h dark. Mice were fed with commercially available animal foods and allowed water ad libitum. All animal experiments were conducted in accordance with the directive 2010/63/EU and the guidelines for the care and use of laboratory animals of Chiang Mai University, Thailand. The date and number from the ethical committee of the Laboratory Animal Center, Chiang Mai University for the in vivo experiment were 15 December 2015 and 012/2558, respectively.
Methods
Preparation of the peptide solutions
The human insulin–Tat mixture was prepared according to the method previously described (Manosroi et al., Citation2013b). Briefly, human insulin and Tat were dissolved separately in 100 mM acetate buffer pH 4.0 by shaking with a vortex mixer until the clear solution was obtained. The solutions of human insulin and Tat were mixed together to obtain the 1:3 molar ratio mixture solution. The mixture was incubated at room temperature (30 ± 2 °C) for 1 h and kept at 4 °C until use.
Determination of the complex formation of insulin mixed with Tat
In order to investigate the molecular interaction between insulin and Tat in insulin–Tat mixtures, SulfoLink® coupling resin was used to immobilize the Tat molecule which the insulin interacted with Tat coupled on the resin could be separated by centrifugation. Two types of Tat (C-Tat (CYGRKKRRQRRR) and Tat-C (YGRKKRRQRRRC)) were used to investigate the effect of cystein position in Tat molecule on the molecular interaction with insulin. Coupling of Tat and resin was performed using 1 mg of Tat and 1 mL of SulfoLink® gel. The suspensions were equilibrated with 2 mL of phosphate-buffered solution (PBS) containing 0.05% sodium azide (pH 7.4).
To determine the interaction of insulin and the Tat-coupled resins, 0.5 ml of C-Tat- and Tat-C-coupled resin were diluted to 1 ml with PBS pH 7.4. Then, 100 μl of insulin solutions at various concentrations (0.0049, 0.0098, 0.0195, 0.0390, 0.0781, 0.1562, 0.3125, 0.6250 and 1.25 mg/ml) were mixed with 100 μl of the diluted Tat-coupled resin suspensions and incubated by gently shaking at room temperature (30 ± 2 °C) for 1 h. The incubated suspensions were then centrifuged at 25 000g for 5 min to separate the insulin interacted with the Tat-coupled resins and the non-interacted or free insulin dissolved in supernatants. The quantity of free insulin in supernatants was analyzed by the size exclusion high-performance liquid chromatography (HPLC) method. Briefly, 10 μl of the clear supernatants was injected into Superdex™ Peptide PC 3.2/30 column (GE Healthcare Europe GmbH, Freiburg, Germany) by using PBS (pH 7.4) as mobile phase. The HPLC was run with the flow rate of 0.15 ml/min and detected by UV detector at 214 nm. The peak area was calculated for the amount of human insulin by comparing with the insulin standard curve. In the control experiment, 2-mercaptoethanol was used instead of Tat to couple with SulfoLink® resin. The quantity of insulin in the supernatants was determined by comparing the peak area of insulin from HPLC chromatograms with the standard calibration curve. The amount of insulin interacted with Tat-coupled or 2-mercaptoethanol-coupled resin was the difference between the initial insulin and the free insulin in the supernatant. The percentage of the interacted insulin was calculated by comparing the interacted insulin with the initial insulin, according to the following equations:
Preparation of the blank and insulin or its mixture loaded in neutral and anionic elastic and non-elastic niosomes
The dried powder of blank niosomes (elastic and non-elastic neutral or anionic niosomes) was prepared by the freeze dried empty liposome method (Kikuchi et al., Citation1999). Non-elastic neutral niosomes (20 mM) were composed of Tween 61 and Chol at 1:1 molar ratio, whereas the non-elastic anionic niosomes (20 mM) were composed of Tween 61, Chol and DP at 1:1:0.05 molar ratio. A 0.02 molar ratio of NaC was added to the non-elastic niosomal compositions for the preparation of elastic neutral and elastic anionic niosomes. The niosomal compositions were dissolved in the mixture of chloroform and methanol at 1:1 volume ratio. The solvent was removed by a rotary evaporator (Rotavapor R-210, Büchi Labortechnik AG, Switzerland), and the resulting film was obtained and further dried by evacuation in a desiccator under reduced pressure for 12 h. The film was then rehydrated with distilled water followed by swirling the dispersion in a water bath at 45 °C for 30 min to obtain the niosomal dispersion. The dispersion was sonicated by a microtip probe sonicator (Vibra-CellTM, Sonics & Materials, Inc., Newtown, CT) at pulse on 3.0 s, pulse off 2.0 s and amplitude of 25% for 10 min and centrifuged at 4470g for 1 min to remove titanium particles. The supernatant was collected and lyophilized by a freeze-dryer (Alpha 1-2 LD, Martin Christ Gefriertrocknungsanlagen GmbH, Germany). The dried blank niosome powder was obtained and kept at 4 °C until use. The powder was reconstituted with the solution of insulin or Tat or the Tat and insulin–Tat mixture (1:3 molar ratio) and shaken with a vortex mixer until completely dispersed. The resulting dispersion was then sonicated by a microtip probe sonicator at 10 ± 2 °C in an ice-bath for 10 min and again centrifuged to remove the titanium particles. The 100 mM acetate buffer was used instead of the peptide solutions to prepare the corresponding blank niosomes.
Vesicular size and zeta-potential determination
The vesicular sizes and zeta-potential values of the niosomes were measured at 25 °C by a zetasizer (Nano ZS series, Malvern Instrument Ltd., UK). The vesicular size was determined by measuring the Brownian motion of the vesicles with the dynamic light scattering technique and the particle size was interpreted from the time-dependent correlation function on the scattered light intensity at the scattering angle of 173°. The zeta-potential value was obtained from electrophoretic mobility of vesicles using the combination of laser Doppler velocimetry and the phase analysis light scattering technique. The niosomal dispersions were diluted 10-fold in acetate buffer before the measurement.
Determination of the deformability index
Membrane elasticity of the vesicles (blank niosomes and niosomes loaded with insulin or insulin–Tat mixture) was determined in terms of deformability index (DI) by the extrusion method (van den Bergh et al., Citation2001; Manosroi et al., Citation2011a). Briefly, 5 ml of the niosomal dispersion was extruded through a polycarbonate membrane filter with a pore size of 50 nm in a stirred ultrafiltration cell (Millipore, Billerica, MA). The extrusion was performed under a constant pressure of 2.5 bars for 10 min. The extruded sample was weighed and measured for the vesicular size by the same above procedure. DI was then calculated by the following equation:
where j is the weight of the sample obtained from the extrusion through the membrane filter, ry is the size of the vesicles in the extruded sample and rp is the pore size of the membrane filter.
Determination of the entrapment efficiency
The amounts of human insulin and Tat entrapped in niosomes were determined by gel electrophoresis (Mini PROTEAN® Tetra Cell, Bio-Rad Laboratories, Herculues, CA) and gel documentation (Universal Hood, Bio-Rad Laboratories, Italy) (Manosroi et al., Citation2010b,2011a). The electrophoresis system was slightly modified from the acid-polyacrylamide gel electrophoresis (acid-PAGE) (Stoyanova, Citation2004). A 20% separating gel in the acetate buffer system at pH 4.0 was used. Gel was run at the constant voltage of 90 mV for 150 min and then stained with Coomassie® Brilliant Blue G-250. The non-entrapped free human insulin or Tat was moved down along the gel and can be determined by comparing with the bands of the standard human insulin or Tat. Human insulin or Tat entrapped in niosomes was not moved down along the gel, but still remained with niosomes at the site of sample loading. The bands density on the gel of human insulin or Tat was measured by gel documentation with Quantity One® 1-D analysis software (Bio-Rad Laboratories, USA). The entrapment efficiency of human insulin or Tat in niosomes was calculated according to the following equation:
where Dtotal is the band density of the total amount of human insulin or Tat initially loaded in niosomes, while Dfree is the band density of the non-entrapped or free human insulin or Tat.
In vitro release of insulin from the niosomes loaded with insulin or insulin–Tat mixture
Human insulin or human insulin–Tat mixture (1:3 molar ratio) loaded in elastic anionic niosomes was prepared as the same above procedure, and incubated at 37 ± 1 °C with continuous mixing. To investigate the release of insulin from the niosomes, an aliquot of the samples (1 mL) was withdrawn at the time intervals of 0, 1, 3 and 6 h after incubation. The withdrawn samples were loaded in Sephadex G-50 gel filtration column (2.0 cm × 25.0 cm) and eluted with 100 mM acetate buffer (pH 4.0) at the flow rate of 1.0 mL/min and the fractions of 5 ml each were collected by a fractional collector (Foxy R2; Teledyne Isco, Inc., Lincoln, NE). From each fraction, insulin content was measured by an UV spectrophotometer at 214 nm. Percentages of insulin released from the elastic anionic niosomes were calculated from the ratio of the unentrapped insulin content and the total insulin content multiplied by 100. T10 which was the time at the 10% of insulin at initial released from the niosomes was extrapolated and calculated from the plot between the percentages of insulin released and times.
Physical and chemical stability of insulin or insulin–Tat mixture loaded in niosomes
The physical stability of human insulin or the human insulin–Tat mixture loaded in elastic anionic niosomes was evaluated in comparing to the not loaded insulin and not loaded insulin–Tat mixture. The freshly prepared insulin–Tat mixture not loaded in niosomes or the mixture loaded in niosomes was put in transparent vials and kept at 5 ± 3 °C, room temperature (30 ± 2 °C) and 40 ± 2 °C for 4 weeks. At initial, 1, 2, 3 and 4 weeks after storage, the vesicular sizes and zeta-potential values of the samples were measured at 25 °C by a zetasizer in order to investigate the physical stability. For the chemical stability of insulin, at initial and 4, 8 and 12 weeks, the samples (free insulin–Tat mixture or the mixture loaded in elastic anionic niosomes) stored at 5 ± 3 °C, room temperature (30 ± 2 °C) and 40 ± 2 °C were withdrawn and added with 10% Triton X-100 solution to rupture the niosomal membrane (Manosroi et al., Citation2003), and the insulin contents were analyzed by HPLC (FinniganTM SpectraSYSTEMTM, Thermo Electron Corporation, Waltham, MA). The Selectosil C18 HPLC column was used with 5 μm particle size, 4.6 mm internal diameter × 250 mm length (Phenomenex, Torrance, CA). The gradient was performed by starting with the mobile phase A (0.065% TFA in distilled water) and followed by the mobile phase B (0.05% TFA in acetonitrile) at 7% and ended at 100% after 30 min, and then continued the mobile phase B at 100% for 10 min. The system was performed at room temperature (30 ± 2 °C) with the flow rate of 1 ml/min. The chromatogram was detected by a UV detector at 214 nm, and the peak area was calculated for the amount of insulin by comparing with the standard calibration curve. The percentages remaining of insulin at different time intervals and storage temperatures were determined.
The in vivo hypoglycemic activity determination
Diabetic induction in mice
The ICR mice were induced to be diabetes by alloxan injection (Rees & Alcolado, Citation2005; Srinivasan & Ramarao, Citation2007; Van Belle et al., Citation2009). After fasted overnight for 12 h but with water ad libitum, blood samples from mice were collected by a tail-tip puncture technique (Christensen et al., Citation2009) and the normal level of the blood glucose was checked by the FinetestTM strip and meter. Alloxan monohydrate (10 mg/ml) dissolved in cold normal saline was sterilized by filtration through a 0.2 μm cellulose acetate membrane filter (Sartorius Stedim Biotech GmbH, Germany). Mice were injected intraperitoneally with the sterile alloxan solution at the dose of 150 mg/kg body weight (BW) and the blood glucose level was determined after 3 days of the injection. Mice having the blood glucose level higher than 200 mg/dL were considered to be diabetic and used for the hypoglycemic activity study (Sun et al., Citation2008; Tanquilut et al., Citation2009; Manosroi et al., Citation2011b).
Hypoglycemic activity test
The diabetic mice were fasted overnight for 12 h before the experiment and continued until the end of the experiment, with water ad libitum. The samples were administrated orally with the same volume of 200 μl via an oral feeding tube (National Laboratory Animal Centre, Mahidol University, Thailand). The diabetic mice were randomly divided into 10 groups of 5–6 mice each. The doses of insulin or insulin–Tat mixture were used according to our previous report (Manosroi et al., 2013). Group 1 was subcutaneously injected with insulin (1 IU/kg BW). Group 2 was orally administered with 100 mM acetate buffer (pH4.0) at the volume of 200 μl. Group 3 was orally administered with insulin (50 IU/kg BW). Group 4 was orally administered with the insulin–Tat mixture (1:3 molar ratio) at the insulin dose of 50 IU/kg BW. Group 5 was orally administered with blank elastic anionic niosomes. Group 6 was orally administered with elastic anionic niosomes loaded with insulin (50 IU/kg BW). Group 7 was orally administered with elastic anionic niosomes loaded with Tat (3 molar or 1.89 mg/kg BW). Group 8 was orally administered with elastic anionic niosomes loaded with insulin–Tat mixture (1:3 molar ratio) at the insulin dose of 25 IU/kg BW. Group 9 was orally administered with elastic anionic niosomes loaded with human insulin–Tat mixture (1:3 molar ratio) at the insulin dose of 50 IU/kg BW. Group 10 was orally administered with elastic anionic niosomes loaded with human insulin:Tat mixture (1:3 molar ratio) at the insulin doses of 100 IU/kg BW. Group 1 was served as the reference group, whereas Groups 2 and 5 were the negative control groups. At initial and 1, 2, 4, 6 and 12 h after the treatment, the blood samples were taken from mice by cutting the tail-tip and letting a drop of the blood on the test strip. The blood glucose levels were analyzed by the FinetestTM strips and meter. The hypoglycemic activities in terms of percentage reduction of the blood glucose level at various time intervals were compared with an initial. Folds of hypoglycemic activity were also calculated by comparing the percentages of blood glucose reduction with the positive control at the same time intervals.
Statistical analysis
The data were expressed as mean ± standard deviation. The comparison of the means was analyzed by the one-way analysis of variance with post hoc test of multiple comparisons. Statistically significance was considered at the p values of less than 0.01 and 0.001.
Results and discussion
Complex formation of insulin mixed with Tat
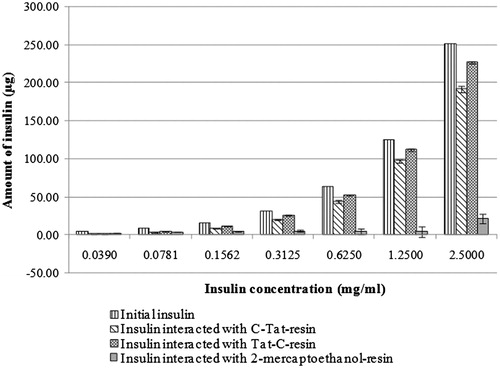
The amounts of insulin interacted with C-Tat-resin or Tat-C-resin or 2-mercaptoethanol-resin are shown in . The mixtures of insulin and Tat-coupled resins (both C-Tat-resin and Tat-C-resin) exhibited the amount of insulin interacted with the resin close to the initial amount of insulin, whereas the amount of insulin interacted with the resin was slightly observed in the mixtures of insulin and 2-mercaptoethanol-resin. This indicated that the high amount of insulin interacted with the Tat-coupled resins was not from the interaction between the insulin and the resin beads, but from the interaction between the insulin and the Tat coupled on the resin which the insulin interacted with the Tat-coupled resins can be separated from the non-reacted or free insulin by centrifugation. However, the amount of insulin interacted with the C-Tat-resin was close to that of the Tat-C-resin in each insulin concentration, indicating that the cysteine position in the amino acid sequence of Tat coupled on the resin (CYGRKKRRQRRR-resin or YGRKKRRQRRRC-resin) did not affect the interaction between insulin and Tat. This result confirmed the molecular interaction between insulin and Tat, that the insulin-Tat complexes might be formed when insulin was mixed with Tat.
Figure 1. Amounts of initial insulin and insulin interacted with C-Tat-resin or Tat-C-resin or 2-mercaptoethanol-resin.
Physical characteristics of niosomes
Both elastic and non-elastic neutral and anionic niosomes were in white powder after lyophilization and in white dispersion with no sedimentation after reconstitution. The vesicular size and zeta-potential value of all niosomes are given in . All blank niosomes exhibited the vesicular size range of 124.4 ± 0.7–206.0 ± 2.5 nm. After loaded with insulin and Tat, the vesicular sizes of niosomes were larger, especially the elastic and non-elastic anionic niosomes loaded with human insulin which exhibited the largest vesicular size of 1.23 ± 0.11 and 1.10 ± 0.03 μm, respectively. The larger vesicular sizes of elastic niosomes than the non-elastic niosomes were observed. This may be due to the intercalation of the edge activation sodium cholate (NaC) in the elastic niosomal composition, as well as the electrostatic repulsion of the negative charges between NaC and other negatively charged components in the elastic anionic niosomes (Persson et al., Citation2001; Manosroi et al., Citation2010a). After loaded with insulin, the charge interaction between the niosomal membrane and insulin may also affect the particle size of niosomes. In addition, aggregation resulting from the attraction of niosomes and insulin or the insulin–Tat complex may also cause the larger size of niosomes. On the contrary, the adsorption or entrapment of the positively charged peptides may neutralize the negatively charged membranes thereby reducing the repulsion of the anionic niosomal membrane resulting of the vesicular size reduction (Manosroi et al., Citation2010a,b). The zeta-potential of all niosomes was in the negative values. The elastic and non-elastic anionic blank niosomes gave the zeta-potential values of −17.9 ± 0.6 and −16.6 ± 0.9 mV, while the elastic and non-elastic neutral blank niosomes showed lower zeta-potential values of −2.5 ± 0.3 and −2.5 ± 0.2 mV, respectively. Zeta-potential of blank anionic niosomes decreased to between −4.5 ± 0.5 and −8.4 ± 0.6 mV when loaded with the peptides.
Table 1. Physical characteristics of elastic, non-elastic neutral and anionic niosomes loaded and not loaded with the peptides (insulin, Tat or the insulin–Tat mixture).
Elasticity of niosomes
The DI values of niosomes are given in . The elastic anionic niosomes gave the highest DI of 1.01 ± 0.27 which was 1.12, 2.81 and 11.22 times of the elastic neutral niosomes (0.90 ± 0.25), non-elastic neutral niosomes (0.36 ± 0.08) and non-elastic anionic niosomes (0.09 ± 0.15), respectively. The increase in vesicular elasticity might be resulted from the edge activator (NaC) which decreased the transition temperature (Tm) and induced the phase transition to liquid crystalline phase of the vesicles (El Maghraby et al., Citation2004; Manosroi et al., Citation2011a). However, the non-elastic niosomes also showed some elastic property owing to the Tween 61 component containing in niosomes that can also act as an edge activator (El Maghraby et al., Citation2004; Manosroi et al., Citation2011a).
For the effects of insulin or insulin–Tat mixture on the vesicular deformability after loading, the elastic anionic niosomes loaded with the insulin–Tat mixture showed the DI values of 8.4 ± 5.3 which were lower than the blank elastic anionic niosomes (11.3 ± 2.2) and the elastic anionic niosomes loaded with insulin (11.2 ± 4) of 1.35 and 1.33 times, respectively. However, the DI reduction of elastic anionic niosomes loaded with the insulin–Tat mixture was not significantly different compared with the elastic anionic niosomes loaded and not loaded with insulin. The charge interaction of insulin or insulin in the mixture and the edge activator (NaC) may be responsible for this deformability reduction effect.
Entrapment efficiency of human insulin–Tat mixture loaded in niosomes
The gel electrophoresis of niosomes loaded and not loaded with insulin–Tat mixture (1:3 molar ratio) is shown in . The entrapment efficiencies of insulin, Tat and the mixture of insulin and Tat in various niosomal formulations are given in . All insulin were entrapped in elastic and non-elastic anionic niosomes of 100%, while only some insulin was entrapped in elastic and non-elastic neutral niosomes with the entrapment efficiency of 37.0 ± 3.9% and 19.3 ± 1.8%, respectively. The band of Tat was found in all lanes of niosomes loaded with Tat exhibiting the entrapment efficiency between 29.6 ± 3.7% and 58.8 ± 1.4% (). Bands of insulin were found in all lanes of niosomes loaded with insulin–Tat mixture, except the lane of elastic anionic niosomes (), showing of no free insulin outside the niosomes. The elastic and non-elastic neutral niosomes and non-elastic anionic niosomes were entrapped with insulin of 7.0 ± 5.0%, 4.1 ± 2.7% and 87.9 ± 2.3%, respectively. Niosomes loaded with the mixture also gave the band of Tat demonstrating the entrapment efficiency between 2.2 ± 1.9% and 27.3 ± 6.4%. Thus, the entrapment efficiency of human insulin and Tat both in elastic and non-elastic anionic niosomes was much higher than in the neutral niosomes. Electrostatic interaction between the high negatively charged anionic niosomes and the positively charged of the peptides may enhance the entrapment efficiency (Manosroi et al., Citation2010a,b). Furthermore, elastic niosomes gave higher entrapment efficiency of insulin and Tat than the non-elastic niosomes. This might be due to the larger vesicular size of the elastic niosomes resulting from the incorporation of the edge activator, sodium cholate into the vesicular membrane (Brgles et al., Citation2008; Manosroi et al., Citation2011a). In our previous study, the elastic anionic niosomes loaded with insulin–Tat mixture also indicated low cytotoxicity in KB (human mouth epidermal carcinoma) and HT-29 (colon adenocarcinoma) cells (Manosroi et al., Citation2011a). Therefore, this niosomal system which indicated the highest elasticity and entrapment efficiency of insulin was selected for the further hypoglycemic activity study.
Figure 2. Gel electrophoresis of niosomes loaded and not loaded with human insulin-Tat mixture (1:3 molar ratio). Lane 1 = the standard human insulin. Lane 2 = human insulin-Tat mixture (1:3 molar ratio). Lane 3 = blank non-elastic neutral niosomes. Lane 4 = non-elastic neutral niosomes loaded with the mixture. Lane 5 = blank elastic neutral niosomes. Lane 6 = elastic neutral niosomes loaded with the mixture. Lane 7 = blank non-elastic anionic niosomes. Lane 8 = non-elastic anionic niosomes loaded with the mixture. Lane 9 = blank elastic anionic niosomes. Lane 10 = elastic anionic niosomes loaded with the mixture.
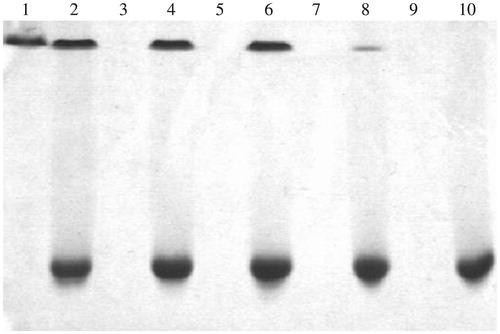
Table 2. Entrapment efficiency of the peptides (insulin, Tat or the insulin–Tat mixture) in elastic, non-elastic neutral and anionic niosomes.
In vitro release of insulin from the niosomes loaded with insulin or insulin–Tat mixture
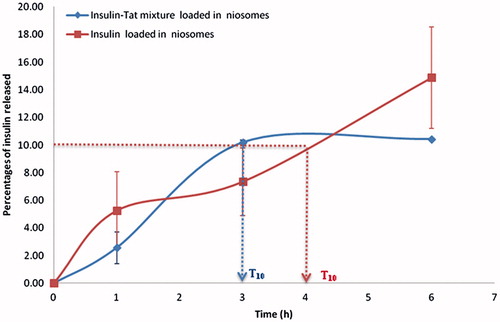
The in vitro release patterns of insulin from elastic anionic niosomes loaded with insulin or insulin–Tat mixture (1:3 molar ratio) are shown in . The release of insulin from the elastic anionic niosomes loaded with free insulin was slower than from the niosomes loaded with the mixture. After incubated for 1, 3 and 6 h, the percentages of insulin released from the mixture loaded in elastic anionic niosomes were 2.57 ± 1.15, 10.06 ± 0.18 and 10.42 ± 0.02, respectively, which were more than those released from the free insulin loaded in the elastic anionic niosomes (5.25 ± 2.82, 7.35 ± 2.45 and 14.88 ± 3.67, respectively). At T10 which was the time that 10% of insulin at initial released from the niosomes, the insulin–Tat mixture system gave the faster effect of 3 h which was 1 h less than that from the free insulin system (T10 = 4 h) (). This might be due to the charge interaction effect of the peptides and the niosomal membrane. For the insulin system, the positively charged insulin may interact and tightly bound with the negatively charged niosomal membrane, thereby delaying the release of insulin from the niosomes. Whereas for the mixture niosomal system, only some positively charged of both peptides (insulin and Tat) were bound to the niosomal membrane resulting being escaped of some unbound insulin from the niosomes. Therefore, before 3 h, time for the 10% release of insulin from the mixture niosomal system from the niosomes was longer than the free insulin niosomal system. In addition, the total amount of peptides in the mixture niosomal system was more than the free insulin niosomal system which may have more drive for the release of insulin from the niosomes, which agreed with the previous report (Sunil et al., Citation2006). However, beyond 3 h, the percentages of insulin released from the insulin–Tat mixture niosomal system were saturated at about 10% release, while those released from the free insulin niosomal system was still continuously increasing. This might be due to the steric hindrance effect from the Tat molecule in the mixture which may obstacle the release of insulin from the niosomes. Also, the more positively charges of the mixture system containing both positively charged insulin and Tat (pI of insulin is 5.3 and the pH of the system was 4.0) can interact with the negatively charged niosomal membrane more than the free insulin system which had only the positive charge of insulin.
Figure 3. The percentages of insulin released from the elastic anionic niosomes after incubated at 37 °C for 6 h.
Physical and chemical stability of human insulin in human insulin–Tat mixture (1:3 molar ratio) loaded in niosomes
Physical stability of insulin in the mixture loaded in niosomes compared with insulin loaded in niosomes and the mixture not loaded in niosomes after stored at 5 ± 3 °C, room temperature (30 ± 2 °C) and 40 ± 2 °C for 4 weeks is given in . At initial, the vesicular sizes and zeta-potential of blank elastic anionic niosomes and elastic anionic niosomes loaded with insulin or the insulin–Tat mixture were 172.4 ± 2.5, 228.1.20 ± 2.4, 567.6 ± 82.3 nm, and −17.9 ± 1.1, −16.7 ± 0.4, −4.7 ± 0.1 mV, respectively. After four weeks at all temperatures, the vesicular sizes were larger than at initial. The elastic anionic niosomes loaded with the insulin–Tat mixture gave the highest vesicular size of (1.06 ± 2) × 104 nm at 40 ± 2 °C. The vesicular sizes of the elastic anionic niosomes loaded and not loaded with insulin or the mixture increased with temperatures. This physical unstability may be due to the high energy at high temperature which may cause the agglomeration of the vesicles. The zeta-potential values of the elastic anionic niosomes loaded and not loaded with insulin or the insulin–Tat mixture were in the unstable range (not within ±30 mV) (Nutan & Reddy, Citation2009). Also, a significant decrease (p < 0.05) in zeta-potential of the elastic anionic niosomes loaded with insulin at 40 ± 2 °C and elastic anionic niosomes loaded with insulin–Tat mixture at all storage temperatures were observed. The elastic anionic niosomes loaded with the insulin–Tat mixture gave the lowest zeta-potential of |−0.6 ± 2| mV. This decreased zeta-potential might be due to the effect of the increasing size.
Table 3. Physical stability of elastic anionic niosomes loaded with human insulin–Tat mixture (1:3 molar ratio) or free insulin when stored at 5 ± 3 °C, room temperature (30 ± 2 °C) and 40 ± 2 °C for 4 weeks.
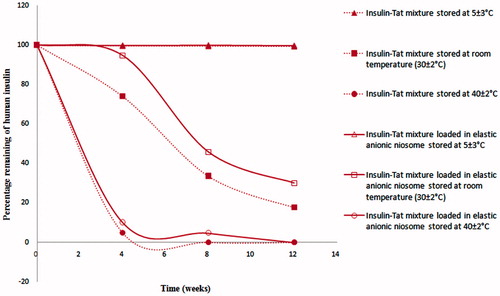
Chemical stability of insulin in the insulin–Tat mixture (1:3 molar ratio) loaded in elastic anionic niosomes was evaluated in comparing to the mixture not loaded in niosomes after stored at 5 ± 3 °C, room temperature (30 ± 2 °C) and 40 ± 2 °C for 12 weeks. The amounts of insulin in these systems were determined by HPLC at different time intervals after stored at 5 ± 3 °C, room temperature (30 ± 2 °C) and 40 ± 2 °C for 12 weeks. The percentages remaining of insulin at various conditions are presented in . As known, storage temperatures can have a strong effect on insulin stability resulting in its reduction of potency and pharmacological action especially at high temperature (Vimalavathini & Gitanjali, Citation2009). Amounts of insulin in the mixture or free insulin loaded and not loaded in elastic anionic niosomes decreased rapidly to only 10.1 ± 1.5% and 4.8 ± 0.7% when stored at 40 ± 2 °C for 4 weeks, respectively. This might be due to the increased fluidity and permeability of the vesicular membrane at high temperature resulting in the leakage of insulin from the vesicles (Ghanbarzadeh & Arami, Citation2013). However, the percentages remaining of human insulin in all systems were 99% when kept at 5 ± 3 °C for 12 weeks. At room temperature (30 ± 2 °C), the mixture loaded in elastic anionic niosomes exhibited a gradual reduction of the insulin amount at 94.6 ± 2.0%, 45.7 ± 2.1% and 30.0 ± 1.5%, which were higher than the mixture not loaded in niosomes which gave the remaining insulin of 74.0 ± 2.1%, 33.6 ± 0.6% and 17.7 ± 0.5% after 4, 8 and 12 weeks, respectively. Niosomes appeared to enhance the chemical stability of insulin from vigorous conditions during the preparation and storage at high temperature. This agreed with our previous study that the stability improvement of peptide can be obtained by loading in niosomes. Gallidermin (Gdm) loaded in niosomes was more chemically stable than Gdm in aqueous solution of about 1.5 times (Manosroi et al., Citation2010a). However, at the high storage temperatures, insulin in the insulin–Tat mixture loaded in elastic anionic niosomes appeared to be degraded more than at the low temperature after 12 weeks. This can certainly affect the in vivo hypoglycemic activity of the systems. Nevertheless, this problem can be solved by preparing the system in the dried solid forms which can be put in a capsule or compressed as tablets.
Figure 4. Percentages remaining of insulin in the insulin-Tat mixture (1:3 molar ratio) loaded and not loaded in elastic anionic niosomes when stored at 5 ± 3 °C, room temperature (30 ± 2 °C) and 40 ± 2 °C for 12 weeks.
Hypoglycemic activity of human insulin–Tat mixture loaded in elastic anionic niosomes
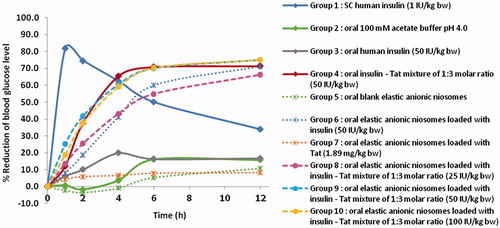
The plot of blood glucose reduction percentages versus times after administered the diabetic mice with various samples is presented in . No apparent hypoglycemic response was observed after oral administration of insulin at 50 IU/kg BW, while subcutaneous injection of insulin at 1 IU/kg BW gave significant hypoglycemic response with the highest blood glucose reduction percentages of 81.9 ± 1.6% at 1 h. This indicated that orally delivered of insulin was not absorbed from the gastrointestinal tract into blood circulation to obtain the hypoglycemic activity. Also, oral administration of Tat loaded in elastic anionic niosomes as well as the blank elastic anionic niosomes did not exhibit the hypoglycemic response. However, orally administered insulin–Tat mixture (1:3 molar ratio) at the insulin dose of 50 IU/kg BW or human insulin loaded in elastic anionic niosomes at the insulin dose of 50 IU/kg BW demonstrated significant hypoglycemic activity with the highest blood glucose reduction percentages of 71.3 ± 16.9% and 71.1 ± 9.7% at 12 h, respectively, which were 2.10 folds of the subcutaneous insulin injection. This indicated the potential of the synergistic effects of the co-administered of Tat with human insulin and loaded in elastic anionic niosomes. The absorption in the upper gastrointestinal tract of insulin is expected and appeared to be improved, thereby resulting the enhancement of the hypoglycemic effect. All three oral doses (25, 50 and 100 IU/kg BW) of insulin mixed with Tat at the 1:3 molar ratio loaded in elastic anionic niosomes, exhibited similar significant hypoglycemic activity with the blood glucose reduction percentages of 66.2 ± 8.5%, 74.9 ± 9.2% and 75.1 ± 6.5% (1.95, 2.10 and 2.10 folds of the subcutaneous insulin injection) at 12 h, respectively. The highest saturation hypoglycemic activity of insulin in this system may reach at 25 IU/kg BW. Interestingly, the human insulin–Tat mixture loaded in elastic anionic niosomes showed higher hypoglycemic response than the free mixture, and the free insulin loaded in elastic anionic niosomes. This demonstrated that Tat and the niosomal system may have the synergistic effect in facilitating the hypoglycemic activity of insulin by increasing the chemical stability of insulin and enhancing the absorption of insulin from the charge interaction between the positively charge of the insulin and the negatively charge of the mucous membrane in the upper gastrointestinal tract. Liang & Yang (Citation2005) have reported that the intestinal absorption efficiency of the linked Tat-insulin was 6–8 times more than the normal insulin on Caco-2 cell monolayer, a widely used in vitro model for intestinal absorption. Niosomes have also been shown to be stable in the solubilizing bile salt solution and can effectively prolong the release of insulin both in the simulated intestinal and gastric fluid (Pardakhty et al., Citation2007).
Figure 5. The blood glucose reduction percentages in alloxan-induced diabetic mice (n = 5–6) at various time intervals after treated with various insulin systems. SC, Subcutaneous injection.
Conclusion
Human insulin mixed with Tat at 1:3 molar ratio loaded in elastic anionic niosomes was investigated for physical and chemical stability as well as the oral hypoglycemic activity. This system gave the particle size of 567.6 ± 82.3, zeta-potential of −4.7 ± 0.1 mV and DI of 8.4 ± 5.3. The niosome formulations showed the physical unstability with the change of vesicular size and zeta-potential in the long-term storage. For the enhancement of the physical stability, the niosome formulations may be prepared as the lyophilized form and be reconstituted with acetate buffer prior to use or filled in a capsule or compressed as a tablet. The in vitro release of insulin from the free insulin loaded in elastic anionic niosomes (T10 = 4 h) was slower than insulin from the insulin–Tat mixture loaded in elastic anionic niosomes (T10 = 3 h) of 1.33 times. For physical and chemical stability, at 5 ± 3 °C, the percentages remaining of insulin were more than 99% after 12 weeks of both the insulin–Tat mixture loaded and not loaded in niosomes. At the high storage temperature (40 ± 2 °C), the mixture loaded in niosomes indicated better chemical stability of insulin than the free mixture loaded in niosomes. At the three oral doses of insulin (25, 50 and 100 IU/kg BW), insulin–Tat mixture loaded in elastic anionic niosomes exhibited similar significant hypoglycemic activity in diabetes mice with the highest blood glucose reduction percentages of 66.2 ± 8.5%, 74.9 ± 9.2% and 75.1 ± 6.5% (1.95, 2.10 and 2.10 folds of the subcutaneous insulin injection) after 12 h, respectively. This system showed the hypoglycemic response slightly higher than the free insulin–Tat mixture, and the insulin loaded in elastic anionic niosomes. This study has demonstrated that human insulin in the combination with Tat and elastic anionic niosomes can improve not only the chemical stability at high storage temperatures of insulin, but also the hypoglycemic activity of the orally delivered human insulin. The result from this study can be applied for the further development of an effective oral insulin delivery.
Declaration of interest
The authors are grateful to the financial support provided by the Thailand Research Fund (TRF) under the Royal Golden Jubilee Ph.D. (RGJ-Ph.D.) program and Research Administration Center, Chiang Mai University in Chiang Mai, Thailand.
References
- Brgles M, Jurašin D, Sikirić MD, et al. (2008). Entrapment of ovalbumin into liposomes – factors affecting entrapment efficiency, liposome size, and zeta potential. J Liposome Res 18:235–48
- Brooks H, Lebleu B, Vivès E. (2005). Tat peptide-mediated cellular delivery: back to basics. Adv Drug Deliv Rev 57:559–77
- Christensen SD, Mikkelsen LF, Fels JJ, et al. (2009). Quality of plasma sampled by different methods for multiple blood sampling in mice. Lab Anim 43:65–71
- El Maghraby GMM, Williams AC, Barry BW. (2004). Interactions of surfactants (edge activators) and skin penetration enhancers with liposomes. Int J Pharm 276:143–61
- El Zaafarany GM, Awad GAS, Holayel SM, Mortada ND. (2010). Role of edge activators and surface charge in developing ultradeformable vesicles with enhanced skin delivery. Int J Pharm 397:164–72
- Fonseca SB, Pereira MP, Kelley SO. (2009). Recent advances in the use of cell-penetrating peptides for medical and biological applications. Adv Drug Deliv Rev 61:953–64
- Ghanbarzadeh S, Arami S. (2013). Enhanced transdermal delivery of diclofenac sodium via conventional liposomes, ethosomes, and transfersomes. Biomed Res Int 2013:1–7
- Gupta B, Levchenko TS, Torchilin VP. (2005). Intracellular delivery of large molecules and small particles by cell-penetrating proteins and peptides. Adv Drug Deliv Rev 57:637–51
- Hansen M, Kilk K, Langel Ü. (2008). Predicting cell-penetrating peptides. Adv Drug Deliv Rev 60:572–9
- Heller S, Kozlovski P, Kurtzhals P. (2007). Insulin's 85th anniversary – an enduring medical miracle. Diabetes Res Clin Pract 78:149–58
- Honeywell-Nguyen PL, Bouwstra JA. (2005). Vesicles as a tool for transdermal and dermal delivery. Drug Discov Today Technol 2:67–74
- Junyaprasert V, Teeranachaideekul V, Supaperm T. (2008). Effect of charged and non-ionic membrane additives on physicochemical properties and stability of niosomes. AAPS Pharm Sci Tech 9:851–9
- Khafagy E-S, Morishita M, Onuki Y, Takayama K. (2007). Current challenges in non-invasive insulin delivery systems: a comparative review. Adv Drug Deliv Rev 59:1521–46
- Kikuchi H, Suzuki N, Ebihara K, et al. (1999). Gene delivery using liposome technology. J Controlled Release 62:269–77
- Koren E, Apte A, Sawant RR, et al. (2011). Cell-penetrating TAT peptide in drug delivery systems: proteolytic stability requirements. Drug Deliv 18:377–84
- Liang JF, Yang VC. (2005). Insulin-cell penetrating peptide hybrids with improved intestinal absorption efficiency. Biochem Biophys Res Commun 335:734–8
- Manosroi A, Khanrin P, Lohcharoenkal W, et al. (2010a). Transdermal absorption enhancement through rat skin of gallidermin loaded in niosomes. Int J Pharm 392:304–10
- Manosroi A, Khanrin P, Werner RG, et al. (2010b). Entrapment enhancement of peptide drugs in niosomes. J Microencapsulation 27:272–80
- Manosroi A, Wongtrakul P, Manosroi J, et al. (2003). Characterization of vesicles prepared with various non-ionic surfactants mixed with cholesterol. Colloids Surf B Biointerfaces 30:129–38
- Manosroi A, Wongtrakul P, Manosroi J, et al. (2005). The entrapment of kojic oleate in bilayer vesicles. Int J Pharm 298:13–25
- Manosroi J, Khositsuntiwong N, Manosroi W, et al. (2013a). Potent enhancement of transdermal absorption and stability of human tyrosinase plasmid (pAH7/Tyr) by Tat peptide and an entrapment in elastic cationic niosomes. Drug Deliv 20:10–18
- Manosroi J, Lohcharoenkal W, Götz F, et al. (2011a). Transdermal absorption enhancement of n-terminal Tat–GFP fusion protein (TG) loaded in novel low-toxic elastic anionic niosomes. J Pharm Sci 100:1525–34
- Manosroi J, Moses ZZ, Manosroi W, Manosroi A. (2011b). Hypoglycemic activity of Thai medicinal plants selected from the Thai/Lanna Medicinal Recipe Database MANOSROI II. J Ethnopharmacol 138:92–8
- Manosroi J, TangJai T, Werner RG, et al. (2013b). Potent and prolonged hypoglycemic activity of an oral insulin-Tat mixture in diabetic mice. Drug Res 63:1–6
- Nutan M, Reddy I. (2009). General principles of suspensions. In: Kulshreshtha A, Singh O, Wall G, eds. Pharmaceutical suspensions. London: Springer, 39–66
- Pardakhty A, Varshosaz J, Rouholamini A. (2007). In vitro study of polyoxyethylene alkyl ether niosomes for delivery of insulin. Int J Pharm 328:130–41
- Persson D, Thorén PEG, Nordén B. (2001). Penetratin-induced aggregation and subsequent dissociation of negatively charged phospholipid vesicles. FEBS Lett 505:307–12
- Rees DA, Alcolado JC. (2005). Animal models of diabetes mellitus. Diabetic Med 22:359–70
- Sabetsky V, Ekblom J. (2010). Insulin: a new era for an old hormone. Pharm Res 61:1–4
- Snow EK. (2009). AHFS drug information 2009. Bethesda, MD: American Society of Health – System Pharmacists
- Srinivasan K, Ramarao P. (2007). Animal models in type 2 diabetes research: an overview. Indian J Med Res 125:451–72
- Stoyanova SD. (2004). Acid-PAGE for evaluation of tobacco varieties by polymorphism of alcohol soluble proteins in seeds. Biotechnol Biotechnol Equip 18:68–73
- Sun J-E, Ao Z-H, Lu Z-M, et al. (2008). Antihyperglycemic and antilipidperoxidative effects of dry matter of culture broth of Inonotus obliquus in submerged culture on normal and alloxan-diabetes mice. J Ethnopharmacol 118:7–13
- Sunil AA, Sheetal SJ, Tejraj MA. (2006). Controlled release of cephalexin through gellan gum beads: Effect of formulation parameters on entrapment efficiency, size, and drug release. Eur J Pharm Biopharm 63:249–61
- Tanquilut NC, Tanquilut MRC, Estacio MAC, et al (2009). Hypoglycemic effect of Lagerstroemia speciosa (L.) Pers. on alloxan-induced diabetic mice. J Med Plants Res 3:1066–71
- Uchegbu IF, Vyas SP. (1998). Non-ionic surfactant based vesicles (niosomes) in drug delivery. Int J Pharm 172:33–70
- Van Belle TL, Taylor P, von Herrath MG. (2009). Mouse models for type 1 diabetes. Drug Discov Today Dis Models 6:41–5
- van den Bergh BAI, Wertz PW, Junginger HE, Bouwstra JA. (2001). Elasticity of vesicles assessed by electron spin resonance, electron microscopy and extrusion measurements. Int J Pharm 217:13–24
- Vimalavathini R, Gitanjali B. (2009). Effect of temperature on the potency & pharmacological action of insulin. Indian J Med Res 130:166–9