
Abstract
The current studies entail systematic development of self-nanoemulsifying drug delivery systems (SNEDDS) containing medium-chain triglycerides (MCTs) and long-chain triglycerides (LCTs) for augmenting the biopharmaceutical performance of artemether. Equilibrium solubility and pseudoternary phase diagram studies facilitated selection of Captex 355 and Ethyl oleate as MCTs and LCTs, and Cremophor RH 40 and Tween 80 as surfactants, while Transcutol HP as cosolvent for formulating the SNEDDS. Systematic optimization was performed employing the Box–Behnken design taking concentrations of lipid, surfactant and cosolvent as the critical material attributes (CMAs), while evaluating for globule size, emulsification time, dissolution efficiency and permeation as the critical quality attributes (CQAs). In situ single pass intestinal perfusion (SPIP) studies in Wistar rats substantiated significant augmentation in the absorption (5- to 6-fold) and permeation (4- to 5-fold) parameters from the optimized MCT and LCT-SNEDDS vis-à-vis the pure drug. In vivo pharmacodynamic studies in Plasmodium berghi infected laca mice exhibited superior reduction in the levels of percent parasitemia, SGOT, SGPT and bilirubin, followed by higher survival rate of the animals by optimized MCT-SNEDDS followed by LCT-SNEDDS vis-à-vis the pure drug, which was subsequently ratified through histopathological examination of liver tissues. Overall, the studies construed successful development of the optimized SNEDDS of artemether with distinctly improved biopharmaceutical and antimalarial potential.
Introduction
Artemether, a semi-synthetic derivative of artemisinin extracted from the plant Artemisia annua is primarily used for the treatment and management of malarial infections. Pharmacologically, it is a gametocidal agent found to be highly effective against malaria caused by multidrug-resistant Plasmodium falciparum (Tran et al., Citation1996; Van Hensbroek et al., Citation1996; Makanga, Citation2014). Being a BCS class II drug, it exhibits poor solubility and high lipophilicity (log p of 3.8), and undergoes extensive hepatic first-pass effect and metabolism by CYP3A4 isozymes, leading eventually to its low oral bioavailability (i.e., <45%) (Van Hensbroek et al., Citation1996; Grace et al., Citation1999). Multiple drug delivery systems like, micronization, solid dispersions (Shah & Mashru, Citation2008), inclusion complexes (Yang et al., Citation2009), complexation with hydrophilic polymers (Jain & Gupta, Citation2008) and supersaturable systems (Mandawgade et al., Citation2008) have been explored for enhancing the oral bioavailability of artemether, yet none of these formulations are considered to be highly satisfactory for enhancing the oral bioavailability ostensibly owing to their dissolution rate enhancement characteristics only.
Of late, the lipid-based self-nanoemulsifying drug delivery systems (SNEDDS) have proved their worth as one of the highly promising systems for ameliorating the oral bioavailability of drugs, especially belonging to the BCS class II and IV categories (Singh et al., Citation2011b; Beg et al., Citation2015a, 2015b). These primarily constitute the isotropic mixtures of lipids, surfactants, cosurfactants and/or cosolvents, which upon spontaneous emulsification in presence of gastrointestinal fluid produce ultrafine oil-in-water nanoemulsion with particle size less than 100 nm (Singh et al., Citation2009). Many literature reports have vouched the merits of SNEDDS in addressing the issues of low oral bioavailability of drugs, owing to its holistic approach for enhancing the solubility, circumventing the hepatic first-pass effect, increasing the intestinal permeability, inhibiting the P-glycoprotein (P-gp) efflux and potentiating drug absorption through intestinal lymphatic pathways (Porter & Charman, Citation2001a; Elgart et al., Citation2013; Singh et al., Citation2014; Beg et al., Citation2015b).
Several factors tend to influence the oral bioavailability enhancement potential of SNEDSS including the nature and type of lipids, surfactants and cosolvents employed for their formulation (Sharma et al., Citation2015). As lipids primarily offer solubilization of the drug in their selection of the type of lipids (i.e., mono/di/triglycerides) primarily influences the drug loading and in vivo absorption of the drugs (Singh et al., Citation2009; Elgart et al., Citation2013; Bandyopadhyay et al., Citation2014). On the other hand, the surfactants and cosolvents tend to impart drug solubilization and emulsification capacities to the formulations (Bandyopadhyay et al., Citation2012). Thus, the judicious selection of the lipidic and emulsifying agents is instrumental for accomplishing the desired biopharmaceutical performance of the drugs.
The commercially available lipidic excipients employed for formulation of SNEDDS primarily contains two types of lipids, namely medium-chain triglycerides (MCTs) and long-chain triglycerides (LCTs). MCTs chiefly consist of mixture of mono/diglycerides of fatty acids with lipid chain length ranging between C8 and C10, while LCTs majorly contain triglycerides with lipid chain length > C10 (Singh et al., Citation2009). Both the types of lipids tend to differ in their physiochemical properties, thus influencing their biopharmaceutical characteristics too. Literature reports suggest that the MCTs can directly facilitate transportation and absorption of the drugs through hepatic portal route into the systemic circulation, whereas the LCTs help in absorption of drugs via intestinal lymphatic pathways (Porter & Charman Citation2001a, 2001b). In this context, the LCTs are considered to be superior to the MCTs for formulating the SNEDDS owing to their enhanced oral bioavailability potential (Bandyopadhyay et al., Citation2012). However, it has also been reported that formulation of SNEDDS with more than 25% of MCTs can also favor preferential absorption of the drugs through lymphatic pathways (Murota et al., Citation2013).
Despite influence of the type of lipidic and emulsifying excipients for enhancing the oral bioavailability of drugs from the isotropic systems, identifying the rational combination of excipients helps in developing the impeccable formulations with robust performance (Bandyopadhyay et al., Citation2014; Keohane et al., Citation2015; Truong et al., Citation2015; Beg et al., Citation2015b). The said objectives can be accomplished by systematic optimization using Design of Experiments (DoE) established to be markedly superior over the traditional one-factor-at-a-time (OFAT) approach (Singh et al., Citation2005a). With minimal expenditure of time, effort and resources, DoE approach facilitates trading-off “the best” formulation using apt experimental designs (Singh et al., Citation2005a, 2005b, 2011a). Currently, as per the ICH Q8 guidance, DoE is considered as one of the pivotal tool for implementing Quality by Design (QbD) for attaining product and process understanding (Yu, Citation2008). The practical utility of QbD approach for development of diverse drug products has been demarcated in a series of literature reports (Singh et al., Citation2011a; Bandyopadhyay et al., Citation2012; Singh et al., Citation2013; Beg et al., Citation2015a).
The current research work, therefore, was undertaken for systematic development of SNEDDS of artemether employing both MCTs and LCTs, and comparative evaluation of their biopharmaceutical performance through in vitro drug release, ex vivo permeation, in situ perfusion and in vivo pharmacodynamic studies.
Experimental
Materials
Artemether was provided ex-gratis by M/s IPCA Laboratories Ltd., Mumbai, India. Labrafac PG, Labrasol and Transcutol HP (M/s Gattefosse, Saint-Priest, France); Cremophor EL and Cremophor RH40 (M/s BASF, Mumbai India); Capmul MCM, Captex 200, Captex 200P, Captex 355 and Capmul PG 8 (M/s Abitec Corp., Columbus, OH); ethyl oleate, olive oil and castor oil (M/s Loba Chemi, Mumbai, India); sesame oil and soyabean oil (M/s S.K. Oil Industries, Jalgaon, India); were all procured as gift samples from their respective sources. Giesma’s stain was purchased from M/s Himedia Ltd., Mumbai, India, while sodium lauryl sulfate was obtained from M/s RFCL, New Delhi, India. All other materials and chemicals used were of analytical reagent grade, and were used as received.
Equilibrium solubility studies
Equilibrium solubility studies on artemether were carried out in various MCTs (namely Capmul PG 8, Captex 300 EP/NF, Captex 200, Captex 355 and Capmul MCM), LCTs (namely oleic acid, ethyl oleate, olive oil and sesame oil), surfactants (namely Tween 20, Tween 40, Tween 80, Cremophor EL, Cremophor RH40) and cosolvent (namely Transcutol HP), employing shake flask method (Beg et al., Citation2013; Singh et al., Citation2013). Briefly, an excess amount of the drug was added to different vials containing 1.0 g of each of the excipients and vortexed for 2 min to obtain the homogenous mixture. All the mixtures were incubated in water bath shaker (M/s Rivotek, Mumbai, India), operated at 50 strokes/min and maintained at 37 ± 0.5 °C for 72 h. The resultant mixtures were centrifuged at 5000 rpm (1398 × g) for 5 min and the supernatant was diluted with methanol for estimating the solubilized fraction of artemether in the solubility samples by spectrophotometric method at 253 nm.
Construction of pseudoternary phase diagrams
The phase titration studies were carried out by water titration method for constructing the pseudoternary phase diagrams employing lipid and surfactant/co-surfactant mixtures (Smix) in the ratios ranging between 1:9 and 9:1 (Beg et al., Citation2012; Singh et al., Citation2013). The Smix ratio of 1:0, 1:1, 2:1 and 3:1 were explored to delineate the boundaries of nanoemulsion region (Negi et al., Citation2015). At each ratio, the mixtures were visually observed for different phases, i.e., micro/nanoemulsion, microgel, emulsion and emulgel, respectively. A completely transparent appearance of the liquid system was taken up as the micro/nanoemulsion, while its semisolid gel like consistency was taken up as the micro/nanogel. Likewise, a liquid with milky appearance was treated as an emulsion, while its semisolid form with gel like consistency was taken up as emulgel (Bandyopadhyay et al., Citation2014). The amount of water at which transparency‐to‐turbidity transition occurs was derived from the weight measurements, and the phase diagrams were plotted using PCP Disso software ver 3.0 (M/s Pune College of Pharmacy, Pune, India) (Sandhu et al., Citation2015). The pseudoternary phase diagrams depicting the highest micro/nanoemulsion region was demarcated by visual observation as well as by measuring the total area covered by the emulsification region in each phase diagram.
Preparation of the SNEDDS as per experimental design
The SNEDDS formulations were prepared by simple admixture method, where the drug was dissolved in the isotropic mixture of lipids (i.e., MCTs and LCTs), surfactant and cosolvent pre-melted at a temperature above the melting point of lipid (i.e., 50 °C), followed by mixing using a magnetic stirrer (M/s Perfit Instrument, Ambala, India) to obtain the homogeneous mass. In all the formulations, an accurately weighed amount of the drug (i.e., 40 mg) was employed for the purpose. A three-factor three-level Box-Behnken design (BBD) was employed for systematic optimization of MCT-SNEDDS and LCT-SNEDDS using the amount of lipids, surfactants and cosolvents as the factors. The levels for lipids, surfactant and cosolvent required for formulation of both MCT and LCT-SNEDDS were ascertained on the basis of nanoemulsion region formed in the pseudoternary phase diagrams. A total of 17 experimental trials with 40 mg of the drug in each were produced for both MCT and LCT-SNEDDS, which were characterized for CQAs, namely globule size, emulsification time, dissolution efficiency in 15 min (DE15min) and percent drug permeated in 45 min (%Perm45min).
Characterization of the SNEDDS
Globule size determination
Aliquots (1 mL) of the formulation were diluted 100-fold in distilled water, followed by gentle mixing. The resultant mixture was then subjected for globule size analysis by dynamic light scattering technique using Malvern Zetasizer ZS90 (M/s Malvern Instruments, Worcestershire, UK).
Emulsification time determination
The determination of emulsification time was carried out as per the previously reported method (Bandyopadhyay et al., Citation2012). Aliquots (1 mL) of the prepared SNEDDS were added to the distilled water (500 mL) under continuous stirring (50 rpm) condition in a USP XXXI Type II Apparatus (M/s Labindia, DS 8000, Mumbai, India), maintained at 37 ± 0.5 °C. The time required to obtain a completely uniform dispersion was recorded as the emulsification time.
In vitro drug release studies
In vitro drug release studies were carried out in triplicate for all the prepared formulations. The studies were performed by dialysis bag method in 250 mL of simulated gastric fluid (SGF) containing 0.5% sodium lauryl sulfate (SLS) at 50 rpm and 37 ± 0.5 °C for 3 h. The formulations containing drug (40 mg) were filled in the dialysis bags containing cellulose membrane with molecular cutoff weight of 12 kDa (M/s Himedia, Mumbai, India) and subjected for drug release studies. The corresponding blanks were also run simultaneously, keeping all the conditions identical except involving the drug per se. Aliquots (5 mL) of the medium were withdrawn periodically at periodic time intervals, namely 5, 10, 15, 20, 30, 60, 90, 120, 150 and 180 min, followed by replenishment with an equal volume of fresh dissolution medium. The samples after suitable dilution were derivatized with 1M methanolic hydrochloride and analyzed spectrophotometrically at λmax of 254 nm, taking as 320. Analogously the drug release studies were also carried out for the pure drug for comparative evaluation of the dissolution performance. The dissolution data analysis was performed using in-house developed ZOREL software with in-built provision for applying the correction factor for volume and drug losses during sampling (EquationEquation 1
(1) ) (Singh et al., Citation1997; Singh & Singh, Citation1998).
(1)
where Ci= corrected absorbance; Ai= absorbance of ith reading; Vs= sample volume; Vt = total volume of dissolution medium. The dissolution efficiency (DE) was calculated for each formulation employing the formula as given in EquationEquation (2)
(2) :
(2)
Ex vivo permeation studies using non-everted gut sac technique
Ex vivo permeation studies carried out using non-everted gut sac technique were in unisex Sprague-Dawley (SD) fasted rats (weighing between 250 and 350 g), abstained previously from the solid food at least 12 h prior to the study. An in-house assembly was fabricated for this technique and studies were conducted for each of the MCT and LCT-SNEDDS in triplicate (Bandyopadhyay et al., Citation2012; Beg et al., Citation2015b). The rats were sacrificed by cervical dislocation and the abdomen was incised midway, and the medial jejunum segment was excised out for the study. The segment was rinsed properly with Kreb’s Ringer Buffer (KRB) solution and placed immediately in the freshly prepared KRB solution at 37 ± 0.5 °C for continuous aeration. The intestinal segment was then stripped off the adhering tissue and washed again with KRB solution. The segment was ligated at one end with a thread to form a hollow sac with opening at the other end. A weight of one gram was tied to the closed end of the segment, fitted into the in-house fabricated assembly containing 50 mL of KRB, and continuously bubbled with atmospheric air at 10–15 bubbles per min. The weight was fixed to prevent peristaltic muscular contractions. The hollow gut sac was filled with 1 g weight of the SNEDDS formulation. An aliquot (2 mL) of drug solution was withdrawn at different time-points (i.e., 15, 30 and 45 min), followed by replenishment with an equal volume of fresh KRB solution. Further, the amount of artemether was determined by spectrophotometric method at 253 nm. The percent drug permeated was also calculated at specified time point of 45 min.
Optimization data analysis and validation studies
Based on the data obtained from the above studies, the multiple linear regression analysis (MLRA) was applied to fit the data to the second-order polynomial equation with added interaction terms to establish correlation between the CMAs with CQAs through Design Expert 9.0.1 software (M/s Stat-Ease, Minneapolis, MN). Only those coefficients, which were found to be highly significant using Student’s t-test, were considered in framing the polynomial equations. The response surface analysis was carried out employing 3D-response surface plots for understudying the factor–response relationship and plausible interaction(s) among them. Search for the optimum formulations was carried out by “trading-off” various CQAs by numerical optimization using desirability function, with the values of desirability closer to 1.
Validation of the experimental methodology was carried out by preparing seven formulations as the confirmatory check-points, including the optimized formulation. These check-point formulations were evaluated for various response variables, and the linear correlation plots and residual plots between the predicted and observed responses were constructed. The percent prediction error was also calculated with respect to the observed responses for ratifying the prognostic ability of the experimental methodology.
Characterization of the optimized SNEDDS formulation
Thermodynamic stability studies
The SNEDDS, diluted 100-folds with purified water, were subjected to thermodynamic stability studies in order to assess the phase separation, drug precipitation and/or stability of the nanoemulsion(s).
Centrifugation studies
The SNEDDS, after 100-fold dilution with purified water, were centrifuged at 5000 rpm (978 × g) for 30 min. The resultant formulations were then checked for any physical instability, such as phase separation, creaming or cracking.
Heating and cooling cycles
The SNEDDS formulations were subjected to six heating-cooling cycles, between 4 °C and 40 °C, for 48 h. The resultant formulations were assessed for any physical instability like precipitation and phase separation.
Freeze–thaw cycles
The SNEDDS formulations were subjected to four freeze–thaw cycles between −21 °C and 21 °C. Initially, the formulations were exposed at −21 °C in a deep-freezer for 24 h. Subsequently, the formulations were also thawed at 21 °C for 24 h and kept again in deep-freezer for the next cycle. The formulations were then observed for any physical change(s) such as phase separation and creaming.
Drug content
The drug content was determined by extraction of the drug from the SNEDDS formulations employing methanol. Approximately 1 g of the SNEDDS was dissolved in 100 mL of methanol and sonicated for 5 min using a probe sonicator. An aliquot (1 mL) of the medium was taken and analyzed by spectrophotometric method at 253 nm. The amount of drug present in the formulation was quantified from the previously constructed linear calibration plot of the artemether in methanol.
Rheological studies
Rheological studies on the optimized SNEDDS were performed using a rotational type rheometer (Rheolab QC, M/s Anton-Paar GmbH, Vienna, Austria) attached with DG26 spindle geometry for measuring the torque and viscosity of the sample, and a water jacket (C-LTD80/QC) for maintaining constant temperature of 25 °C. The optimized formulation was subjected to different shear stress and shear rate conditions and data analysis was carried out using Rheoplus/32 ver 3.40. (M/s Anton-Paar GmbH, Vienna, Austria).
Transmission electron microscopy (TEM)
The TEM images of the optimized SNEDDS formulations were obtained morphological characterization and visualization of emulsion droplets. The liquid oily formulation was diluted with deionized triple distilled water (1:100), followed by gentle mixing. A drop of sample obtained after dilution was placed on copper grids, stained with 1% phosphotungstic acid solution for 30 s, and finally kept under electron microscope (JEM-2100 F, M/s Jeol, Tokyo, Japan) to visualize the surface morphology.
In situ intestinal perfusion studies
The in situ intestinal perfusion studies were performed as per the procedure repeated in previous literature reports (Bandyopadhyay et al., Citation2012; Beg et al., Citation2015b). Unisex Sprague–Dawley rats (weighing between 250 and 350 g) were used during the SPIP studies. Animals were subjected to overnight fasting conditions and randomly assigned with different experimental groups, i.e., optimized MCT and LCT-SNEDDS and pure drug, respectively. Each group consisted of three animals and the experiments were carried out employing an in-house fabricated assembly. Anesthesia was induced by an intraperitoneal injection with thiopental sodium (50 mg/Kg dose) (Bandyopadhyay et al., Citation2012). After making an incision in the abdomen, the inlet and outlet were made at proximal part of the jejunum, 2–4 cm below the Ligament of Trietz, and about 10 cm distal to the first incision. Both the incised points were cannulated with polyethylene tubing and perfused with KRB solution (maintained at 37 ± 0.5 °C) at a perfusion rate of 0.2 mL min−1 with the help of an infusion pump. During the experiment, the rats were kept under a heating lamp and the exposed abdomen was covered with a saline-wetted cotton pad. After attaining the steady state at 30 min, various SNEDDS formulations (i.e., MCT-SNEDDS and LCT-SNEDDS) and pure drug (in 0.1% carboxymethyl cellulose), each containing artemether equivalent to 40 mg/kg of rat body weight were perfused and the perfusate was collected at regular time intervals of 15 minutes. Diethyl ether (4 mL) was added to each perfusate sample (1 mL) and the mixture was centrifuged at 5000 rpm (1398 × g) for 20 minutes. Following centrifugation, 3 mL of the supernatant ether fraction was collected and evaporated. Finally, 1.5 mL of perfusion solution was added to the ethereal extract and drug concentration in the mixture was determined employing the HPLC method, developed previously. Various permeability parameters like effective permeability (Peff), and wall permeability (Pwall), and absorption parameters like fraction absorbed (F) and absorption number (An), were subsequently calculated using EquationEquations (3–7) as follows (Beg et al., Citation2015b).
Peff was calculated using EquationEquation (3)(3) as follows:
(3)
where Q is the flow rate, Cin and Cout are the respective inlet and outlet concentration, r is the radius of the intestine, and l is the length of the intestine measured after completion of perfusion
Paq was calculated using EquationEquation (4)(4) as follows:
(4)
The factor is known as the Graetz number (Gz), which plays an important role in determining the dimensionless quantity A. Here, ∏ = mathematical constant, D = diffusion coefficient, l = length of the tube and Q = flow rate.
Further, diffusion coefficient (D) = 13.26*(10 −5)*(η−1.4)*(), where, η = viscosity of water, Va= mol. wt of drug/density of drug.
0.004 ≤ Gz ≤ 0.01 then A= 10.0Gz +1.01,
0.01 ≤ Gz ≤ 0.03 then A= 4.5 Gz +1.065;
0.03 ≤ Gz then A = 2.5 Gz + 1.125
Pwall was calculated using EquationEquation (5)(5) as follows:
(5)
The fraction of dose absorbed (Fa) was calculated by radial mixing model using Equation Equation(6)(6) as follows:
(6)
Dimensionless absorption number (An) was computed as the ratio of the fundamental mass transfer process affecting drug removal from intestine using Equation Equation(7)(7) as follows:
(7)
Here, SF is a scaling factor of 1.27 for complete radial mixing model.
In vivo pharmacodynamic studies
The in vivo pharmacodynamic studies were carried out on healthy female laca mice for 30 days as per the Peter’s four-day suppression test (Peters, Citation1975). Forty nine mice were randomly divided into 7 groups with 7 mice in each group. The animals in Group I were considered as naïve group (i.e., no disease and no treatment), Group II was marked as control group (i.e., disease induced, but no treatment given) with administration of normal saline only; while in the animals in Group III to VII were marked as the treatment groups (i.e., disease-induced and treatment group), with animals administered with optimized MCT and LCT-SNEDDS, and pure drug, all containing 40 mg/kg dose of artemether, respectively. Except the naïve group, each of the animals in different groups were induced with malaria by intraperitoneal injection of donor mouse blood infected with lethal ANKA strain of Plasmodium berghi, diluted in acid citrate buffer, containing 1 × 10⁶ infected RBCs on day ‘0’. Also, treatment was given from day “0” to day “4” to all the animals in the treatment groups (Group III to VII), followed by assessment of various parameters for evaluation of the malarial infection. Percent parasitemia counts were also observed post-inoculation of the P. berghi on day ‘2, 4, 6, 8, 10, 12, 14, 16, 18 and 20’, respectively. Parasite count was performed by making thin smear of the blood collected from the tail vein on microscopic slides, followed by staining with Giesma stain. The smears were counted for the number of infected RBCs per 1000 RBCs using an oil immersion microscope. Also alteration in the levels of liver biomarkers like, serum glutamic oxaloacetic transaminase (SGOT), serum glutamic pyruvic transaminase (SGPT) and bilirubin were estimated at intermittent time periods on day 4, 8, 12, 16 and 20, from the blood samples using diagnostic biomedical kit (M/s ERBA diagnostics, Mannheim GmbH, Germany). The ordinal score for percent parasitemia, SGOT, SGPT and bilirubin levels were assigned and statistically analyzed using Friedman test (i.e., a two-way nonparametric ANOVA) using GraphPad prism software ver 5.0.2, in order to test the significant difference among the treatment groups.
Accelerated stability studies
The stability studies on the optimized SNEDDS formulations were performed by filing the same in hard gelatin capsules (size 00) and storing them in stability chamber (M/s Thermolab, Maharashtra, India) at 40 ± 2 °C/75% ± 5% RH, as per the ICH Q1A(R2) guidelines. The formulations kept in air-tight glass vials were assayed periodically at 0, 1, 3 and 6 months, for Temul, Dnm, DE15min, % transmittance, viscosity and drug content, respectively. In vitro drug release studies were also carried out and similarity factor (f2) was computed for identifying any significant change(s) in the dissolution profiles.
Results and discussion
Equilibrium solubility studies
illustrates the equilibrium solubility data of artemether in various MCTs and LCTs. Among the various MCTs employed, the highest solubility of the drug was observed in Captex 355 (i.e., 408.8 ± 20.52 mg/mL), while among the LCTs, ethyl oleate (i.e., 287.6 ± 15.22 mg/mL) showed highest drug solubilization capacity. Likewise, among the surfactants and cosolvents employed, Cremophor RH40 (i.e., 138.2 ± 12.41 mg/mL), Tween 80 (i.e., 193.8 ± 16.88 mg/mL) and Transcutol HP (i.e., 306.7 ± 19.79 mg/mL) exhibited highest solubilization capacity and spontaneity of the emulsification ability. Higher solubility of the drug in MCTs than in the LCTs can be attributed to the shorter chain length of the former lipids, which provide ease of solubilization of the drug, plausibly owing to higher surface area (Shah et al., Citation1994). Besides, the higher solubility of the drug in nonionic surfactants can be explained as a function of their lower HLB value, which favors faster solubilization of the lipophilic drugs and imparts spontaneous emulsification ability (Truong et al., Citation2015). The presence of cosolvent additionally helped in improving the solubility of drug by their solubilization capacity owing to the presence of long-chain fatty alcohols (Mullertz et al., Citation2010).
Table 1. Solubility of drug in various lipids and surfactants.
Construction of pseudoternary phase diagrams
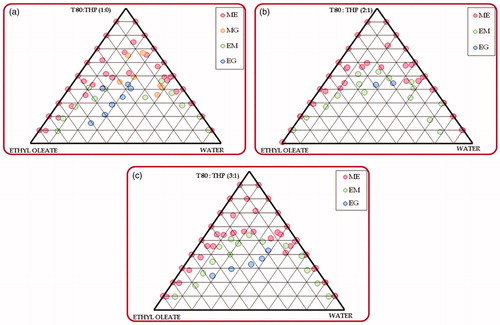
) illustrates the pseudoternary phase diagrams constructed for delineating the suitable nanoemulsion region for the MCT-SNEDDS, indicating higher area for microemulsion region for Captex 355 and Smix ratio of 1:0 containing Cremophor RH40-Transcutol HP. However, the formation of microgel region in the phase diagram during water titration was found to be quite undesirable in this case. On the contrary, addition of Transcutol HP shows increase in the nanoemulsion region, followed by disappearance of the microgel region. The studies were also conducted for exploring the effect of increase in the amount of Cremophor RH40 in the Smix ratio of 1:1, 2:1 and 3:1 revealed further increase in the nanoemulsion region in 1:1 and 2:1 ratios, followed by a reduction in the ratio of 3:1 (). This can be attributed to the nonionic nature of the Cremophor RH40, which undergoes precipitation of the polyoxyethylene chains upon coming in contact with Transcutol HP during phase titration studies (Narang et al., Citation2007). Analogously, the pseudoternary phase titration studies conducted for identifying the apt ratio of ethyl oleate, Tween 80 and Transcutol HP for formulating the LCT-SNEDDS also revealed identical observations (), where the 2:1 ratio exhibited the highest area for nanoemulsion region without formation of any microgel region (). The increase in the ratio of cosolvent (i.e., Transcutol HP), however, shows drastic reduction in the nanoemulsion region, as is evident from ). This can be explained owing to the lower HLB value (i.e., 4.2) of Transcutol HP, which reduces emulsification efficiency for forming oil-in-water microemulsion (Narang et al., Citation2007). In a nutshell, among the various combinations of lipid and emulsifying agents explored, the ratios of 1:1 and 2:1 were selected for formulation optimization studies of MCT and LCT-SNEDDS, respectively.
Figure 1. Phase behavior of microemulsion formed from Captex 355 with Cremophor RH40: Transcutol HP and water varying Cremophor RH40: Transcutol HP ratio, i.e., (a) 1:0 (b) 3:1 (c) 2:1 (d) 1:1; (CR RH40 – Cremophor RH40; THP – Transcutol HP).
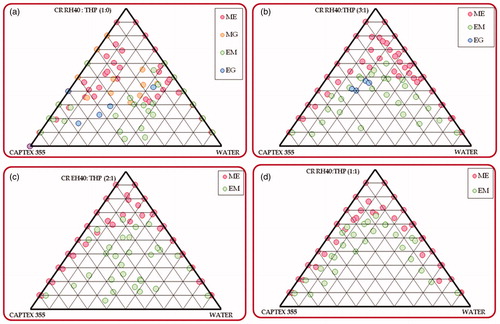
Figure 2. Phase behavior of microemulsion formed from ethyl oleate with Tween 80: Transcutol HP and water varying Tween 80: Transcutol HP ratio as (a) 1:0; (b) 2:1; (c) 3:1 (T80 – Tween 80; THP – Transcutol HP).
Mathematical model development and optimization data analysis
and portray the data for each CQA obtained for the MCT and LCT-SNEDDS formulations developed as per the experimental design. Mathematical data analysis was carried out by fitting the obtained data to the second order quadratic model by MLRA. The coefficients of the model equations generated for each of the CQA (EquationEquation (8)(8) ) revealed excellent goodness of fit of the experimental data to the model selected for MCT and LCT-SNEDDS, as was quite evident from the high values of r2 ranging between 0.907 and 0.997 (p < 0.001 in all the cases), insignificant lack of fit, and low values of PRESS.
(8)
where, Y represents the CQAs; β0 indicates the intercept of the developed polynomial equation; β1 to β3 are the coefficients of linear model terms; β4 to β6 are the coefficients of linear interaction terms; β7 to β9 are the coefficients of quadratic model terms, β10 to β11 are the coefficients of quadratic interaction terms for the factors employed during the optimization. The response surface analysis was carried out for evaluating the effect of various selected excipients on the CAQs of both MCT and LCT SNEDDS. Supplementary data text, Section 1.1 and 1.2 explicitly describes the response surface analysis both for MCT and LCT SNEDDS, respectively.
Table 2. Physical and dissolution parameters for all seventeen MCT-SNEDDS formulations prepared as per the BBD.
Table 3. Physical and dissolution parameters for all seventeen LCT-SNEDDS formulations prepared as per the BBD[TQ2].
Search for the optimum formulation and validation studies
Search for optimum formulation was carried out by “trading-off” various responses for both MCT and LCT-SNEDDS, where the earnest attempts were made to attain the goals like minimization of globule size and emulsification time (i.e., necessary for faster solubilization and absorption of drugs), maximization of %DE15min (i.e., imperative for adequate drug release) and %Perm45min (i.e., essential for absorption of the drugs into the systemic circulation). The optimized formulation was chosen by numeric optimization using desirability function (Singh et al., Citation2011a). The constraints set for numerical optimization of MCT-SNEDDS included globule size <100 nm, emulsification time <10 min, %DE15min ranging between 30–40% and %Perm45min >90%, while for optimization of the LCT-SNEDDS, the globule size <100 nm, emulsification time <10 min, %DE15min ranging between 25%–45%, and %Perm45min >90% were fixed for the purpose. The optimized formulations were embarked upon based upon the aforelisted criteria. The optimized MCT-SNEDDS contained Captex 255 (412 mg), Cremophor RH40 (688 mg) and Transcutol HP (154 mg), exhibiting a globule size of 51.7 nm, an emulsification time of 6.2 min, a %DE15min of 31.5% and a %Perm45min of 91.4%, while the optimized LCT-SNEDDS contained ethyl oleate (154 mg), Tween 80 (604 mg) and Transcutol HP (113 mg), exhibiting a globule size of 91 nm, an emulsification time of 4.62 min, a %DE15min of 26.8% and a %Perm45min of 93%.
Validation of the optimization methodology by comparing the observed responses with those of the predicted ones revealed the percent prediction error ranging between −3.69% and 4.95% for the MCT-SNEDDS, and −4.77% and 4.67% for LCT-SNEDDS, respectively. Linear correlation plots demonstrated excellent correlations between the predicted and observed responses, as is evident from the values of ‘r’ ranging between 0.879 and 0.997 for MCT-SNEDDS, while 0.925 and 0.999 for LCT-SNEDDS, respectively. Also, the corresponding residual plots confirmed nearly uniform and random scatter of points around the zero axis (data not shown), thus indicating high degree of prognostic ability of the experimental methodology.
Characterization of the optimized SNEDDS
Globule size and zeta potential
The mean globule size of the optimized MCT and LCT-SNEDDS was found to be 50.7 nm and 92.4 nm, respectively. The studies confirmed that the both formulations exhibited globule size in the nanometric range. Also, the highly negative values of zeta potential (−28 mV and −36 mV) confirm high stability of nanoemulsion system against the coalescence of globule. There was a significant difference (p < 0.05) observed in the particle size and zeta potential of the MCT and LCT SNEDDS formulations. This can be attributed to the variation in the chain length of the lipids, resulting in the difference in the size and zeta potential values (Bandyopadhyay et al., Citation2012). Potential difference of the microemulsion is known to be a vital factor in the characterization of the emulsification efficiency. Coalescence of globules, therefore, can be evaded by an increased electrostatic repulsion forces between the emulsion globules. On the other hand, decrease in the electrostatic repulsion forces may lead to phase separation (Bali et al., Citation2010; Khan et al., Citation2015).
Thermodynamic stability
As the formation of nanoemulsion form SNEEDS is a spontaneous process, the formulation should possess considerable stability against creaming, cracking and precipitation. MCT SNEDDS was clear and transparent while LCT SNEDDS was yellowish in color, clear and transparent in appearance. Both the optimized MCT and LCT-SNEDDS did not show any signs of instability after application of stress. This confirmed high degree of physical stability and robust nature of the prepared formulations.
Drug release comparisons
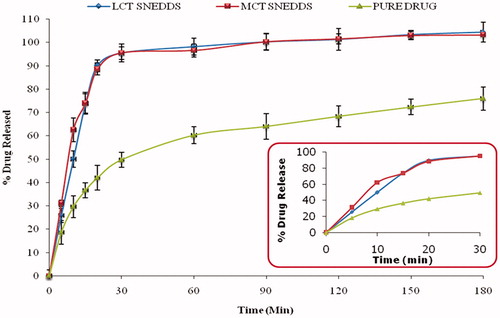
Comparative evaluation of drug release profiles showed marked improvement in the drug release rate from the optimized MCT and LCT-SNEDDS as compared to pure drug (). This confirmed that the optimized formulations are markedly better than the pure drug. Almost complete drug release was observed within 20 min for the optimized formulations, while pure drug showed only 41.73% release over a time period of 3 h. Significant improvement in dissolution rate indicated improved solubilization of the drug in the aqueous media ostensibly owing to spontaneous emulsification of the lipidic and emulsifying agents to produce the ultrafine emulsions by micellar solubilization (Singh et al., Citation2009; Bandyopadhyay et al., Citation2012; Elgart et al., Citation2013).
Figure 3. Plot representing percent drug released from optimized formulations (MCT and LCT SNEDDS) and pure drug. The inset shows the percent drug release in 30 min (n = 6).
Rheological studies
Rheological characteristics are considered to be quite vital during the formulation of SNEDDS, when the liquid SNEDDS are filled into the gelatin capsule shells. If high viscosity might cause hindrance in pourability of fluid in filling of capsules, low viscosity may result in leakage and drug precipitation during storage and transportation process. The rheograms of optimized MCT and LCT-SNEDDS (Supplementary data Figure 9) depict a constant dynamic viscosity value at 25 °C with increase in shear rate, shear stress and torque. As the shear rate was increased from 2 to 100 s−1, absolute viscosity of the optimized MCT and LCT-SNEDDS was found to be 0.16 Pa s and 0.10 Pa s, respectively. Further, the effect of increasing the torque value show partial effect on the absolute viscosity of the samples. Overall, the rheograms reveal no significant change in the Newtonian flow characteristics of MCT and LCT-SNEDDS. These results affirm the rheological stability and robustness of MCT and LCT-SNEEDS at the ambient temperature conditions.
In situ intestinal perfusion studies
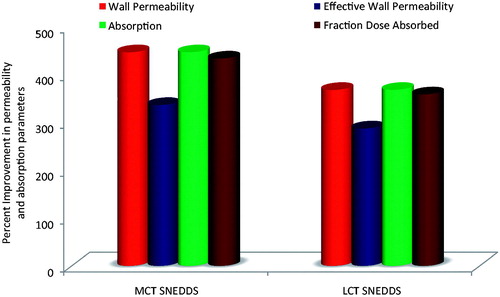
Being a BCS class II drug, artemether is known to exhibit dissolution-limited absorption (Wei et al., Citation2005). Nonetheless, studies performed to ratify the enhancement in bioavailability have to be supplemented with the studies like in situ single pass intestinal perfusion studies (SPIP). portrays the percent increase in absorption and permeation parameters obtained with the optimized MCT and LCT-SNEDDS formulations compared to the pure drug. The perfusion studies showed significant improvement in absorption number and bioavailable fraction in case of optimized MCT and LCT-SNEDDS vis-à-vis the pure drug. There was a marked increase (5- to 6-fold) in the absorption number and fraction dose absorbed from optimized SNEDDS as compared to the pure drug. Also, the optimized MCT and LCT SNEDDS showed 4- to 4.5-fold increase in the values of effective permeability and wall permeability vis-à-vis the pure drug. The overall results indicated that the optimized formulations were remarkably superior to the pure drug in increasing the values of absorption and permeation parameters.
Figure 4. Plot showing the comparative improvement in the values of permeability (effective permeability and wall permeability) and absorption parameters (absorption number and Fraction dose absorbed) from the optimized MCT and LCT-SNEDDS as compared to the pure drug.
In vivo pharmacodynamic studies
The present studies encompassed investigation of variegated parameters delineating the antimalarial activity viz. percent parasitemia suppression, mean percent parasitemia and percent mortality in laca mice, as per the protocols reported in literature (Lin et al., Citation1997; Mohd Ridzuan et al., Citation2006; Pinmai et al., Citation2010). During the erythrocytic phase of malarial life cycle, the parasites were present in the erythrocytes, and actively uptaken by the phagocytic cells present in liver and spleen. Therefore, the estimation of various biochemical parameters viz. levels of SGOT, SGPT and bilirubin are considered critical for estimating the liver functioning upon peroral administration of the optimized SNEDDS formulations. There are numerous literature reports substantiating escalation of these biochemical studies (Wilairatana et al., Citation1994; Lin et al., Citation1997; Sheiban, Citation1999; Kochar et al., Citation2003; Ahsan et al., Citation2008; Pinmai et al., Citation2010).
Estimation of mean %parasitemia
Following the four-day suppression test in P. berghi infected mice, oral doses of different formulations viz. optimized MCT and LCT-SNEDDS, and pure dug demonstrated distinct superiority in mean %parasitemia results. The MCT and LCT-SNEDDS showed 27.48% and 28.79% mean percent parasitemia, while the pure drug revealed only 47.77% mean %parasitemia as compared to the control group, at 20th day of P.I. (). The results revealed significant suppression (p < 0.001) of the mean parasitemia count by the optimized formulations as compared to that of the pure drug ().
Figure 5. Percent suppression in various diagnostic parameters observed with different treatment formulations with respect to pure drug at 20th day (OPT M: optimized MCT-SNEDDS; OPT L: optimized LCT-SNEDDS).
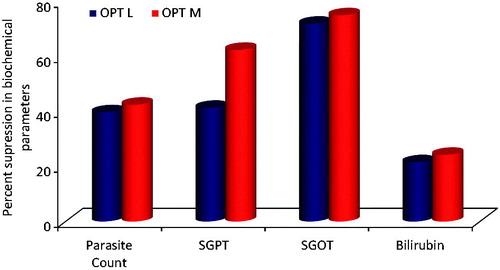
Table 4. Mean percent parasitemia from day “0” to day “20”.
Estimation of animal survival
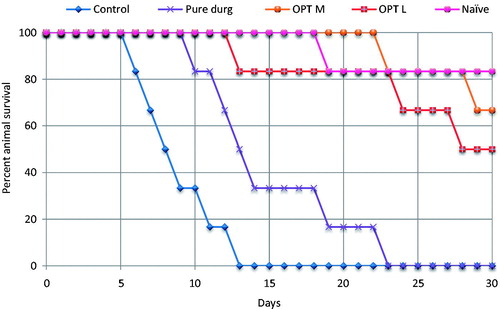
Evaluation of animal survival from all the groups receiving various treatment formulations showed longer life-span (i.e., 10–30 days) compared to the control group (i.e., 6–12 days), as is clearly evident from the Kaplan-Meier curve for percent survival (). Most promising results were observed with the optimized MCT-SNEDDS, where all the mice survived till day ‘22’ P.I., while the LCT-SNEDDS revealed survival till day “12”. However, the untreated control group showed 100% mortality of animals between 6 and 14 days (Abosi & Raseroka, Citation2003). Overall, the optimized SNEDDS formulation showed significantly lower (p < 0.001) mortality rates as compared to that of the pure drug, indicating superior treatment efficacy of the developed formulations. The observed results are in consonance with literature showing increased efficacy of artemether when administered in nanoformulations (McGready et al., Citation2008; Cachet et al., Citation2009).
Figure 6. Kaplan–Meier curves for percent survival of different animal groups indicating significantly lower (p < 0.001) mortality for OPT L and OPT M viz-à-viz pure drug. (OPT M: optimized MCT-SNEDDS; OPT L: optimized LCT-SNEDDS).
Estimation of SGOT, SGPT and bilirubin
As illustrated in , the mean SGPT levels for the control group showed pronounced increase in the values, i.e., over 1500% as compared to the naïve group, from day “0” to day “12” P.I. (after that all the animals died). The treatment groups showed no significant change in SGPT levels till day “4” indicating that plasmodial parasites were not able to grow initially owing to the presence of drug in the body following administration of the pure drug, optimized MCT and LCT-SNEDDS. However, significant elevation in the levels was observed in the pure drug treated group on and after day “8” P.I., i.e., 265% and 1030% on day “8” and “20” vis-à-vis the naïve group. The optimized MCT- and LCT-SNEDDS-treated groups also revealed increase in the levels of SGPT after day “4” through this elevation was less prominent as compared to the pure drug treated group, i.e., 128% and 625% on day “8” and “20” P.I., respectively.
Table 5. Values of liver function parameter, namely SGPT observed during study.
Likewise, the levels of SGOT and bilirubin levels also showed analogous results, as enlisted in and , respectively. Mean SGOT and bilirubin levels for control group showed sharp increase in the values, as compared to the naïve group, from day “0” to day “12” P.I. (after that all animals died). Like SGPT, the mean SGOT and bilirubin levels for the treatment groups showed no significant change till day “4”, indicating that the parasites were not able to grow initially apparently owing to the significant levels of drug in the body following administration of the pure drug, optimized MCT and LCT-SNEDDS. Significantly elevated levels were observed on and after day “8” P.I. for the pure drug treated group as compared to the naïve group (p < 0.001). However, elevation in the levels was less significant for the optimized MCT- and LCT-SNEDDS-treated groups as compared to pure drug treated group (p > 0.05).
Table 6. Values of liver function parameter, namely SGOT observed during study.
Table 7. Values of liver function parameter, namely total bilirubin observed during study.
Overall, vividly portrays the results of percent suppression in different parasitemia parameters for the treatment groups as compared to the pure drug. Remarkable augmentation in the antimalarial activity of the drug can be rationally ascribed to the superior efficacy of the SNEDDS formulation, owing to significant improvement in the biopharmaceutical performance of the drug. Vital mechanistics through which SNEDDS may have helped in augmenting the oral drug absorption by circumnavigation of hepatic first-pass effect, inhibition of metabolism by gut cytochromes and of efflux by P-gp (Porter & Charman, Citation2001a; Porter et al., Citation2008; Singh et al., Citation2011b; Elgart et al., Citation2013; Bandyopadhyay et al., Citation2014; Singh et al., Citation2014; Beg et al., Citation2015b). Owing to enhanced oral drug absorption into the systemic circulation, more number of parasites were killed in case of the SNEDDS formulations, as is clearly evident from the percent parasitemia count in the blood smear till day “8” P.I. in case of both MCT- and LCT-SNEDDS-treated groups, while on day “4” P.I. for the parasites were observed in pure drug-treated group. This observation might be ascribed to low solubility and poor oral bioavailability characteristics of the drug, leading eventually to its submaximal concentration in blood. As the SNEDDS presents the drug in solubilized form in the blood in the form of nanostructured globules, it resulted in drastic augmentation in the bioavailable fraction and consequently the pharmacodynamic action (Bandyopadhyay et al., Citation2012; Elgart et al., Citation2013).
Interestingly, a small edge in the efficacy of optimized MCT-SNEDDS over the LCT-SNEDDS throughout in vivo studies may be explained on the basis of literature reports. As artemether is metabolized in liver to produce an active metabolite dihydroartemisinin, it has been reported to be pharmacologically more active than the parent compound (Na Bangchang et al., Citation1994; Suputtamongkol et al., Citation2001). In this context, the higher efficacy of MCT-based SNEDDS formulations could be assignable to the higher chances for formation of dihydroartemisinin, as MCTs are preferentially absorbed into the systemic circulation through the hepatic portal route. On the other hand, LCT-based SNEDDS formulations are known to get absorbed through the lymphatic pathways, thereby bypassing the liver without being metabolized to produce dihydroartemisinin, leading eventually to produce comparatively lower pharmacodynamic effect response (Gershkovich & Hoffman, Citation2007). Both the SNEDDS, however, were able to demonstrate appreciable pharmacodynamic response, indicating distinct improvement in the oral bioavailability. The treatment formulations (i.e., MCT and LCT-SNEDDS), however, revealed elevation in the levels of biomarkers (i.e., SGPT, SGOT and bilirubin) after day “4” P.I. ostensibly owing to the elimination of drug from the blood after single dose administration, leading ultimately to growth of the parasites at the given doses.
In a nutshell, the present studies construe that the prepared novel formulations were successfully able to suppress the parasitemia followed by prolongation of the life-span in the studied animals. However, the single oral dose treatment showed relapse in the parasitemia like conditions plausibly owing to the faster terminal metabolism and clearance of the drug from the body. Similar responses were observed in several other reports (Lin et al., Citation1997; Mohd Ridzuan et al., Citation2006; Aditya et al., Citation2012). The implications on the current treatment therapy may require adjuvant drug therapy to overcome the parasitemia load in the erythrocytic phase of the malaria parasite (Makanga et al., Citation2011; Aditya et al., Citation2012; Makanga, Citation2014).
Histopathological studies
The photomicrographs obtained following histopathological examination of the liver segments are portrayed in . Larger areas of centrilobular necrosis were observed in the control group. This may be plausibly owing to the disseminated intravascular coagulation of the malaria pigment. Also, the necrotic areas of liver can be clearly observed with pure drug treated group. Miniscule necrotic areas, on the other hand, were observed in case of the animals administered with both optimized MCT and LCT-SNEDDS.
Figure 7. Histopathological images of rat liver segments, (a) indicating intact liver haepatocytes without any necrosis, naïve group; (b) indicating areas of centrilobular necrosis and congestion of centrilobular veins by parasitized erythrocytes (indicated by arrows), negative control; (c) necrotic areas lesser in extent, fewer centrilobular vein congestion, pure drug treated group; (d) and (e) no significant signs of haepatocytic cell necrosis or phagocytic cell hypertrophy, optimized MCT and LCT-SNEDDS treated group.
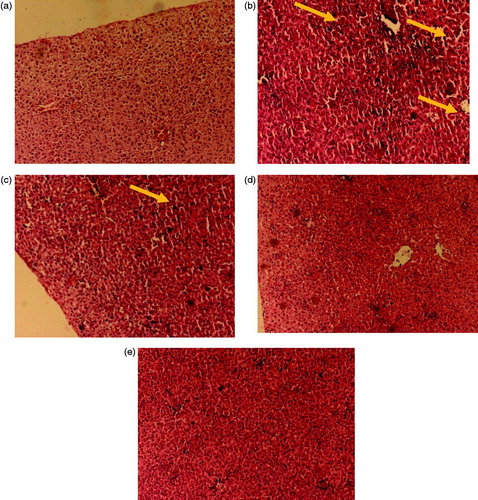
The histopathological photomicrographs also showed striking presence of the acute stage of malarial infection (i.e., gross congestion of the sinusoids and centrilobular veins by infected erythrocytes) with the untreated control group and pure drug group vis-à-vis the animals treated with optimized SNEDDS formulations. As large number of infected erythrocytes pass through spleen and liver, these infected RBCs and free merozoites are easily taken-up by the phagocytic cells of liver, leading further to produce abnormal pathological conditions (Sullivan et al., Citation1996; Singh et al., Citation2002; Haque et al., Citation2011).
Accelerated stability studies
The accelerated stability studies of the optimized MCT and LCT-SNEDDS confirmed the robust nature of the prepared formulations under the specified stability conditions during six months of time period without any significant change in drug content, globule size, emulsification time, viscosity and dissolution performance (Supplementary data Table 1).
Conclusions
The present studies aimed at formulating SNEDDS of artemether, a highly promising antimalarial drug for augmenting its oral bioavailability by improving dissolution performance and intestinal drug absorption. Systematic optimization employing experimental designs helped in judicious selection of the suitable combinations of functional excipients for formulating the SNEDDS with varying lipid chain length and surfactants for attaining desired values of CQAs. Among the MCTs and LCTs explored during the study, MCT-SNEDDS exhibited superiority in enhancing the biopharmaceutical performance of artemether over the LCT-SNEDDS, as is clearly evident through in vitro, ex vivo and in situ evaluation studies. Pharmacodynamic studies also construe superior parasitemia inhibition by the MCT-SNEDDS followed by LCT-SNEDDS with significant reduction in the serum SGOT, SGPT, bilirubin levels, and above all, the survival time for the animals. In a nutshell, the present studies successfully ratify successful development of SNEDDS as one of the promising nanocolloidal carriers for bioavailability enhancement of artemether, which can be applicable for other BCS class II and IV drugs exhibiting identical biopharmaceutical challenges issues.
References
- Abosi AO, Raseroka BH. (2003). In vivo antimalarial activity of Vernonia amygdalina. Br J Biomed Sci 60:89–91
- Aditya NP, Chimote G, Gunalan K, et al. (2012). Curcuminoids-loaded liposomes in combination with arteether protects against Plasmodium berghei infection in mice. Exp Parasitol 131:292–9
- Ahsan T, Ali H, Bkaht SF, et al. (2008). Jaundice in falciparum malaria; changing trends in clinical presentation-a need for awareness. J Pak Med Assoc 58:616–21
- Bali V, Ali M, Ali J. (2010). Study of surfactant combinations and development of a novel nanoemulsion for minimising variations in bioavailability of ezetimibe. Colloids Surf B Biointerfaces 76:410–20
- Bandyopadhyay S, Beg S, Katare OP, et al. (2014). QbD-oriented development of self-nanoemulsifying drug delivery systems (SNEDDS) of valsartan with improved biopharmaceutical performance. Curr Drug Deliv 12:544–63
- Bandyopadhyay S, Katare OP, Singh B. (2012). Optimized self nano-emulsifying systems of ezetimibe with enhanced bioavailability potential using long chain and medium chain triglycerides. Colloids Surf B Biointerfaces 100:50–61
- Bandyopadhyay S, Katare OP, Singh B. (2014). Development of optimized supersaturable self-nanoemulsifying systems of ezetimibe: effect of polymers and efflux transporters. Expert Opin Drug Deliv 11:479–92
- Beg S, Jena SS, Patra Ch N, et al. (2013). Development of solid self-nanoemulsifying granules (SSNEGs) of ondansetron hydrochloride with enhanced bioavailability potential. Colloids Surf B Biointerfaces 101:414–23
- Beg S, Sandhu PS, Batra RS, et al. (2015a). QbD-based systematic development of novel optimized solid self-nanoemulsifying drug delivery systems (SNEDDS) of lovastatin with enhanced biopharmaceutical performance. Drug Deliv 22:765–84
- Beg S, Sharma G, Thanki K, et al. (2015b). Positively charged self-nanoemulsifying oily formulations of olmesartan medoxomil: systematic development, in vitro, ex vivo and in vivo evaluation. Int J Pharm 493:466–82
- Beg S, Swain S, Singh HP, et al. (2012). Development, optimization, and characterization of solid self-nanoemulsifying drug delivery systems of valsartan using porous carriers. AAPS PharmSciTech 13:1416–27
- Cachet N, Hoakwie F, Bertani S, et al. (2009). Antimalarial activity of simalikalactone E, a new quassinoid from Quassia amara L. (Simaroubaceae). Antimicrob Agents Chemother 53:4393–8
- Elgart A, Cherniakov I, Aldouby Y, et al. (2013). Improved oral bioavailability of BCS class 2 compounds by self nano-emulsifying drug delivery systems (SNEDDS): the underlying mechanisms for amiodarone and talinolol. Pharm Res 30:3029–44
- Gershkovich P, Hoffman A. (2007). Effect of a high-fat meal on absorption and disposition of lipophilic compounds: the importance of degree of association with triglyceride-rich lipoproteins. Eur J Pharm Sci 32:24–32
- Grace JM, Skanchy DJ, Aguilar AJ. (1999). Metabolism of artelinic acid to dihydroqinqhaosu by human liver cytochrome P4503A. Xenobiotica 29:703–17
- Haque A, Best SE, Amante FH, et al. (2011). High parasite burdens cause liver damage in mice following Plasmodium berghei ANKA infection independently of CD8(+) T cell-mediated immune pathology. Infect Immun 79:1882–8
- Jain NK, Gupta U. (2008). Application of dendrimer-drug complexation in the enhancement of drug solubility and bioavailability. Expert Opin Drug Metab Toxicol 4:1035–52
- Keohane K, Rosa M, Coulter IS, Griffin BT. (2015). Enhanced colonic delivery of ciclosporin A self-emulsifying drug delivery system encapsulated in coated minispheres. Drug Dev Ind Pharm 42:245–53
- Khan AW, Kotta S, Ansari SH, et al. (2015). Self-nanoemulsifying drug delivery system (SNEDDS) of the poorly water-soluble grapefruit flavonoid Naringenin: design, characterization, in vitro and in vivo evaluation. Drug Deliv 22:552–61
- Kochar DK, Singh P, Agarwal P, et al. (2003). Malarial hepatitis. J Assoc Physicians India 51:1069–72
- Lin AJ, Zikry AB, Kyle DE. (1997). Antimalarial activity of new dihydroartemisinin derivatives: 7,4-(p-substituted phenyl)-4(R or S)-[10(alpha or beta)-dihydroartemisininoxy]butyric acids. J Med Chem 40:1396–400
- Makanga M. (2014). A review of the effects of artemether-lumefantrine on gametocyte carriage and disease transmission. Malar J 13:291–306
- Makanga M, Bassat Q, Falade CO, et al. (2011). Efficacy and safety of artemether-lumefantrine in the treatment of acute, uncomplicated Plasmodium falciparum malaria: a pooled analysis. Am J Trop Med Hyg 85:793–804
- Mandawgade SD, Sharma S, Pathak S, Patravale VB. (2008). Development of SMEDDS using natural lipophile: application to beta-Artemether delivery. Int J Pharm 362:179–83
- McGready R, Tan SO, Ashley EA, et al. (2008). A randomised controlled trial of artemether-lumefantrine versus artesunate for uncomplicated plasmodium falciparum treatment in pregnancy. PLoS Med 5:e253
- Mohd Ridzuan MA, Ruenruetai U, Noor Rain A, et al. (2006). Antimalarial properties of Goniothalamin in combination with chloroquine against Plasmodium yoelii and Plasmodium berghei growth in mice. Trop Biomed 23:140–6
- Mullertz A, Ogbonna A, Ren S, Rades T. (2010). New perspectives on lipid and surfactant based drug delivery systems for oral delivery of poorly soluble drugs. J Pharm Pharmacol 62:1622–36
- Murota K, Cermak R, Terao J, Wolffram S. (2013). Influence of fatty acid patterns on the intestinal absorption pathway of quercetin in thoracic lymph duct-cannulated rats. Br J Nutr 109:2147–53
- Na Bangchang K, Karbwang J, Thomas CG, et al. (1994). Pharmacokinetics of artemether after oral administration to healthy Thai males and patients with acute, uncomplicated falciparum malaria. Br J Clin Pharmacol 37:249–53
- Narang AS, Delmarre D, Gao D. (2007). Stable drug encapsulation in micelles and microemulsions. Int J Pharm 345:9–25
- Negi P, Singh B, Sharma G, et al. (2015). Phospholipid microemulsion-based hydrogel for enhanced topical delivery of lidocaine and prilocaine: QbD-based development and evaluation. Drug Deliv 23:951–67
- Peters W. (1975). The chemotherapy of rodent malaria, XXII. The value of drug-resistant strains of P. berghei in screening for blood schizontocidal activity. Ann Trop Med Parasitol 69:155–71
- Pinmai K, Hiriote W, Soonthornchareonnon N, et al. (2010). In vitro and in vivo antiplasmodial activity and cytotoxicity of water extracts of Phyllanthus emblica, Terminalia chebula, and Terminalia bellerica. J Med Assoc Thai 93:S120–6
- Porter CJ, Charman WN. (2001a). Intestinal lymphatic drug transport: an update. Adv Drug Deliv Rev 50:61–80
- Porter CJ, Charman WN. (2001b). Transport and absorption of drugs via the lymphatic system. Adv Drug Deliv Rev 50:1–2
- Porter CJ, Pouton CW, Cuine JF, Charman WN. (2008). Enhancing intestinal drug solubilisation using lipid-based delivery systems. Adv Drug Deliv Rev 60:673–91
- Sandhu PS, Beg S, Mehta F, et al. (2015). Novel dietary lipid-based self-nanoemulsifying drug delivery systems of paclitaxel with p-gp inhibitor: implications on cytotoxicity and biopharmaceutical performance. Expert Opin Drug Deliv 12:1809–22
- Shah NH, Carvajal MT, Patel CI, et al. (1994). Self-emulsifying drug delivery systems (SEDDS) with polyglycolyzed glycerides for improving in vitro dissolution and oral absorption of lipophilic drugs. Int J Pharm 106:15–23
- Shah P, Mashru R. (2008). Development and evaluation of artemether taste masked rapid disintegrating tablets with improved dissolution using solid dispersion technique. AAPS PharmSciTech 9:494–500
- Sharma G, Beg S, Thanki K, et al. (2015). Systematic development of novel cationic self-nanoemulsifying drug delivery systems of candesartan cilexetil with enhanced biopharmaceutical performance. RSC Adv 5:71500–13
- Sheiban AK. (1999). Prognosis of malaria associated severe acute renal failure in children. Ren Fail 21:63–6
- Singh B, Bandopadhyay S, Kapil R, et al. (2009). Self-emulsifying drug delivery systems (SEDDS): formulation development, characterization, and applications. Crit Rev Ther Drug Carrier Syst 26:427–521
- Singh B, Beg S, Khurana RK, et al. (2014). Recent advances in self-emulsifying drug delivery systems (SEDDS). Crit Rev Ther Drug Carrier Syst 31:121–85
- Singh B, Dahiya M, Saharan V, Ahuja N. (2005a). Optimizing drug delivery systems using systematic “design of experiments” Part II: retrospect and prospects. Crit Rev Ther Drug Carrier Syst 22:215–94
- Singh B, Kapil R, Nandi M, Ahuja N. (2011a). Developing oral drug delivery systems using formulation by design: vital precepts, retrospect and prospects. Expert Opin Drug Deliv 8:1341–60
- Singh B, Kaur T, Singh S. (1997). Correction of raw dissolution data for loss of drug during sampling. Indian J Pharm Sci 59:196–9
- Singh B, Khurana L, Bandyopadhyay S, et al. (2011b). Development of optimized self-nano-emulsifying drug delivery systems (SNEDDS) of carvedilol with enhanced bioavailability potential. Drug Deliv 18:599–612
- Singh B, Kumar R, Ahuja N. (2005b). Optimizing drug delivery systems using systematic “design of experiments.” Part I: fundamental aspects. Crit Rev Ther Drug Carrier Syst 22:27–105
- Singh B, Singh R, Bandyopadhyay S, et al. (2013). Optimized nanoemulsifying systems with enhanced bioavailability of carvedilol. Colloids Surf B Biointerfaces 101:465–74
- Singh B, Singh S. (1998). A Comprehensive computer program for study of drug release kinetics from compressed matrices. Indian J Pharm Sci 60:313–16
- Singh RP, Kashiwamura S, Rao P, et al. (2002). The role of IL-18 in blood-stage immunity against murine malaria Plasmodium yoelii 265 and Plasmodium berghei ANKA. J Immunol 168:4674–81
- Sullivan AD, Ittarat I, Meshnick SR. (1996). Patterns of haemozoin accumulation in tissue. Parasitology 112:285–94
- Suputtamongkol Y, Newton PN, Angus B, et al. (2001). A comparison of oral artesunate and artemether antimalarial bioactivities in acute falciparum malaria. Br J Clin Pharmacol 52:655–61
- Tran TH, Day NP, Nguyen HP, et al. (1996). A controlled trial of artemether or quinine in Vietnamese adults with severe falciparum malaria. N Engl J Med 335:76–83
- Truong DH, Tran TH, Ramasamy T, et al. (2015). Development of solid self-emulsifying formulation for improving the oral bioavailability of erlotinib. AAPS PharmSciTech. [Epub ahead of print]. DOI: 10.1208/s12249-015-0370-5
- Van Hensbroek MB, Onyiorah E, Jaffar S, et al. (1996). A trial of artemether or quinine in children with cerebral malaria. N Engl J Med 335:69–75
- Wei L, Sun P, Nie S, Pan W. (2005). Preparation and evaluation of SEDDS and SMEDDS containing carvedilol. Drug Dev Ind Pharm 31:785–94
- Wilairatana P, Looareesuwan S, Charoenlarp P. (1994). Liver profile changes and complications in jaundiced patients with falciparum malaria. Trop Med Parasitol 45:298–302
- Yang B, Lin J, Chen Y, Liu Y. (2009). Artemether/hydroxypropyl-beta-cyclodextrin host-guest system: characterization, phase-solubility and inclusion mode. Bioorg Med Chem 17:6311–17
- Yu L. (2008). Pharmaceutical quality by design: product and process development, understanding, and control. Pharm Res 25:781–91