Abstract:
MDCK cells were engineered to express luciferase driven by cytomegalovirus (CMV) or hybrid ubiquitin B (UbB) promoter and encapsulated in alginate-poly-L-lysine-alginate microcapsules. In vitro experiments showed capsules could be monitored individually or in multi-layers quantitatively. When luciferase-expressing and non-luciferase expressing MDCK cells were mixed at different ratios and encapsulated, the signals increased linearly according to the number of capsules, in vitro and in vivo. For CMV-driven luciferase expression, the strongest signal was seen at 4 hours post-implantation, with a subsequent 50% decrease by 24 hours and then declined gradually to 10-20% until day 20. However, retrieved capsules showed good cell viability. When capsules contained plasmid driven by UbB promoter, there was no decline in signal. Our results indicate that luciferase could be used as a marker for microencapsulated cells to monitor the viability and gene expression of the implanted cells.
INTRODUCTION
Microencapsulated cells engineered to secrete therapeutic proteins have been effectively applied to treat several human disorders such as dwarfism [Citation1], lysosomal storage diseases [Citation2], hemophilia [Citation3] and cancers in mouse models [Citation4, Citation5]. Once these alginate-poly-L-lysine-alginate (APA) microcapsules are administered to an animal, however, the fate of the implanted microcapsules and their engineered-cell payload can only be directly ascertained by surgical retrieval. If there is a device to monitor the capsules in vivo non-invasively over time, data from multiple points can be obtained from a single experimental mouse/group, leading to a significant reduction in animal utilization. We have previously established a novel method to image implanted microcapsules by incorporating nanoscale magnetic iron oxide particles (ferrofluids) into alginate in the core or the surface of microcapsules, rendering it possible to quantitatively monitor the microcapsules in vivo with magnetic resonance imaging (MRI) [Citation6]. Recently, Bulte's group also has developed magnetocapsules to facilitate tracking the hepatic delivery of labeled islet and visualizing a single capsule [Citation7]. However, there is limited availability of MRI for small animal studies and this technique does not provide biological information about the cells contained in the microcapsules.
To acquire maximum amount of information including detecting cellular and molecular changes dynamically from the mouse models, a sensitive and reliable noninvasive imaging system is crucial. To avoid the limitation of other optical imaging strategies such as the use of fluorescent dyes, fluorescent proteins to generate whole-body images of physical and pathological process in small animals in laboratories [Citation8–11], bioluminescence imaging (BLI) enables researchers to follow molecular and cellular events by inducing the relevant cells or tissues to express a bioluminescent protein such as luciferase. This enzyme can convert exogeously administrated substrate (luciferin) in the presence of oxygen, magnesium, and adenosine triphosphate into light, which can be monitored externally [Citation12]. The biggest advantage of luciferase as a reporter protein in mammalian tissues is the inherently low level of background noise [Citation13], as there is no need for excitatory light and hence non-specific signal as there is in fluorescence. BLI offers the greatest versatility, sensitivity, and high signal-to-noise ratio to gather important spatiotemporal information about cellular trafficking, the dynamics of cell proliferation and cell death in small animal studies in vivo [Citation14]. BLI has proved to be one of the most sensitive approaches for cancer research. It shows the same sensitivity as MRI in detecting brain tumor and is superior to positron emission tomography PET [Citation15] for examining gene transfer [Citation16]. As few as 1000-10,000 cells are detectable in lung, liver, and spleen after s.c or i.v. injection and as few as 100 cells can be reliably detected in the peritoneal cavity when the cells express higher luciferase [Citation17–19]. In vivo BLI has been successfully applied to track the gene expression pattern in transgenic mice [Citation20], evaluate the kinetics of tumor development, response to therapies, metastasis and relapse [Citation18, Citation19, Citation21], assess the extension of protein-protein interactions [Citation22, Citation23] and determine the proliferation and differentiation of stem cells [Citation24].
To extend this approach to investigate the fate of microcapsules and their encapsulated cells, we have labelled our cells with luciferase via stable transfection, encapsulated them and transplanted them into the peritoneal cavity of mice. We explored whether the signal detectable externally reflects the status of cells dynamically in vitro and in vivo.
MATERIALS AND METHODS
Construction of Luciferase Expression Vectors
pC3B vector, a modified version of the pcDNA 3.1 expression vector, was a kind gift from BioMarin Pharmaceutical Inc (Novato, CA, USA). This construct contains a 654bp full length of CMV promoter, pre-pro insulin leader sequence and rabbit beta-globin intervening sequence (IVS2). The 1650-bp Hind III/Xhol I PCR fragment containing full length of luciferase with start codon was cloned from the pGL3-Basic vector (Promega, Madison, WI, USA) and inserted into the Hind III/Xhol I sites of the pC3B backbone to establish the vector pC3B-CMV-luci. To construct pMONO-UbB-luci, pMONO-neo-mcs (InvivoGen, San Diego, CA) was digested with Sbf I/Spe I and the 405-bp CMV enhancer fragment was cloned and ligated into the plasmid. Human ubiquitin B promoter of 1093 bp was cloned from vector pDRIVE-UbiquitinB (InvivoGen, San Diego, CA) and inserted 3’ of the CMV enhancer with Spe I/Age I digestion. The constructs were screened by restriction enzyme digest analysis and sequenced.
Cell Culture
Madin-Darby canine kidney epithelial cells (MDCK) were cultured in Dulbecco's minimal essential medium (DMEM) (Lonza, MA, USA) supplemented with 10% fetal bovine serum (FBS) (PAA Laboratory Inc., ON, Canada) and penicillin (100U/ml)-streptomycin (100µg/ml) (Gibco, Grand Island, NY) at 37°C in a 5% CO2 water-jacketed incubator. Cells were sub-cultured every 2-3 days.
Transfection
MDCK cells were transfected with the luciferase vectors. Transfection was carried out using Lipofectamine 2000 (Invitrogen, Carlsbad, CA) according to the manufacturer's protocol. Transfected cells were selected with G418 in growth medium (800µg/mL). The selected colonies were lysed and screened by luciferase activity (see below) to identify the highest expressing colonies.
Luciferase Activity Assay in vitro
Selected luciferase-expressing colonies were washed 3x with cold PBS and lysed with 1x cell culture lysis buffer (Promega, Madison, WI, USA). Collected lysates were briefly vortexed to ensure complete cell lysis and centrifuged at 13,200 rpm/min for 5 mins at 4°C to remove cell debris. Luciferase expression in individual cell lysate was assayed using the luciferase activity kit (Promega, Madison, WI, USA) protocol provided by the manufacturer. Twenty microliters of cell lysates were loaded into a 96-well plate. An automated injector added 50µl of luciferase substrate mixture to each well at specified time intervals and the emitted light was measured as relative light units (RLUs) by an automated luminometer (Perkin Elmer Applied Biosystems, CA, USA) with a total integration time of 10 seconds and an interval time of 2 seconds. Luciferase activity was calculated as RLUs multiplied by the total volume of the sample and then standardized by the total protein (determined with the DC protein assay kit, Bio-Rad, Hercules, CA, USA) [Citation25].
Encapsulation
The alginate-poly-L-lysine-alginate (APA) microcapsules were fabricated as described previously [Citation26]. Briefly, cells were suspended in 1.5% (w/v) sodium alginate (Kelton, NutraSweet Kelco Company, San Diego, CA) at a concentration of 2.0×10⁶ cells per ml alginate. The alginate/cell suspension was then extruded through a 27-gauge blunt end hypodermic needle (Vita Needle, MA) with concentric air-flow into cold 1.1% calcium chloride solution to form gelled microcapsules of ∼500µm in diameter. The microcapsules were then subjected to a series of washes to form microcapsules laminated with 0.05% poly-L-lysine (PLL, MW 15,000–30,000, Sigma, St. Louis, MO) and 0.03% alginate. The microcapsules were cultured in DMEM medium with 10% FBS and 1% penicillin/streptomycin in an incubator. Microcapsules with 100%, 50%, or 20% of luciferase-expressing MDCK cells were made by mixing luciferase-expressing and non-transfected MDCK at ratios of 1:0, 1:1 or 1:4 to a final cell concentration of 2.0 × 10⁶ cells per ml alginate, then encapsulating as above. The viability of encapsulated cells was determined by trypan blue staining. One hundred microliters of capsules were loaded onto a slide and 100 µl of 0.4% trypan blue was then added and mixed. After standing at room temperature for 5 mins, a cover slip was used to break the microcapsules. Under a microscope, the number of viable (unstained) and dead (stained) cells was counted. The cell viability is the number of viable cells divided by the total number of dead and viable cells [Citation27].
Viable Cells in Microcapsules
The viable cell number per capsule was determined using an AlamarBlue Assay (Trek Diagnostic Systems, Inc., Cleveland, OH, USA). Briefly, 100µl of capsules in suspension were loaded into a 24-well plate with 500µl medium, and then 50µl AlamarBlue reagent was added to each well. After 4 hours incubation at 37°C, 5% CO2, 100µl of the supernatant were transferred to a 96-well plate and read with fluorescence reader (GENios, TECAN, Boston, MA, USA) at an excitation wavelength of 535nm and an emission wavelength of 590nm. The number of viable cells per well was determined with reference to a standard curve generated from a series of known number of monolayer MDCK cells. Capsules were counted in each well after trypan blue staining and then the number of viable cells per capsule was calculated.
Implantation
The animals were treated in accordance with Canadian Institutional Animal Care guidelines. BALB/c mice (Charles River, Montreal QC) were chosen in the in vivo bioluminescent studies since their albinism facilitates transmission of light for bioluminescence imaging. Mice were anesthetized with isofluorane (Anaquest, Mississauga, ON, Canada) before a suspension of 3ml microcapsules in 2ml saline was implanted into the peritoneal cavity of mice under sterile conditions using a 20-gauge i.v. catheter (BD, Oakville, ON, Canada).
Bioluminescence Imaging (BLI)
The BLI imaging system used was custom built, with an Andor Ikon model DW436N-BV cooled CCD camera with a Nikon 50mm Nikkor AF F/1.4 lens used at full open aperture and at the closest focusing distance. The camera was installed onto a custom-made, light sealed black box with ports for isofluorane anesthesia. Images were captured using Andor MCD software, version 2.62I2. The image analysis was processed with Image J version 1.34s (NIH).
In vivo
Mice were anesthetized with isofluorane and i.p. injected with 150 mg/kg of beetle luciferin (Promega, Madison, WI, USA) in saline. Mice were shaved and imaged 15 minutes after substrate injection with a total exposure time of 5 minutes.
Six mice were used in the capsule monitoring experiment. Three mice were implanted with capsules with 100% luciferase-expressing MDCK, one mouse was implanted with capsules containing 50% luciferase-expressing cells and 50% untransfected cells, and the remaining 2 mice were implanted with capsules with 20% luciferase-expressing cells and 80% untransfected cells. All the mice were imaged at the different time points: 4 hrs, 2 days, 7 days, 14 days, and 20 days post-implantation.
In vitro
Capsules either incubated in vitro or retrieved from mice sacrificed on day 20 were washed 5 times with cold saline and loaded into 96-well plates in single or multi-layer to mimic the possible in vivo orientation of implanted capsules. One hundred microliters of luciferase substrate mixture solution were added into the wells containing capsules. Images were taken (30 seconds exposure) 5 minutes after the incubation with substrate.
RESULTS
Luciferase Activity of the Encapsulated Transfected MDCK Cells
When MDCK cells were transfected with vectors pC3B-CMV-luci and pMONO-UbB-luci containing the luciferase gene, stable transfected cells were selected by G418. The highest luciferase activities in pC3B-CMV-luci and pMONO-UbB-luci transfected cell lysates were 6.44×10⁷ and 6.49×10⁷ RLU/mg protein, respectively. The MDCK cells expressing the highest luciferase activity were encapsulated into APA capsules following our standard procedures. The viability of luciferase-expressing MDCK cells remained at almost 100% three months post-encapsulation as determined by trypan blue exclusion assay in vitro. pC3B-CMV-luci transfected MDCK cells were used for all the in vitro BLI experiments.
In vitro Imaging
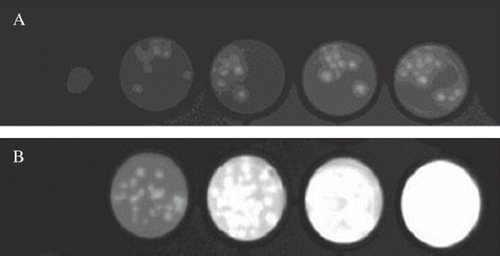
Before implanting the microcapules containing luciferase-expressing cells into mice, in vitro cooled CCD camera semi-quantitative visualization and correlation of bioluminescent signal with three-dimensional orientation of the capsules was performed. Images from BLI showed that a cooled CCD camera could monitor the microcapsules enclosing luciferase-expressing cells in vitro, and brighter images were captured from wells containing more capsules (,). When a small number of capsules (fewer than 20 capsules) were loaded into a 96-well plate, the capsules remained separate in a mono-layer () and were individually identifiable from the image ().
Figure 1. BLI images of microcapsules containing luciferase-expressing MDCK cells. Luciferase-expressing MDCK cells were encapsulated in APA capsules and loaded into a 96-well plate. (A) has increasing numbers (10 - 20) of capsules from left to right, while (B) has 30 – 100 capsules. 100µl luciferase assay reagents were added into each well for incubation for 5 minute at room temperature and the plates were imaged with a 30-second exposure time.
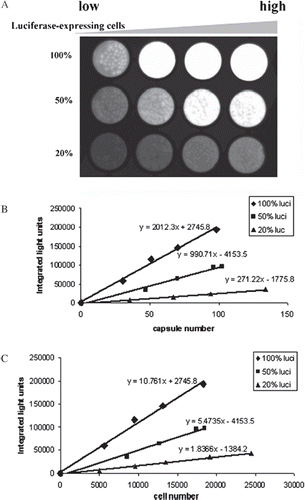
The use of luciferase-expressing cells as a marker of microencapsulated cell function was mimicked by co-encapsulating luciferase-expressing cells with nonluciferase-expressing cells (representing the cells engineered to deliver a therapeutic protein). Three groups of microcapsules with 100%, 50%, and 20% of luciferase-expressing MDCK were made as described in the Methods section to determine how increasing numbers of non-luciferase expressing cells would affect the results. A serial increasing amount of capsules (20µl, 40µl, 60µl, 80µl) for each group were loaded into a 96-well plate from low to high (left to right), forming single to multi-layers (). Using Image J, the signal intensity from the images was quantitatively analyzed to give RLU normalized to capsule number () or cell number (). The intensity of the signal acquired by the cooled CCD camera increased linearly within each group and also increased proportionally among groups as the percentage of luciferase-expressing cells increased. The regression line slopes for the three groups reflected the percentage of luciferase-expressing cells encapsulated (,). For 100%, 50%, and 20% luciferase-expressing cells (100: 50: 20), the RLU normalized per capsule slopes were 2012: 990: 270 (100: 49: 13), and the RLU normalized per cell slopes were 10.76: 5.4: 1.84 (100: 50: 17).
Figure 2. BLI images of microcapsules containing different percentages of luciferase-expressing MDCK cells. Luciferase-expressing and non-luciferase-expressing MDCK cells were mixed at the ratio of 1:0, 1:1, and 1:4 at a final concentration of 2×10⁶ cells/ml alginate to make three groups capsules with 100%, 50%, and 20% luciferase-expressing cells. From left to right, 20µl, 40µl, 60µl, and 80µl of capsules were loaded into a 96-well plate in each group. Then 100µl luciferin substrate mixture was added into each well, incubated for 5 minutes at room temperature, and imaged with an exposure time of 30 seconds (A). BLI images were captured and converted into quantitative analysis. Corresponding amounts of capsules were used to do the AlamarBlue assay to obtain the total cell number in each well and then the same capsules were stained with trypan blue and counted to determine the capsule number (B) and cell number (C), respectively.
In vivo Imaging
BALB/c mice were used for in vivo tests because light produced by luciferase transmits easily through the skin of white mice. shows the composite image of the BLI signal from intraperitoneally implanted micro-capsules containing luciferase-expressing (pC3B-CMV-luci transfected) MDCK cells overlayed on the regular light image of the mouse. Integration of the BLI image allows quantification of the luciferase signal (). At 4 hours after implantation, a strong biolumines-cent signal could be detected from the abdominal area (); however, the signal decreased more than 50% after 24 hours and continued to decline gradually to 10-20% of the initial measurement on day 14 to day 20 ().
Figure 3. In vivo imaging of microcapsules enclosing luciferase-expressing MDCK cells. Three ml of capsules with 2 ml saline were injected peritoneally into a BALB/c mouse. Before imaging, 150mg/kg luciferin was injected i.p. The images were taken with 5-minute exposure 15 minutes after luciferin injection at different experimental time points after implantation (4 hours, day2, day7, day14 and day20).
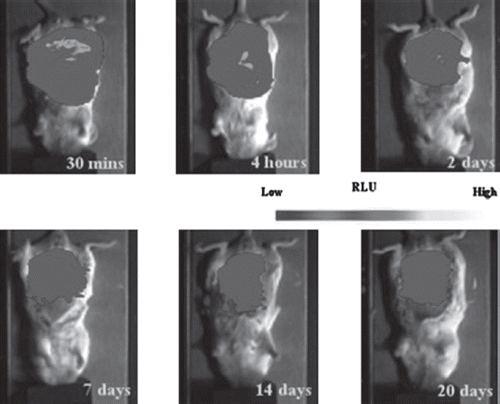
Figure 4. Signals retrieved from mice implanted different percentage of luciferase-expressing MDCK cells. Three groups of capsules containing different percentages of pC3B-CMV-luci transfected MDCK were implanted into the peritoneal cavity of BALB/c mice (100% luciferase, n=3; 50% luciferase, n=1; 20% luciferase, n=2). Images were taken as described in “Material and Methods” immediately after implantation and then at hour4, day2, day4, day14 and day20. Standard deviation is shown where appropriate. X axis represents logarithmic scale.
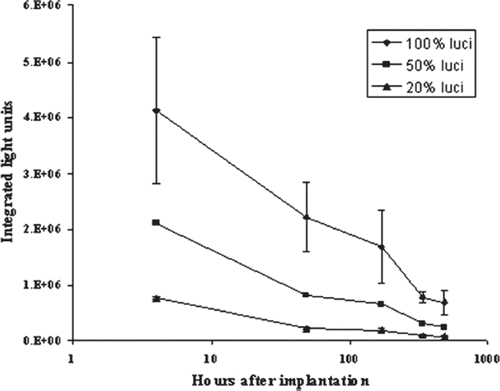
In order to investigate whether luciferase-expressing cells can be used as a marker for survival of encapsulated therapeutic cells in vivo, we encapsulated various ratios of luciferase transfected to untransfected MDCK cells at 1:0, 1:1, and 1:4 (100%, 50% and 20% luciferase-expressing cell, respectively). The capsules with these mixed cells were implanted into the peritoneal cavity of different mice and monitored by cooled CCD camera at 4 hours, day 2, day 7, day 14, and day 20. Similar to the in vitro data (), the signal in vivo correlated with the number of luciferase-expressing cells implanted (), with the ratio being well maintained despite the decrease in signal over time. Compared to the implanted ratio of 100:50:20, the integrated light units for the three groups (100%, 50%, and 20% luciferase-expressing cells) had ratios of 100: 39: 11 at day 7 and 100: 34: 11 at day 20.
Image Analysis of Retrieved Capsules
100%, 50%, and 20% luciferase-expressing capsules were retrieved after 3 weeks implantation and compared to capsules kept in vitro for the same period. The cell viability of each group was almost 100% as evaluated by trypan blue exclusion examination. Images with the cooled CCD camera showed that the signal strength of in vitro capsules was 2-fold higher than in vivo capsules in the 100% luciferase-expressing group, while in the 50% and 20% luciferase-expressing in vitro groups the level was 4.0-fold and 8.8-fold higher versus in vivo, respectively (). This reflects a difference in cell growth inside the capsules between in vitro and in vivo capsules. When normalized to integrated light units per cell, there was no difference between in vitro and in vivo (): for 100%, 50%, and 20% luciferase-expressing cell groups, the normalized per cell ratio was 100: 60: 35 and 100: 48: 40 in vitro and in vivo, respectively (). This shows a relative increase in the 20% luciferase group signals compared to the theoretical 100: 50: 20 ratios.
Figure 5. Quantitative comparison of BLI signals from capsules containing different percentage of luciferase-expressing MDCK cells in vitro and in vivo. Capsules containing either 100%, 50% or 20% luciferase-expressing MDCK cells were cultured for 3 weeks in vitro or retrieved after 3-weeks implantation in mice. One hundred microliters of capsules were loaded into a 96-well plate and imaged for signal analysis (as integrated light units). The cell number was determined by AlamarBlue assay in the same capsules and the capsule numbers were counted after trypan blue staining. The integrated light units per capsule (A) and per cell (B) were calculated. The cells in the capsules were then released and lysed. The lysates were then assayed for luciferase activity and standardized by protein (C). For C, the initial levels of luciferase after microcapsule manufacture are also shown. The cell number per capsule is indicated in A above each bar. All assays were performed in triplicate with standard deviation indicated on the graphs.
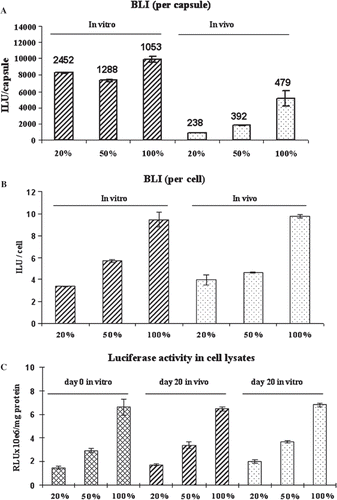
The encapsulated cells were released from the capsules and lysed and the luciferase activity in the lysate was assayed and standardized by mg protein (). Luciferase activity per mg protein was very consistent immediately after microcapsule manufacture and after 3 weeks in vitro or in vivo for the different groups. The ratio between 100%, 50% and 20% luciferase-expressing groups was 100:44: 22 before implantation (day 0 in vitro), 100: 53: 27 at day 20 in vivo and 10: 54: 29 at day 20 in vitro.
In vivo Imaging of Transplanted Microcapsules Enclosing pMONO-UbB-luci Transfected MDCK Cells
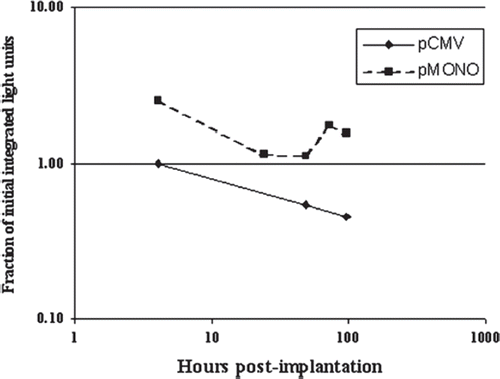
Expression of luciferase from pMONO-UbB-luci was very similar to that from pC3b-CMV-luci in vitro (data not shown). When pMONO-UbB-luci transfected MDCK cells were encapsulated and implanted into a mouse, the initial signal was 10-fold lower than that seen when pC3b-CMV-luci was used (150,000 versus 1,500,000 ILU) immediately after implantation, but the signal did not show a decrease over time ().
Figure 6. Quantitative comparison of BLI signals from capsules containing pMONO-UbB-luci and pC3b-CMV-luci transfected MDCK cells in vivo. Two groups of capsules containing 100% luciferase-expressing MDCK cells in which luciferase expression was driven by different promoters, UbB and CMV, were implanted into mice and imaged at different time points. Luciferase activity (y-axis) is expressed as fraction of initial level (within 30 minutes of implantation) to show the change over time.
DISCUSSION
The choice of BLI to develop a non-invasive method of monitoring implanted microencapsulated cells compared to other image modalities is based on several considerations. First, BLI is extremely sensitive. It allows for detection of even 2-20 cells in vitro and 100 cells in vivo [Citation28]. In addition, detection of luciferase expression can be enhanced by using a cooled CCD camera (as used in this study) rather than conventional CCD camera [Citation29]. Finally, this technology is relatively more economical and readily available compared to modalities such as MRI or CT, an important consideration for future developments. For primary studies of novel microcapsules, such as evaluations of different polymers or microcapsule formulations, encapsulation of luciferase-expressing cells could serve as a powerful indicator of microcapsule status. For therapeutic microcapsule experiments, the primary payloads of the microcapsules, of necessity, are cells expressing the therapeutic protein. This therapeutic protein may not be ideal to use as a biomarker for the microcapsules. While luciferase could be used as a cell marker by co-transfecting the therapeutic cells with the luciferase vector, it would be difficult to reproducibly achieve the same level of luciferase expression that way, making it difficult to compare different cell therapies. Microencapsulation allows different populations of engineered cells to be included in the same capsule (co-encapsulation) [Citation30]. In this way, the luciferase-expressing cells used as markers can be identical across groups of microcapsules containing different therapeutic proteins.
Our results have shown that microcapsules containing luciferase-expressing MDCK cells can be easily imaged by a cooled CCD camera, both in vitro and in vivo. Because the light produced by luciferase is ATP-dependent, only metabolically active cells contribute to the signal, showing an increase in signal intensity when cells proliferate and a decrease in signal when cells die. In order to investigate whether luciferase signal could be used to quantitatively analyze encapsulated cells, we co-encapsulated luciferase-expressing and non-expressing MDCK cells at different ratios. The results in vitro showed the luciferase signals were correlated with the absolute number of luciferase-expressing cells and the relative proportion per capsule (). In vivo results indicate that the relative proportion of luciferase-expressing cells per capsule is correlated with the signal from imaging at any particular time point (), but the overall luciferase signal decreased in this experiment after several weeks’ implantation. This could represent a decrease in overall microcapsule, and therefore cell survival, a specific decrease in cell survival within otherwise intact microcapsules, a down-regulation of luciferase expression without cell death, or a combination of the above.
It is difficult to retrieve 100% of implanted capsules, and without an independent method to monitor microcapsule survival such as MRI, overall microcapsule survival can be hard to ascertain. Generally, our experience is that approximately 75% of APA capsules implanted in mice can be retrieved as free-floating microcapsules from the peritoneum, with the remainder adhered to tissues or occasionally clumped together [Citation31]. Qualitatively, there was no noticeable difference in the number of retrieved micro-capsules in this study.
The in vitro measured luciferase activity in cell lysates (per mg protein, ) and in intact cells (per cell, ) was not significantly different whether the cells were kept in vitro or in vivo, indicating that no permanent down-regulation or loss of plasmid occurred in these cells. A series of publications have shown that the unmethylated bacterial or viral-derived CpG motifs which exist in the CMV promoter are immunostimulatory [Citation32–36]. When cationic lipid-plasmid DNA complex is delivered to mice, proinflammatory cytokines such as TNF-α, INF-γ, IL-6 and IL-12 increase [Citation37, Citation38] and the toll-like receptor 9 signal pathway will be activated, causing inactivation of the CMV promoter in vivo [Citation39]. CpG partially depleted or CpG-free plasmid DNA reduces the inflammatory response and allows sustained gene expression in vivo [Citation38, Citation40]. Our in vivo comparison of cells expressing luciferase under a CMV promoter versus a hybrid UbB promoter shows that use of the UbB promoter maintains the signal longer than the CMV promoter (). However, while the relative expression of luciferase from these two promoters was the same in vitro, the UbB promoter showed approximately 10-fold lower initial expression in vivo. This result was consistent with the reports from Cheng's group [Citation41].
To investigate whether the decrease in luciferase signal was simply a reflection of cell death, the capsules were retrieved after 20 days implantation and the cell viability was determined. It was found to be nearly 100% in all groups tested, yet the cell number per capsule was quite different between individual groups, with a consistently lower cell number per capsule in vivo versus in vitro (, bar labels). When compared to the pre-implantation number of cells/capsule 178±23, this likely means that the lower cell number was from decreased xenogeneic cell proliferation in vivo or possibly cell death that was not detected at 20 days (i.e. dead cells not visible). Recently, Sefton's group applied luciferase-expressing mouse fibroblasts L929 or xenogeneic Chinese hamster ovary (CHO) cells to monitor the cell viability after encapsulation [Citation42, Citation43]. They found that the bioluminescent signal from encapsulated cells peaked at day 21 and decreased gradually to the end of their experiment at day 35 in vivo, likely due to decreased viability associated with polyhydroxyethyl methacrylate-co-methyl methacrylate (HEMA-MMA) microcapsulation. Even though the permeability-selective membrane of APA capsules avoids the direct cell-to-cell contact of recipient immune mediators with implanted cells, various factors have been reported to trigger the host immune responses such as released xenoantigen from xenogeneic cells (such as the canine MDCK in this study) [Citation44], exposure of PLL [Citation45] and intracellular compounds released by necrotic cells confined in the capsules leading to host sensitization due to activation of NK-κB/Toll-like receptor pathway [Citation46–48].
In conclusion, bioluminescent imaging of micro-capsules containing luciferase-expressing cells reflects the cell viability and/or gene expression. It provides a non-destructive and non-invasive method of detecting and tracking encapsulated cell, both in vivo and in vitro, enabling us to obtain physical and biological information on the same mouse over time. Microcapsules containing as low as 20% luciferase-expressing cells are easily detected by cooled CCD imaging, and the quantitation of the signal reflects the number of viable cells in the microcapsules. In practical applications of this technique, careful matching of the luciferase expression system with the therapeutic gene expression system (i.e. using the same promoter and enhancer and the same cell type) will be important to get an accurate picture of in vivo expression.
Declaration of interest: The authors report no conflicts of interest. The authors alone are responsible for the content and writing of the paper.
REFERENCES
- al-Hendy, A., Hortelano, G., Tannenbaum, G.S., Chang, P.L. (1995). Correction of the growth defect in dwarf mice with nonautologous microencapsulated myoblasts–an alternate approach to somatic gene therapy. Hum. Gene. Ther. 6:165–175.
- Ross, C.J., Bastedo, L., Maier, S.A., Sands, M.S., Chang, P.L. (2000). Treatment of a lysosomal storage disease, mucopolysaccharidosis VII, with microencapsulated recombinant cells. Hum. Gene. Ther. 11:2117–2127.
- Hortelano, G., Al-Hendy, A., Ofosu, F.A., Chang, P.L. (1996). Delivery of human factor IX in mice by encapsulated recombinant myoblasts: a novel approach towards allogeneic gene therapy of hemophilia B. Blood. 87:5095–5103.
- Cirone, P., Bourgeois, J.M., Austin, R.C., Chang, P.L. (2002). A novel approach to tumor suppression with microencapsulated recombinant cells. Hum. Gene. Ther. 13:1157–1166.
- Lohr, M., Hoffmeyer, A., Kroger, J., Freund, M., Hain, J., Holle, A., Karle, P., Knofel, W.T., Liebe, S., Muller, P., Nizze, H., Renner, M., Saller, R.M., Wagner, T., Hauenstein, K., Gunzburg, W.H., Salmons, B. (2001). Microencapsulated cell-mediated treatment of inoperable pancreatic carcinoma. Lancet. 357:1591–1592.
- Shen, F., Poncet-Legrand, C., Somers, S., Slade, A., Yip, C., Duft, A.M., Winnik, F.M., Chang, P.L. (2003). Properties of a novel magnetized alginate for magnetic resonance imaging. Biotechnol. Bioeng. 83:282–292.
- Barnett, B.P., Arepally, A., Karmarkar, P.V., Qian, D., Gilson, W.D., Walczak, P., Howland, V., Lawler, L., Lauzon, C., Stuber, M., Kraitchman, D.L., Bulte, J.W. (2007). Magnetic resonance-guided, real-time targeted delivery and imaging of magnetocapsules immunoprotecting pancreatic islet cells. Nat. Med. 13:986–991.
- Ntziachristos, V., Yodh, A.G., Schnall, M., Chance, B. (2000). Concurrent MRI and diffuse optical tomography of breast after indocyanine green enhancement. Proc. Natl. Acad. Sci. U.S.A. 97:2767–2772.
- Hawrysz, D.J., Sevick-Muraca, E.M. (2000). Developments toward diagnostic breast cancer imaging using near-infrared optical measurements and fluorescent contrast agents. Neoplasia. 2:388–417.
- Tsien, R.Y. (1998). The green fluorescent protein. Annu. Rev. Biochem. 67:509–544.
- Heim, R., Tsien, R.Y. (1996). Engineering green fluorescent protein for improved brightness, longer wavelengths and fluorescence resonance energy transfer. Curr. Biol. 6:178–182.
- Hastings, J.W. (1996). Chemistries and colors of bioluminescent reactions: a review. Gene. 173:5–11.
- de Wet, J.R., Wood, K.V., DeLuca, M., Helinski, D.R., Subramani, S. (1987). Firefly luciferase gene: structure and expression in mammalian cells. Mol. Cell. Biol. 7:725–737.
- Contag, C.H., Bachmann, M.H. (2002). Advances in in vivo bioluminescence imaging of gene expression. Annu. Rev. Biomed. Eng. 4:235–260.
- Rehemtulla, A., Stegman, L.D., Cardozo, S.J., Gupta, S., Hall, D.E., Contag, C.H., Ross, B.D. (2000). Rapid and quantitative assessment of cancer treatment response using in vivo bioluminescence imaging. Neoplasia. 2:491–495.
- Lu, P.H., Negrin, R.S. (1994). A novel population of expanded human CD3+CD56+ cells derived from T cells with potent in vivo antitumor activity in mice with severe combined immunodeficiency. J. Immunol. 153:1687–1696.
- Edinger, M., Sweeney, T.J., Tucker, A.A., Olomu, A.B., Negrin, R.S., Contag, C.H. (1999). Noninvasive assessment of tumor cell proliferation in animal models. Neoplasia. 1:303–310.
- Sweeney, T.J., Mailander, V., Tucker, A.A., Olomu, A.B., Zhang, W., Cao, Y., Negrin, R.S., Contag, C.H. (1999). Visualizing the kinetics of tumor-cell clearance in living animals. Proc. Natl. Acad. Sci. U.S.A. 96:12044–12049.
- Edinger, M., Cao, Y.A., Verneris, M.R., Bachmann, M.H., Contag, C.H., Negrin, R.S. (2003). Revealing lymphoma growth and the efficacy of immune cell therapies using in vivo bioluminescence imaging. Blood. 101:640–648.
- Schmidt, E.V., Christoph, G., Zeller, R., Leder, P. (1990). The cytomegalovirus enhancer: a pan-active control element in transgenic mice. Mol. Cell. Biol. 10:4406–4411.
- Carmeliet, P., Jain, R.K. (2000). Angiogenesis in cancer and other diseases. Nature. 407:249–257.
- Wang, Y., Wang, G., O’Kane, D.J., Szalay, A.A. (2001). A study of protein-protein interactions in living cells using luminescence resonance energy transfer (LRET) from Renilla luciferase to Aequorea GFP. Mol. Gen. Genet. 264:578–587.
- Ray, P., Pimenta, H., Paulmurugan, R., Berger, F., Phelps, M.E., Iyer, M., Gambhir, S.S. (2002). Noninvasive quantitative imaging of protein-protein interactions in living subjects. Proc. Natl. Acad. Sci. U.S.A. 99:3105–3110.
- Cao, Y.A., Wagers, A.J., Beilhack, A., Dusich, J., Bachmann, M.H., Negrin, R.S., Weissman, I.L., Contag, C.H. (2004). Shifting foci of hematopoiesis during reconstitution from single stem cells. Proc. Natl. Acad. Sci. U.S.A. 101:221–226.
- Lowry, O.H., Rosebrough, N.J., Farr, A.L., Randall, R.J. (1951). Protein measurement with the Folin phenol reagent. J. Biol. Chem. 193:265–275.
- Li, A.A., MacDonald, N.C., Chang, P.L. (2003). Effect of growth factors and extracellular matrix materials on the proliferation and differentiation of microencapsulated myoblasts. J. Biomater. Sci. Polym. Ed. 14:533–549.
- Freshney, R. (1987). Culture of Animal Cells: A Manual of Basic Technique. Alan R. Liss Inc., New York, 117.
- Edinger, M., Cao, Y.A., Hornig, Y.S., Jenkins, D.E., Verneris, M.R., Bachmann, M.H., Negrin, R.S., Contag, C.H. (2002). Advancing animal models of neoplasia through in vivo bioluminescence imaging. Eur. J. Cancer. 38:2128–2136.
- Rice, B.W., Cable, M.D., Nelson, M.B. (2001). In vivo imaging of light-emitting probes. J. Biomed. Opt. 6:432–440.
- Cirone, P., Shen, F., Chang, P.L. (2005). A multiprong approach to cancer gene therapy by coencapsulated cells. Cancer. Gene. Ther. 12:369–380.
- Shen, F., Li, A.A., Cornelius, R.M., Cirone, P., Childs, R.F., Brash, J.L., Chang, P.L. (2005). Biological properties of photocrosslinked alginate microcapsules. J. Biomed. Mater. Res. B. Appl. Biomater. 75:425–434.
- Krieg, A.M. (1999). Direct immunologic activities of CpG DNA and implications for gene therapy. J. Gene. Med. 1:56–63.
- Krieg, A.M., Yi, A.K., Matson, S., Waldschmidt, T.J., Bishop, G.A., Teasdale, R., Koretzky, G.A., Klinman, D.M. (1995). CpG motifs in bacterial DNA trigger direct B-cell activation. Nature. 374:546–549.
- Klinman, D.M., Yi, A.K., Beaucage, S.L., Conover, J., Krieg, A.M. (1996). CpG motifs present in bacteria DNA rapidly induce lymphocytes to secrete interleukin 6, interleukin 12, and interferon gamma. Proc. Natl. Acad. Sci. U.S.A. 93:2879–2883.
- Sparwasser, T., Koch, E.S., Vabulas, R.M., Heeg, K., Lipford, G.B., Ellwart, J.W., Wagner, H. (1998). Bacterial DNA and immunostimulatory CpG oligonucleotides trigger maturation and activation of murine dendritic cells. Eur. J. Immunol. 28:2045–2054.
- Scheule, R.K., St George, J.A., Bagley, R.G., Marshall, J., Kaplan, J.M., Akita, G.Y., Wang, K.X., Lee, E.R., Harris, D.J., Jiang, C., Yew, N.S., Smith, A.E., Cheng, S.H. (1997). Basis of pulmonary toxicity associated with cationic lipid-mediated gene transfer to the mammalian lung. Hum. Gene. Ther. 8:689–707.
- Yew, N.S., Zhao, H., Wu, I.H., Song, A., Tousignant, J.D., Przybylska, M., Cheng, S.H. (2000). Reduced inflammatory response to plasmid DNA vectors by elimination and inhibition of immunostimulatory CpG motifs. Mol. Ther. 1:255–262.
- Yew, N.S., Zhao, H., Przybylska, M., Wu, I.H., Tousignant, J.D., Scheule, R.K., Cheng, S.H. (2002). CpG-depleted plasmid DNA vectors with enhanced safety and long-term gene expression in vivo. Mol. Ther. 5:731–738.
- Zhao, H., Hemmi, H., Akira, S., Cheng, S.H., Scheule, R.K., Yew, N.S. (2004). Contribution of Toll-like receptor 9 signaling to the acute inflammatory response to nonviral vectors. Mol. Ther. 9:241–248.
- Hyde, S.C., Pringle, I.A., Abdullah, S., Lawton, A.E., Davies, L.A., Varathalingam, A., Nunez-Alonso, G., Green, A.M., Bazzani, R.P., Sumner-Jones, S.G., Chan, M., Li, H., Yew, N.S., Cheng, S.H., Boyd, A.C., Davies, J.C., Griesenbach, U., Porteous, D.J., Sheppard, D.N., Munkonge, F.M., Alton, E.W., Gill, D.R. (2008). CpG-free plasmids confer reduced inflammation and sustained pulmonary gene expression. Nat. Biotechnol. 26:549–551.
- Yew, N.S., Przybylska, M., Ziegler, R.J., Liu, D., Cheng, S.H. (2001). High and sustained transgene expression in vivo from plasmid vectors containing a hybrid ubiquitin promoter. Mol. Ther. 4:75–82.
- Cheng, D., Lo, C., Sefton, M.V. (2008). Effect of mouse VEGF(164) on the viability of hydroxyethyl methacrylate-methyl methacrylate-microencapsulated cells in vivo: Bioluminescence imaging. J. Biomed. Mater. Res A. 87:321–31.
- Surzyn, M., Symes, J., Medin, J.A., Sefton, M.V. (2008). IL-10 secretion increases signal persistence of HEMA-MMA-microencapsulated luciferase-modified CHO fibroblasts in mice. Tissue. Eng. Part A. 15:127–36.
- Loudovaris, T., Charlton, B., Hodgson, R.J., Mandel, T.E. (1992). Destruction of xenografts but not allografts within cell impermeable membranes. Transplant. Proc. 24:2291–2292.
- Bunger, C.M., Gerlach, C., Freier, T., Schmitz, K.P., Pilz, M., Werner, C., Jonas, L., Schareck, W., Hopt, U.T., de Vos, P. (2003). Biocompatibility and surface structure of chemically modified immunoisolating alginate-PLL capsules. J. Biomed. Mater. Res. A. 67:1219–1227.
- Sauter, B., Albert, M.L., Francisco, L., Larsson, M., Somersan, S., Bhardwaj, N. (2000). Consequences of cell death: exposure to necrotic tumor cells, but not primary tissue cells or apoptotic cells, induces the maturation of immunostimulatory dendritic cells. J. Exp. Med. 191:423–434.
- Li, M., Carpio, D.F., Zheng, Y., Bruzzo, P., Singh, V., Ouaaz, F., Medzhitov, R.M., Beg, A.A. (2001). An essential role of the NF-kappa B/Toll-like receptor pathway in induction of inflammatory and tissue-repair gene expression by necrotic cells. J. Immunol. 166:7128–7135.
- Schneider, B.L., Schwenter, F., Pralong, W.F., Aebischer, P. (2003). Prevention of the initial host immuno-inflammatory response determines the long-term survival of encapsulated myoblasts genetically engineered for erythropoietin delivery. Mol. Ther. 7:506–514.