Abstract
The fiberoptical spatial filter anemometry (SFA) is a common technique based on an optical grid to measure the velocity of corpuscular components in a multiphase flow, e.g. in the microvessels. The technical innovation is the analysis of flow velocities using an optical grid sensor and frequency analysis by Fast Fourier Transformation (FFT). This study describes a non-invasive, on-line technique to measure RBCV in the microcirculation.
The sensor's validity was proven by in vitro measurements using a rotation disk of an exactly defined velocity with a correlation coefficient of 0,99967. For validation of RBCV measurements in the microcirculation in vivo, the setup was adapted to an intravital microscope. RBCV was measured in arterioles, capillaries, and postcapillary venules ranging from 8 - 140 μm diameter. As reference method for velocity measurements a computer assisted imaging system was used to measure the RBC-velocity in the identical vessels by frame to frame analysis. Both methods revealed a high significant correlation using transillumination technique for capillaries (r=0,986, p<0,001) and venules (r=0,952, p<0,001) as well as epiillumination technique (capillaries r=0,939, venules r=0,975, p<0,001).
INTRODUCTION
Intravital microscopy of microcirculation in different organs allows visualization of various parameters during both physiological and pathophysiological changes in the microvascular network. Using different fluorescence makers, parameters such as microvascular diameter, microvascular permeability for macromolecular tracers, leukocyte/endothelial cell interaction or leukocyte/thrombocyte/endothelial cell interactions, and local oxygen tension measurement can be quantitatively analyzed. For quantification of these parameters in the microcirculation, off-line analysis of video taped microscopic images using computer assisted imaging systems is indispensable [Citation1,Citation2].
The red blood cell velocity (RBCV) is one of the parameters of local tissue perfusion in the microcirculation. Various techniques have been employed to measure the RBCV in the microcirculation by intravital microscopy such as the off-line analysis of video images based on frame to frame analysis [Citation3,Citation4], flying spot technique [Citation5], streak image technique [Citation6], dual window method [Citation7], and spatial correlation. Online measurement techniques are the dual slit technique first described by Wayland et al.] and further developments of this technique [Citation9,Citation10] and the prism grating [Citation11]. A similar comparable technique to the SFA has been described before using a linear array of photodiodes in odds and even orders and the frequency analysis was performed by the differential current between the two orders [Citation12].
So far, continuous measurement of the absolute red blood cell velocity (RBCV) in intravital microscopy independent of fluorescent markers and simultaneously with video tape imaging of a defined region of interest has not been described. Disadvantages of the off-line analysis of the established video analysis systems until now has been the limited number of 50 video frames per second, thus impeding the analysis of RBC-velocities above 2 mm/s as found in arterioles and postcapillary venules exceeding diameters of 60 μm and optical magnification of microscopic pictures of 20- or 40-fold. Measurements of RBC-velocities above 2 mm/s were achieved with image-intensified high-speed (1000 frames/s) video camera systems [Citation13]. Accurate determination of RBC-velocity is required to assess local tissue perfusion, calculation of shear forces within single vessels, and calculation of oxygen delivery to tissues in combination with measurement of the microhematocrit.
The objective of the current study was to evaluate the accuracy of the spatial filter anemometer (SFA) and analysis of frequency spectra by FFT in vitro and adapt the setup for intravital microscopy with simultaneous use of fluorescent markers and video tape imaging. The potency of this new technique to measure the RBCV in transillumination and epiillumination mode in vivo has been evaluated and the limitations and potential for further development are described.
MATERIALS AND METHODS
Fiber optical SFA (patent no. DD 243 119 A1) is based on an optical principle to measure the velocity of corpuscular components in a multiphase flow as represented by red blood cells in the blood flow. The theoretical background has been described previously by Petrak et al. [Citation14] and the technical setup is illustrated in .
Figure 1. Schematic setup of the spatial filter anemometer for measurement of velocities of corpuscular particles in a multiphase flow pattern. Glass fibers of circuitry A and B function as the photo sensor differential grid, glass fibers C as transmitters of the light-emitting diode for exact positioning of the sensor. For details see text.
Anemometry: The fiber optical sensor (OECA GmbH, Berlin, Germany) is a geometrical model of 24 glass fibers in a row (). By paralleling the circuitry of fibers from groups A and B an optical grid structure is obtained. The distance between the fibers of groups A and B is 500 μm and represents the grid constant. Each fiber has a diameter of 50 μm (with jacket 125 μm). Fibers of groups A and B were each connected to a photodiode (SFH202, Siemens, Nürnberg, Germany) as photosensor, with a maximum photosensitivity at a wavelength of λSmax = 850 nm. By combining grids A and B with a shift of one half of the grid constant, a differential grid structure is built up, allowing the elimination of light interference from other light sources, thus reducing the background noise of the measurements. Fibers of group C are connected to a light-emitting diode (λ = 680 nm) for exact positioning of the sensor over the region of interest, e.g. over a blood vessel.
Changes of light reflection as a result of passing particles along the grid structure of the fiber optical sensor are transformed into electrical signals and enhanced by an adjustable amplifier with optional high pass (10 and 60 Hz) and low pass filters (1 kHz, FZM, Flöha, Germany). Signals are transferred to a personal computer via analog/digital transformation (STE 611-16MF/L, Stemmer PC, Puchheim, Germany). The computer software (TurboLab™, Version 4.2) was obtained from Stemmer Software (Eichenau, Germany). A special developed software (AMC, Chemnitz, Germany) was designed for the software environment of LabWindow™ (CVI Version from National Instruments, USA).
Calculation of particle velocity is performed by the following formula:  where represents the velocity of particle, fo frequency, g grid constant and M the magnification.
Since any periodic waveform can be represented as the sum of an infinite number of sinusoidal and cosinusoidal terms, together with a constant term, a discrete Fourier transformation can be used. In turbulent flow patterns as described for RBCV in branching vessels the non-periodic wave form of frequency spectra gained by SFA can be analyzed using the Fast Fourier transformation (FFT). The velocity of red blood cells is calculated as mean value or as function over time. This allows for the analysis of flow changes within seconds.
In vitro measurements: The technique and setup were assessed in vitro using a glass fiber (Ø 85 μm) fixed on a rotating disk mounted to an electrical motor (60 – 360 rph, VEB Prüfgerätewerk, Dresden, Germany) for calibration of this technique for velocities ranging from 0,0-320 mm/s. Measurement of corpuscular flow velocities was carried out with a transparent polyethylene tube (inner diameter 1000 μm, B. Braun, Melsungen) flushed with distilled water containing glass particles with a diameter less than 70 μm (Glasbeads GmbH, Lauscha, Germany). The flow profile was analyzed by longitudinal positioning of the fiber optical sensor over the cross-section of the polyethylene tube.
In vivo measurements: For intravital microscopy the SFA-sensor was integrated in the ocular of a microscope (Zeiss Axiotech vario 100 HD, Acroplan 40x/0,5 W, Zeiss, Oberkochen, Germany). To avoid light reflexes of the positioning light diode signals the filters were angled with an element of 15 degrees (Zeiss, Oberkochen, Germany). The microvasculature was observed using either the technique of epiillumination or with transillumination.
For transillumination a 6 V, 10 W DC halogen lamp (FW01, Wenglor, Tettnang, Germany) was used as light source. A direct current electrical source (Technical University Munich, Department for Electro-Engineering, Germany) was needed to exclude interference of the frequency spectra generated by the passing RBCs. To allow simultaneous measurement of RBCV by SFA and video recording, a microscope tube was used with partition of the light to 30% returning to the ocular and thus to the SFA-sensor and 70% of the light intensity to the video camera. Intravital microscopic pictures were simultaneously recorded to S-VHS video tapes via video camera (charge coupled device video camera, CCD-camera, FK 6990 IQ-S, Piper, Schwerte). S-VHS video tapes (video recorder SVO-9500 MDP, Sony, Cologne, Germany) and velocity analyzed off-line with a computer assisted imaging system (CAMAS, Zeintl, Heidelberg, Germany) [Citation1] by frame to frame analysis. At least 10 measurements were made of each sequence and the mean was taken for correlation of the identical vessels with the velocity measurements obtained by spatial filter anemometry. RBCV was assessed in arterioles, capillaries, and postcapillary venules with diameters ranging from 5 to 130 μm in the skin fold chamber preparation of the awake Syrian golden hamster [Citation15,Citation16].
Epiillumination was performed after staining the plasma for contrast enhancement by injecting 0,05 ml of fluorescein isocyanate-labeld dextran (5% FITC-Dx, MW 150.000, Sigma, St. Louis, MO, USA). This marker was used in conjunction with the Zeiss filter set 09 (BP 450-490, FT 510, LP 520). FITC staining of plasma allows the offline analysis off video tapes by frame to frame analysis. A simultaneous measurement with SFA and recording to the video tapes was not possible in this setup due to the reduced light intensity after partition of the reflected light in the optic system of the microscope. Therefore measurements by SFA and video-recording had to be performed in sequence, starting with the first 50% by SFA and the latter 50% with microscopic imaging to video tape.
Animal model: Syrian golden hamsters (n=21) weighing 50 – 70 g (Charles River, Sulzfeld, Germany) were kept under acclimated conditions with free access to tap water and pellet food ad libitum. Experiments were approved by the local ethical committee and performed according to the NIH guidelines for the care and use of laboratory animals [Citation17]. The dorsal skin fold chamber in awake Syrian golden hamsters [Citation15,Citation16] was used for investigation of the microcirculation. The chamber implantation was performed 48 – 72 h prior to the experiment under ketamine/xylazine anesthesia (130/20 mg/kg BW ip.). Polyethylene catheters (Portex, Hythe, UK) were inserted into the jugular vein and carotid artery for monitoring of mean arterial pressure (MAP), heart rate (HR), and arterial blood gases.
Statistics: Correlation was statistically analyzed with the Pearson procedure (SigmaStat 1.0, Jandel Corporation, San Rafael, CA, USA). The linear regression is calculated by the following formula: y=b0+b1×x, where y is the dependent variable, x is the independent variable, b0 is the constant, or intercept (value of the dependent variable when x = 0, the point where the regression line intersects the y axis), and b1 is the slope (increase in the value of y per unit increase in x).
RESULTS
In vitro measurements: To validate the technical setup, in vitro measurements were performed using a rotating disk. Measurements with the rotating disc at defined speeds revealed a significant correlation with a correlation coefficient of 1,00 (p<0,001, Pearson Correlation Test) for velocities ranging from 0,0 mm/s to 320,0 mm/s (). The intercept with the x axis is 0,0087 mm/s and the slope has an angle of 44,43° degree (tangens 44,43 = 0,9806). The ideal situation would be an intercept of exactly zero and an angle of the regression line of 45,0° degrees. The standard error of estimate is 2,556 (). To quantify the standard error of the velocity measurement using the rotating disc, continuous analysis of the velocity was performed and 200 datasets were acquired during a period of 666 seconds at a speed of 0,604 mm/s. The mean velocity was 0,593±0,010 m/s and the median 0,589 mm/s. Since the disc needs exactly 10 seconds for one rotation and the frequency for the measurement is 1 HZ, every tenth dataset was calculated. The mean velocity was 0,600±0,007 mm/s and the median 0,596 mm/s.
Figure 2. Calibration curve (A) with rotating disk (RD) (n=30) and flow profile curve (B) (n=5) technique (dependent variable = intercept + (slope*independent variable, r = correlation coefficient, Pearson test).
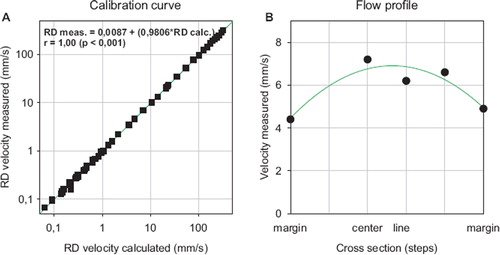
Table 1. Statistical analysis of the linear regression of calculated velocity versus measured velocity using the rotating disk method.
Measurements of the corpuscular bodies in a model of laminar flow, as represented by a transparent polyethylene tube flushed with distilled water containing glass particles with a diameter below 70 μm, showed a parabolic flow profile with a decrease of particle velocity to the marginal flow ().
In vivo measurements: Using the transillumination technique RBC-velocities were measurable in a range from 0,75 mm/s to 11,66 mm/s (). Since velocity measurements by video tape frame-to-frame analysis is of a poor reliability at RBCVs above 2 mm/s, the correlation between this two methods is low with a correlation coefficient of 0,757, an intercept of 0,482, and a slope of 0,420 (). In contrast to the results of the arteriolar RBCV correlation were the coefficients of the measurements in capillaries and venules. For capillaries, RBCVs were measured in between 0,02 mm/s up to 0,69 mm/s (). The calculated correlation coefficient is 0,986 (p<0,001 Pearson test) with an intercept of -0,002 and a slope of 1,075. The analysis of the data from postcapillary venules calculated a correlation coefficient of 0,952 (p<0,001 Pearson correlation test) and an intercept of -0,034 with a slope of 0,879 (). The measured range of RBCV was from 0,14 mm/s to 2,35 mm/s. Again the slope above 1,00 accounts for inaccuracy of the video tape analysis for RBCV above 2,00 mm/s.
Figure 4. Correlation plots of red blood cell velocity (RBCV) measured by spatial filter anemometry (x-axis represents SFA) versus computer assisted imaging system (y-axis represents CAMAS) by frame to frame analysis by transillumination technique (dependent variable = intercept + (slope*independent variable, r = correlation coefficient, Pearson test).
Table 2. Transillumination measurements of RBC-velocity in arterioles, capillaries and venules evaluated by spatial filter anemometer (SFA) or by CAMAS; the measurements in arterioles, capillaries, and venules are measured for every single vessels at the same time.
The analysis of the RBCV in epiillumination technique is given in the following: RBCV in analyzed arterioles ranged from 0,41 mm/s to 8,72 mm/s measured with SFA and the maximum of calculated RBCV (). A correlation coefficient of 0,854 (p<0,001) was again poor comparing the data of SFA versus video tape analysis. The intercept is calculated with 0,625 and a slope of 0,518 (). More convincing are the calculated RBCVs in capillaries ranging between 0,04 mm/s and 0,86 mm/s and postcapillary venules with RBCVs from 0,21 mm/s to 1,86 mm/s (). The correlation coefficient for capillaries is 0,939 (p<0,001), the intercept 0,026, and the slope 0,886. For postcapillary venules, the calculated intercept is 0,01, the slope 1,058 with a correlation coefficient of 0,975 ().
Figure 5. Correlation plots of red blood cell velocity (RBCV) measured by spatial filter anemometry (SFA) versus computer assisted imaging system (CAMAS) by frame to frame analysis by epiillumination technique (dependent variable = intercept + (slope*independent variable, r = correlation coefficient, Pearson test).
Table 3. Epiillumination measurements of RBC-velocity in arterioles, capillaries, and venules evaluated by spatial filter anemometer (SFA) or by CAMAS.
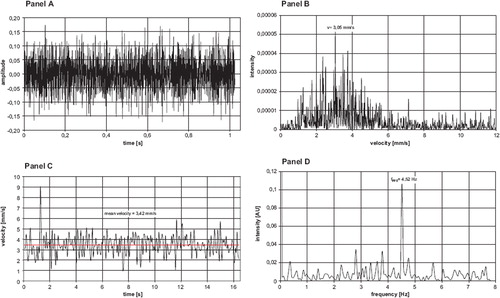
is an example of the analysis of the acquired signals by the velocity measurements as shown in an arteriole of the dorsal skin fold chamber preparation. Panel A is one representative signal obtained during the measurement period. Panel B represents the FFT of all obtained signals, thus calculating the RBCV of 3,05 mm/s for this arteriole during the period of measurement. Panel C demonstrates the time dependency of the RBC-velocities during the whole measurement period and the mean RBCV is 3,42 mm/s. Panel D is the analysis of flow motion changes during the whole measurement period of 16 seconds. These changes have a periodicity of 4,52 Hz (f1), i.e. 271 periodic flowmotion changes per minute.
Figure 6. Spectrum of frequency and spectrum of velocity in a representative arteriole in the striated skin muscle of the hamster (magnification 40 fold). Panel A represents the clipping of the time signal and the amplitude of measured light intensity during one second. Panel B indicates the signal intensity after Fast Fourier Transformation - the maximum intensity is found at 3,05 mm/s during the one second in clipping of Panel A. Panel C demonstrates the time dependency of the RBC-velocities during the whole measurement period of 16 seconds. Panel D indicates the periodicity of the velocities with a maximum frequency of flowmotion changes at 4,52 Hz during these 16 seconds.
Panel A represents a signal spectrum of the RBCVs in a postcapillary venule. Panel B shows the analysis of the RBCV after FFT with a maximum intensity of the signals for the velocity of 1,8mm/s. Panel C demonstrates a clipping of the time dependency of the RBC-velocities during a measurement period of 3 seconds with a mean velocity of 1,55 mm/s.
Figure 7. Spectrum of frequency and spectrum of velocity in a representative venule in the striated skin muscle of the hamster (magnification 20 fold). Panel A represents the clipping of the time signal and the amplitude of measured light intensity during one second. Panel B indicates the signal intensity after Fast Fourier Transformation - the maximum intensity is found at 1,8 mm/s during the one second in clipping of Panel A. Panel C demonstrates the time dependency of the RBC-velocities during a measurement period of 3 seconds with a mean velocity of 1,55 mm/s. Panel D indicates the periodicity of the velocities in a venule during the whole measurement period of 60 seconds. Flowmotion changes were found at f1 = 0,61 Hz, f2 = 2,41 Hz and f3 = 6,41 Hz. f1 could be assigned to the intrinsic flowmotion changes with rate of 37/min, f2 to the respiratory rate of 128/min and f3 to the heart rate of 384/min in the hamster.
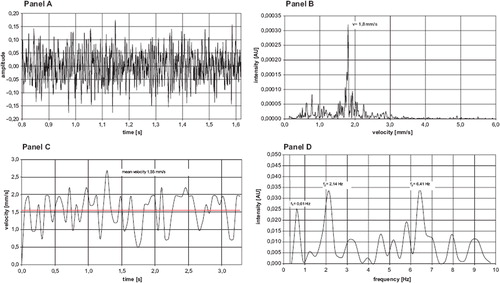
In Panel D the analysis of the flow pattern and the periodicity revealed the distinguishable peaks: The analysis of the flow pattern and the periodicity revealed three distinguishable peaks: the peak of 2,41 Hz could be assigned to the respiratory rate of 128/min, and the heart rate of 384/min is represented by the peak at 6,41 Hz. The idiochronous flow-pattern of the postcapillary venule is represented by the frequency peak at 0,61 Hz, i.e. a change of velocities at a rate of 36/min. These results might correlate with a flow motion pattern of RBCV in arterioles, but cannot be correlated by frame to frame analysis of the video tape images because of the poor reliability measuring RBCV in arterioles.
DISCUSSION
The present study investigated a new method for on-line velocity measurement of red blood cells in the microcirculation in an intravital microscopy system. The method used is spatial filter anemometry (SFA), which is a common optical method to measure the velocity of corpuscular bodies in a multiphase flow is represented by the blood flow in arterioles, capillaries, and venules.
Devices for velocity sensing with an optical slit, grating, or array technique are widespread in industrial applications for measurements of velocities of suspensions, particles, or aerosol or, for example, image sensing in photography [Citation18]. The spatial filter technique allows a contactless velocity measurement, even in turbulent flow profiles such as vortices and boils as given in vortices of coal power plants [Citation19]. The combination of charge coupled device (CCD) video camera systems and remote velocity measurements by spatial filter technique are established in measurement instrumentation [Citation20]. The principals of these techniques are the registration of bright-dark modulations using the grid structure of the sensor. The suppression of background noise during measurement is of imminent importance to avoid false frequency spectra, thus calculating false velocities. To achieve optimal signal/noise ratios the photosensor is designed as a differential grid structure.
A comparable technique is the optical Doppler velocimeter, a system on the principle of a differential grating to translate red blood cell movement to light intensity variations and to derive average velocity the average frequency determination of the amplified signal is performed with a thresholding frequency-to-voltage functional block [Citation21]. In contrast to this technique, the SFA needs no additional grating cube, which reduces light intensity and signal analysis a second time after the beam splitter. The SFA allows by Fast Fourier transformation a more complex frequency analysis independent of hardwire adaptations.
The preceding technique of the SFA is the dual slit for measurement of the RBCV in vivo. This application of this technique in intravital microscopy was first described by Wayland et al. [Citation8] and underwent further developments [Citation9,Citation10]. The principle of this technique is the transillumination of the vessels of interest and projection of the image onto a screen with two slits or two photodiodes. The signals are cross-correlated and the RBCV calculated. In contrast, the optical photo sensor of SFA technique combines a linear array of 24 glass fibers in a grid structure, thus obtaining a higher signal density. The online Fast Fourier transformation analysis of the signals is nowadays possible with ordinary personal computers. The FFT dissects the acquired signals and allows in short measurement periods the analysis of the frequency spectra. This allows not only the assessment of the RBCV, but also flowmotion changes due to respiration or pulsatile flow. Another similar described technique is a periodic differential detector using a linear array of photodiodes. The photocurrent from odd-ordered diodes is summed, photocurrent from even-ordered diodes is summed, and a signal proportional to the difference between these two currents is produced by a differential amplifier [Citation12]. Advantages of the SFA technique is no obstruction of the visual field in the microscope by beveled mirror and the easily adaptation of the photosensor array of the SFA in any direction.
It would have been desirable to compare one of the two above described techniques or the dual slit techniques in this experimental setup but this would have reduced light intensity for each method to a to a marginal value making the measurements invalid.
Comparing the optical SFA with common laser Doppler techniques, SFA has advantages: it is not necessary to apply any local pressure on the probe since no direct contact to the probe is needed. A calibration is not necessary due to the grid constant. The LDA is eligible for spot-like measurements; there are needs for high power light sources and expendable optics for larger grid structures [Citation22].
The current study has proved that SFA technique can be adapted and integrated to an intravital microscope and RBCV is measurable in real-time at preset time points of an experiment. The time requirements are dependent of the signal intensity and RBCV. Higher RBCV requires less time for a measurement, e.g in arterioles only a few seconds. As a perspective to expand the field of application, measurement of longer time periods gives a possibility to assess flowmotion changes in the microcirculation. Measuring for longer periods of time such as 60 s, it is possible to distinguish changes of flowmotion in arterioles and venules, as has been described before by laser Doppler flow monitoring in a model of the hamster cheek pouch [Citation23]. This flowmotion correlates with vasomotion, which is suggested to be an important parameter in local tissue oxygenation [Citation24]. Our measurements indicate that spatial filter anemometry is suitable to measure online flowmotion changes in arterioles.
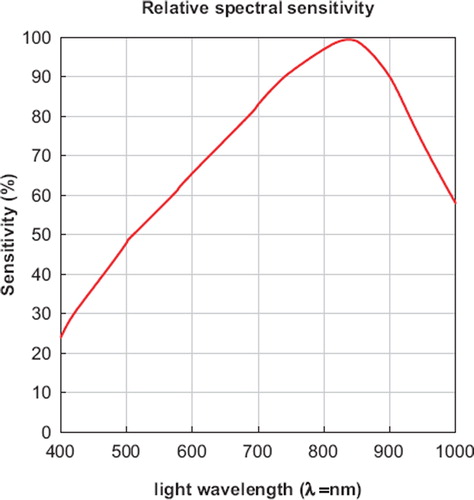
The major impediment of the technique is the currently restricted spectral sensitivity of the light sensor to a peak maximum of 850 nm, which is in the near infrared spectrum (). The nowadays generally applied fluorescence markers for intravital fluorescence microscopy have an emission wave length of 518 to 640 nm (Rhodamine 6G 530 nm, FITC-Dextran 518 nm, Acridine Orange 530/640 nm (source Sigma-Aldrich Corp., St. Louis, USA). A light sensor with a sensitivity maximum in the range of 518 to 530 nm appears therefore desirable to improve the yield of reflected light as a pre-requisite to diminish phototoxic side-effects in the epiillumination technique. The currently used photodiode has 50% of its relative spectral sensitivity at a wave length of 520nm (). The light source used in epiillumination is still in the range of the light intensity used in common fluorescence microscopy, but efforts should be made to reduce the applied light energy to a minimum [Citation25].
Figure 3. Relative spectral sensitivity of the Siemens photodiode (SFH202) with its peak maximum at a wavelength of light of 850 nm (Siemens AG, Munich, Germany).
Nevertheless, a potential error source of this technique is low signal intensity levels. The signal/noise ratio changes with the intensity of light illumination and special regards have to be made for epiillumination techniques, since light intensity is less compared to transillumination. The next development step should be a highly sensitive photosensor detecting the reflected fluorescence light of corpuscular elements marked with a fluorescence dye. This would enable the investigator to differentiate velocities for example of leukocytes, thrombocytes, or erythrocytes.
Another distinct error source for velocity determinations is movements of the specimen. These are easily recognized by the frequency spectra and increase of background noise and visual control of the intravital microscopy pictures.
The commonly used technique of velocity measurement in intravital microscopy is currently the off-line analysis of video-tape images because no additional technique is required, therefore there are no additional costs. These measurements are manually performed by an investigator or the dual slit method is applied offline to video tapes. Manual measurement is a time-consuming process and investigator-dependent, because of a learning curve. The bias of investigator must be excluded by blind evaluation and the reproducibility is limited. Therefore efforts have been made to objectify these measurement techniques and computer assisted imaging systems have been developed to analyze videotapes offline (Camas, Zeintl, Heidelberg, [Citation1]). These systems require the use of fluorescence dyes for contrast enhancement to analyze RBCV. Under conditions of ischemia-reperfusion of tissues or during hemorrhagic or septic shock, these methods can be affected due to the extravasation of the fluorescence dyes increasing blurry images. SFA is not dependent on the fluorescence markers and can use a light spectrum far from the excitation wave length if the contrast is reduced to extravasation. The SFA technique allows a real-time online-measurement of RBCV without the time-consuming off-line analysis of video tapes and is not restricted to velocities below 2 mm/s due to 50 frames per second.
Since the grid constant is an important parameter to calculate RBCV, it is important to construct a photo sensor with precise spacing to ensure a maximum accuracy of the velocity measurement. The grid constant of the photo sensor is 500 ± 7,5 μm. The theoretically calculated changes of velocity range at a preset RBCV of 1 mm/s from 0,985 to 1,015 and at a preset velocity of 20 mm/s from 19,7 to 20,3 mm/s (calculated for a magnification of 40 fold). This calculation assumes the maximal theoretical possible error in the grid structure with all photo-sensors in the same position (grid constant 507,5 μm or 492,5 μm). Since this scenario is very unlikely to happen, the accuracy of the system in practice can be assumed much higher.
A wide field of application of intravital microscopy is the pathophysiological changes in hemorrhagic shock and resuscitation on the microcirculation. In clinical applications as blood substitutes are isotonic saline, hyperoncotic colloid solution, or erythrocyte concentrates. In experimental research are modified stromafree hemoglobin-based oxygen carriers or perfluorocarbons solutions. Except for erythrocyte concentrates, all other blood substitutes lead to a decrease of macro- and microhematocrit. The decrease of the macrohematocrit due to hemodilution is not directly proportional to the decrease of the microhematocrit in precapillary arterioles, capillaries, and postcapillary venules. The hemodilution to a systemic hematocrit of 18 ± decreases the number of blood cells in the capillary vessels to one half of baseline levels [Citation26]. The dual slit technique is applicable at these systemic hematocrit levels and provides reproducible results [Citation27]. From these data it can be assumed that the SFA technique provides valid data at these hematocrit levels. Since the principle of the SFA is the measurement of the velocity of corpuscular components of blood, i.e. primarily the red blood cells, the SFA is not applicable in experimental setup with total exchange transfusion, i.e. a systemic hematocrit of zero. The crucial microcirculatory parameters under these conditions are the local tissue oxygenation and functional capillary density [Citation28]. Artificial red blood cell substitutes, e.g. hemoglobin vesicles or polyhemoglobin, range in particle size from 80 to 250 nm [Citation29]. The currently used magnification of 40x-fold is not suitable to distinguish particle sizes below the size of erythrocytes, thus these optical sensors are not capable for valid velocity measurements of nano particles.
In the clinical setup, techniques currently available for studying the microcirculation of the skin non-invasively in humans are the laser Doppler flowmetry, vital capillaroscopy, dynamic capillaroscopy, orthogonal polarization spectral imaging, and fluorescence microscopy. These techniques are used in clinical practice for studying the regional microcirculation in patients with systemic diseases; for example, hypertension, hypotension, and under conditions of ischemia/reperfusion. Parameters are vasomotion, RBCV velocity, and local perfusion [Citation30–33]. In these approaches SFA might be useful to combine intravital fluorescence microscopy and RBCV-measurements to allow simultaneous assessment of regional microcirculatory changes under pathological conditions.
Declaration of interest: The authors report no conflicts of interest. The authors alone are responsible for the content and writing of the paper.
References
- Zeintl, H., Sack, F. U., Intaglietta, M., Messmer, K. (1989). Computer assisted leukocyte adhesion measurement in intravital microscopy. Int. J. Microcirc. Clin. Exp. 8: 293–302.
- Klyscz, T., Jünger, M., Jung, F., Zeintl, H. (1997). Cap Image - a new kind of computer-assisted video image analysis system for dynamic capillary microscopy. Biomed. Tech. Berl. 42(6):168–175.
- Slaaf, D. W., Jeurens, T. J., Tangelder, G. J., Reneman, R. S., Arts, T. (1986). Methods to measure blood flow velocity of red blood cells in vivo at the microscopic level. Ann. Biomed. Eng. 14 (2): 175–186.
- Bloch, E. H. (1962). A quantitative study of the hemodynamics in the living microvascular system. Am. J. Anat. 110 (3): 125–153.
- Tyml, K., Ellis, C. G. (1982). Evaluation of the flying spot technique as a television method for measuring red cell velocity in microvessels. Int. J. Microcirc. Clin. Exp. 1 (2): 145–155.
- Munro, P. A. G. (1966). Advances in Optical and Electron Microscopy, Academic Press New York, 1–40.
- Kiesewetter, H., Radtke, H., Korber, N., Schmid-Schonbein, H. (1982). Experimental calibration of a two-stage prism-grating system for measuring cell velocity. Microvasc. Res. 23 (1): 56–66.
- Wayland, H., Johnson, P. C. (1967). Erythrocyte velocity measurement in microvessels by a two-slit photometric method. J. Appl. Physiol. 22 (2): 333–337.
- Silva, J., Intaglietta, M. (1974). The correlation of photometric signals derived from in vivo red blood cell flow in microvessels. Microvasc. Res. 7 (2): 156–169.
- Arfors, K. E., Bergqvist, D., Intaglietta, M., Westergren, B. (1975). Measurements of blood flow velocity in the microcirculation. Ups. J. Med. Sci. 80 (1): 27–33.
- Slaaf, D. W., Rood, J. P., Tangelder, G. J., Jeurens, T. J., Alewijnse, R., Reneman, R. S., Arts, T. (1981). A bidirectional optical (BDO) three-stage prism grating system for on-line measurement of red blood cells velocity in microvessels. Microvasc. Res. 22 (1): 110–122.
- Fleming, B. P., Klitzman, B., Johnson, W. O. (1985). Measurement of erythrocyte velocity by use of a periodic differential detector. Am. J. Physiol. 249 (4 Pt 2): H899–905.
- Ishikawa, M., Sekizuka, E., Shimizu, K., Yamaguchi, N., Kawase, T. (1998). Measurement of RBC velocities in the rat pial arteries with an image-intensified high-speed video camera system. Microvasc. Res. 56 (3): 166–172.
- Petrak, D., Przybilla, E., Astalosch, F., Kämpfe, L., Hädrich, T. (1989). Fiberoptical spatial filter anemometry, a local measuring technique for multiphase flows. Techn. Messen. tm. 56: 72–83.
- Endrich, B., Asaishi, K., Götz, A., Messmer, K. (1980). Technical report - a new chamber technique for microvascular studies in unanesthetized hamsters. Res. Exp. Med. Berl. 177: 125–134.
- Nolte, D., Menger, M. D., Messmer, K. (1995). Microcirculatory models of ischemia-reperfusion injury in skin and striated muscle. Int. J. Microcirc. Clin. Exp. 15 (Suppl. 1): 9–16.
- NIH. (1985). Guide for the Care and Use of Laboratory Animals.
- Ator, J. T. (1963). Image-velocity sensing with parallel-slit reticles. J. Optical. Soc. 1-12-53 (12): 1416–1422.
- Fiedler, O., Labahn, N., Müller, I., Christofori, K. (1994). Halbleiterbildsensor als Ortsfiltersonde - ein Verfahren zur Messung lokaler Partikelgeschwindigkeiten in zirkulierenden Wirbelschichten. Chem. Ing. Tech. 66 (1): 79–82.
- Dietmayer, K. (1994). On the precision of the remote 2D velocity measurement using CCD sensors. OPTO94 Kongressband, 304–310.
- Borders, J. L., Granger, H. J. (1984). An optical doppler intravital velocimeter. Microvasc. Res. 27 (1): 117–127.
- Fiedler, O., Schulz, K. P., Christofori, K. (1988). Spatial filter anemometry for velocity measurement with a CCD-camera. MSR (Messen,Steuern, Regeln) Berlin 31: 205–209.
- Colantuoni, A., Bertuglia, S. (1997). Correlation between laser Doppler perfusion monitoring and hematocrit in hamster cheek pouch microcirculation. Int. J. Microcirc. Clin. Exp. 17 (1): 33–40.
- Tsai, A. G., Intaglietta, M. (1993). Evidence of flowmotion induced changes in local tissue oxygenation. Int. J. Microcirc. Clin. Exp. 12: 75–88.
- Steinbauer, M., Harris, A. G., Abels, C., Messmer, K. (2000). Characterization and prevention of phototoxic effects in intravital fluorescence microscopy in the hamster dorsal skinfold model. Langenbecks. Arch. Chir. 385: 290–298.
- Sarelius, I. H. (1989). Microcirculation in striated muscle after acute reduction in systemic hematocrit. Respir. Physiol. 78: 7–17.
- Cabrales, P., Tsai, A. G., Intaglietta, M. (2008). Isovolemic exchange transfusion with increasing concentrations of low oxygen affinity hemoglobin solution limits oxygen delivery due to vasoconstriction. Am. J. Physiol Heart Circ. Physiol 295 (5): H2212–H2218.
- Nolte, D., Zeintl, H., Steinbauer, M., Pickelmann, S., Messmer, K. (1995). Functional capillary density: an indicator of tissue perfusion? Int. J. Microcirc. Clin. Exp. 15 (5): 244–249.
- Chang, T. M. (2006). Evolution of artificial cells using nanobiotechnology of hemoglobin based RBC blood substitute as an example. Artif. Cells Blood Substit. Immobil. Biotechnol. 34 (6): 551–566.
- Brauer, K., Hahn, M. (1999). Nonlinear analysis of blood flux in human vessels. Phys. Med. Biol. 44 (7): 1719–1733.
- Fagrell, B. (1986). Microcirculatory methods for the clinical assessment of hypertension, hypotension, and ischemia. Ann. Biomed. Eng. 14 (2): 163–173.
- Einav, S., Berman, H. J., Fuhro, R. L., DiGiovanni, P. R., Fine, S., Fridman, J. D. (1975). Measurement of velocity profiles of red blood cells in the microcirculation by laser doppler anemometry (LDA). Biorheology. 12 (3-4): 207–210.
- Messmer, K. (2000). Orthogonal Polarization Spectral Imaging - A new tool for the observation and measurment of the human microcirculation. Progress in Applied Microcirculation (24): 1–122.