Abstract
Background: Principally 80 percent of the malignant oral tumors are the Oral Squamous Cell Carcinoma (OSCC), which require quantities of such sacrifices as deformity, malfunction, recurrence, metastasis, deterioration, and mortality in common cases of failing to antedate diagnosis. Similarly critical is the Oral Leukoplakia (OLK) among precancerous lesions of oral mucosa. It would also be of interest for scholars and clinicians to target the discrimination as seizing up OLK intimate to OSCC. Objective: Through bioinformatics technology, the research in narration worked to establish a three-dimensional discriminate database from high throughput data of protein fingerprints from serum, saliva, and tissue samples of OSCC and OLK patients as a preliminary step towards integrated group proteins biomarker discovery and to further understanding of corresponding tumorgenesis and proteomics. Methods: Differential proteomic patterns in serum, saliva, and tissue between OSCC patients or OSCC tissues and OLK were detected by SELDI-TOF-MS technology, and discriminatively analyzed by ZUCI-PDAS (Zhejiang University Cancer Institute ProteinChip Data Analysis System) with Support Vector Machines (SVM) and cross validation. Additionally, Laser Capture Micro-dissection technology was utilized in the tissue research. Results: Mass/charge proteomes of optimization obtained from the samples were, respectively, 4162 with 6886 of 87.82%, 92.86%, 66.67% as the sensitivity, specificity, and accuracy for serum difference; m/z 5818, 4617 with 3884 of all 100% as the sensitivity, specificity, and accuracy for saliva difference; and m/z 3738, 11366 of 96.29%, 100.00%, 85.71% as the sensitivity, specificity, and accuracy for tissue difference between OSCC and OLK patients. Conclusions: Within the fields of clinical biomarker application and bioinformatics utilization, as well as the exploitation and popularization of modern discriminate analysis technology, to determine preventative and therapeutic stage and prognosis of OSCC and OLK, the proteomes of optimization for discrepancy are suggested to be directly enrolled in clinical application without protein identification.
Quantities of possible sacrifices such as deformity, malfunction, recurrence, metastasis, deterioration, and mortality following the incidence and even treatment of Oral Squamous Cell Carcinoma (OSCC), which rated 80 percent of the sixth human malignant tumors, the oral malignant tumors, not only alert many individuals of Oral leukoplakia (OLK), but also prompt clinicians as well as research groups to seek additional biomarkers and increase interest in bioinformatics technologies [Citation1,Citation2].
Lately, queues of mass spectrometry or electrophoresis technology applied to protein characterization and integrated differential fingerprints have led to favorable crops in the parallel fields of cellularity or organography, carcinomas or infections, and pharmaceutics or medicine [Citation3–5]. This study reports some investigations of the renovated potential detection approach in the mucosa lesions of oral medicine focusing on the oncology, moving among the multiple sample categories of serum, saliva, and locally sited tissue of patients and over the technology sequence of Surface Enhanced Laser Desorption/Ionization - Time of Flight - Mass Spectrometry (SELDI-TOF-MS), ZUCI-PDAS (Zhejiang University Cancer Institute ProteinChip Data Analysis System) available at www.zlzx.net, Support Vector Machines (SVM), Cross Validation, and Laser Capture Micro-Dissection (LCM) techniques [Citation5–8].
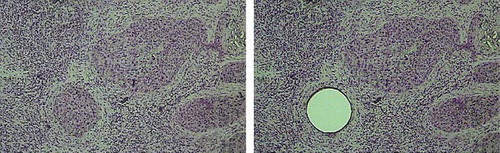
As the favorite and scientifically certified for its validation and efficiency in oncology as well as other fields in developed countries, SELDI-TOF-MS has the extraordinary capability to obtain and compare spectra from a significant number of samples in a relatively short time with very little sample preparation or sophisticated chromatography [Citation5–8]. For LCM, conventionally stained uncovered slides were viewed and after locating the cells of interest, a CapSure LCM Cap (Arcturus, Mountain View, CA, USA) was placed over the target area and pulsed with lasers to adhere cells () to the cap, which after sufficient capture (5000 cells) was transferred to a 0.5mL sterile microfuge tube for immediate processing. For each sample, approximately 10,000-15,000 cells were captured on multiple caps, which were subsequently processed for protein extraction.
Figure 1. Laser-capture microdissection of OSCC. Tumor cryosections were fixed, stained with hematoxylin and eosin (H&E), dehydrated and analyzed under the microscope. Once tumor cells of interest were identified, microdissection was performed, and the cell purity confirmed by inspecting the area of tissue that underwent procurement and the captured cells.
Measured by the P value of m/z peaks of computed ranks from multiple runs, Discriminate Analysis and SVM models introduced random perturbations in multiple runs to test the consistency of the top 10 ranked peaks. Stage models were then built using the selected peaks. The models established based on these selected biomarkers should be further validated independently. In such studies, validation datasets preferably should be from sources different from that of the original training dataset. This is one way to ensure that the performance of the selected biomarkers is not influenced by systematic biases between different groups. Time-sequence analysis was used to distinguish different stage groups. As for each step of the Cross-Validation one sample was left out, Leave-one-out Cross-Validation approach was also applied to estimate the accuracy of the classifier to determine the misclassification rate. The possibility of obtaining a small cross-validated misclassification rate by chance was obtained by repeating the entire cross-validation procedure using n random permutations of the class labels for the clinical criteria being evaluated.
For reference to more comprehensive and appropriate group designs and establishments for the identification models, the reader is referred to additional reports of this research [Citation6–8].
METHODS
Serum Sample Process
With consent granted, diagnoses confirmed by post-surgical pathologic observation and prior to any therapeutic measures implemented, samples were obtained in the early morning before breakfast from patients in the Second Affiliated Hospital, School of Medicine, Zhejiang University. Nineteen males and 9 females constituted the main OSCC group of 28 cases with a median age of 58.6 years (range 35∼88 years). Four males and 2 females with a median age of 53 years (44∼59 years range) constituted the OLK group. Sera were separated at once and stored at −80 °C until use [Citation7,Citation9].
Saliva Sample Collection
Clinical data resources were similar with 12 males and 5 females averaging 62.1 from 45 to 87 years as the 17 cases of the OSCC tissue group. Whole saliva (oral fluid) [Citation8,Citation10] was obtained from healthy, nonsmoking subjects in the morning at least 2 h after eating and after rinsing the mouth with water. Specimens were centrifuged for 5 min at 1000 × g or at 10,000 × g at 4 °C. Supernatants were sampled and used for further studies. The samples were divided in 250 ul aliquots and stored on ice at −80 °C, were collected after 0 or 3 h and then were immediately processed for SELDI-TOF-MS analysis. To prevent protein degradation, 1 μl/ml of saliva of protease inhibitor cocktail (Sigma Diagnostics, St. Louis, MO, USA) was added to the specimens.
Tissue Samples Process and Cellular Protein Extraction
Histologically squamous mucosa and tumor specimens from primary resected OSCC from patients who provided written consent for planned studies and were approved by the Institutional Review Board were immediately harvested by a head and neck pathologist, and stored at −70 °C until use. Eight-micrometer cyrosections were cut onto standard RNAase free glass slides. Prior to use, all tissue sections were stained with hematoxylin and eosin, and confirmed by the pathologist as being either dysplasia, malignant, invasive, or normal epithelium. For each sample, approximately 10,000-15,000 cells () were captured on multiple caps, which were subsequently processed for protein extraction. The extraction solution was then recovered by centrifugation (14,000 rpm) for 2min, pooled and stored at −80 °C until ready to be processed for analysis [Citation6,Citation11].
ProteinChip Array, Database Analysis, and Statistical Validation
After thawing and 2 min of centrifugation (10 000 r/min), 5 μl sample was added into 10 μl 0.5% U9 (9 mol/L urea, 0.2% CHAPS (3[(3-cholamidopropyl) dimethylammonio]-1-propan esulfonate), 0.1% DTT (DL-dithiothreitol)) in a 96-well plate and incubated for 30 min at 4 °C with 600 r/min vigorous shaking. The ProteinChip array cassette [Citation3,Citation4] was put into a 96-well bioprocessor and 200 μl NaAc (50 mmol/L, pH 4.0) was put into each well, and incubated for 5 min at 4 °C with 600 r/min vigorous shaking. Ciphergen SELDI Protein Biology System II plus (PBS II plus) and ProteinChip Software (Version 3.2, Ciphergen Biosystems) were used to read the chips and analyze the data. Laser intensity 165, 65 laser shots per sample, detector sensitivity 7, and automatically detected peaks from 2,000 to 30,000 m/z were used. Mass accuracy was calibrated to less than 0.1% using the All-in-1 peptide molecular mass standard (Ciphergen Biosystems). The peaks were normalized and noises were filtrated (first signal to noise ratio > 2.5). Zhejiang University Cancer Institute ProteinChip Data Analysis System (ZUCI-PDAS) [Citation12–15] was used to compare the data of different groups and discrepant mass peaks groups for diagnoses were founded.
Discriminate analysis and support vector machine models introduced random perturbations in multiple runs to test the consistency of the top 10 ranked peaks, measured by the p value of m/z peaks of computed ranks from multiple runs. Then stage models were built using the selected peaks. The possibility of obtaining a small cross-validated misclassification rate by chance was obtained by repeating the entire cross-validation procedure using n random permutations of the class labels for the clinical criteria being evaluated [Citation6–8].
RESULTS
After the tremendous data comparison from the mass spectrums, 108, 164, 218 discrepant protein mass peaks between sera, saliva, tissues of 8 OLK patients and 28 OSCC patients were respectively exhibited as of significant difference. Among which, from ten of the lowest p values, the integrated proteomes constituted respectively of 2, 3, 2 protein peaks were further selected out as with the highest Youden's index via SVM Discriminate Analysis, and were appointed as of common key sense, upon the corresponding and simultaneous changes inside the group. They were 4162 mutually together with 6886; 5818, and 4617 together with 3884; 3738 together with 11366. These ultimately obtained individual protein peaks and integrated discrepant proteomic selections with sensitivity, specificity, and accuracy and one example of the peak figures were presented as follows (, ). Note: Italic values of protein peak represent high expressions in group 0; regular scripts represent high expression in group 1.
Figure 2. Cellular protein mass/charge wave peak 11366 expressed high in the OLK tissue (group 0), while low in the OSCC tissue (group 1).
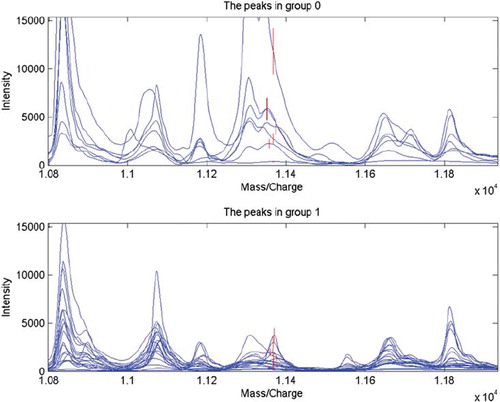
Table 1. Individual discrepant serum protein peaks between OLK patients and in situ OSCC patients (x ± SD).
Table 2. Individual discrepant saliva protein peaks between OLK patients and in situ OSCC patients (x ± SD).
Table 3. Individual discrepant tissue protein peaks between OLK patients and in situ OSCC patients (x ± SD)
Table 4. Sensitivities, specificities, and accuracies of integrated discrepant proteomes in OLK and in situ OSCC patients.
DISCUSSION
In this research project, SELDI-TOF-MS technology facilitated with weak cation exchange CM10 ProteinChip, as well as the Zhejiang University Cancer Institute ProteinChip Data Analysis System (ZUCI-PDAS), were used to detect the differential proteomes between OSCC and OLK. The samples of different groups were developed and validated by Support Vector Machines, Discriminate Analysis, and time-sequence analysis. These statistical analysis tools were implemented by MATLAB-NN Tools software. Training was conducted to converge on the training data and minimize the bias. These series of bioinformatics technologies are being exploited to be soundly advanced and of positive academic and clinical significance [Citation6–8].
In principle, ions evoked by Surface Enhanced Laser Desorption/Ionization SELDI are usually a single charge. When the numbers of charges are equal, the time of flight associates positively with the molecule size; the smaller the protein molecule is, the shorter the flight time would be [Citation12–15]. Establishing the three-dimensional discriminate database from high throughput data of protein fingerprints of serum, saliva, and tissue samples of OSCC and OLK patients, as a preliminary step towards integrated group protein biomarker discovery and furthering the corresponding tumor genesis and proteomics understanding, is inevitably summoning sample enlarging and correlation exploration; nevertheless, this doesn't infer that protein identification is absolutely to be conducted simultaneously. The clinical and scientific perspective is suggested to be cast on the Compromised Expressions of up or down regulated proteins to constitute an alive and correspondingly characterized discriminate and diagnostic as well as prognostic model. Therefore the critical point of most significance is the Integrated Optimization biomarker, which along with the bioinformatics itself should be positively further exploited to be applied for clinical benefit.
To relieve the expense and agony from physical and mental suffering, the realistically hopeful implication hereby is that after further study and more standardization of the clinical process, suitable clinical biomarker groups for OSCC and OLK can be developed. Preventative and/or therapeutic strategy and prognosis of OSCC and OLK can be designed based on the progress of this study.
Declaration of interest: The authors report no conflicts of interest. The authors alone are responsible for the content and writing of the paper.
Related Research Data
REFERENCES
- Nagano, K., Imai, S., Nakagawa, S., Tsunoda, S., Tsutsumi, Y., Yakugaku, Zasshi. (2010). From disease proteomics to biomarker development-establishment of antibody proteomics technology and exploration of cancer-related biomarkers. Journal of the Pharmaceutical Society of Japan, 130(4): 487–92.
- Nemeth, Z., Velich, N., Bogdan, S. . (2005). The prognostic role of clinical, morphological and molecular markers in oral squamous cell tumors. Neoplasma, 52(2): 95–102.
- Cui, J., Cai, J., Gao, F., Li, B. (2007). Proteomic analysis of proteins related to radiation-induced carcinogenesis. Chinese Journal of Cancer, 26(11): 1157–1163.
- Giebel, R., Worden, C., Rust, S.M., Kleinheinz, G.T., Robbins, M., Sandrin T.R. (2010). Microbial fingerprinting using matrix-assisted laser desorption ionization time- of-flight mass spectrometry (MALDI-TOF MS) applications and challenges. Advances in Applied Microbiology, 71: 149–84.
- Charles, F.S., Lenora, R.B., Zwick, M. (2006). The use of surface-enhanced laser desorption/ionization time-of-flight mass spectrometry to detect putative breast cancer markers in saliva: a feasibility study. J Oral Pathol Med, 35: 292–300.
- Hong, H., Gang, S., Feiyun, P. (2009). Laser-capture microdissection and protein extraction for protein fingerprint of OSCC and OLK. Artificial Cells, Blood Substitutes, and Biotechnology, 37(5): 208–213.
- Gang, S., Hong, H., Feiyun, P., Feifei, Z. (2009). Proteomic diagnosis models from serum for early detection of oral squamous cell carcinoma. Artificial Cells, Blood Substitutes, and Biotechnology, 37(3): 125–129.
- Ping Feiyun, Sun Gang, He Hong. Application the SELDI-TOF-MS Technology to Detection of Salivary Proteomic Diagnostic Model for Oral Precancerous Lesions and Oral Squamous Cell Carsinoma. Chinese Journal of Pathology and Physiology, 2010, 26 (1): 201–203. (in Chinese).
- Hong, H., Guanfu, C., Yanmin, L., Liang, Z. (2009). A joint detection of CEA and CA-50 levels in saliva and serum of patients with tumors in oral region and salivary gland. Journal of Cancer Research and Clinical Oncology, 135(6): 1315–1321.
- Raymond, S., Arnoud, L., Jolan, G. (2007). SELDI-TOF-MS of saliva: Methodology and pre-treatment effects. J Chromatography B, 847: 45–53.
- Haven, B., Vyomesh, P., Alfredo, A.M., . (2005). Proteome-wide analysis of head and neck squamous cell carcinomas using laser-capture microdissection and tandem mass spectrometry. Oral Oncol, 41: 183–199.
- Xu, W., Chen, Y., Hu, Y., Yu, J., . (2006). Preoperatively molecular staging with CM10 ProteinChip and SELDI-TOF-MS for colorectal cancer patients. J Zhejiang Univ. Science B, 7(3): 235–240.
- Yu, J.K., Chen, Y.D., Zheng, S. (2004). An integrated approach to the detection of colorectal cancer utilizing proteomics and bioinformatics. World J Gastroenterol, 10(21): 3127–31.
- Chen, Y.D., Zheng, S., Yu, J.K., , (2004). Artificial neural networks analysis of surface-enhanced laser desorption/ionization mass spectra of serum protein pattern distinguishes colorectal cancer from healthy population. Clin Cancer Res, 10(24): 8380–5.
- Yu, J.K., Zheng, S., Tang, Y., Li, L. (2005). An integrated approach utilizing proteomics and bioinformatics to detect ovarian cancer. J Zhejiang Univ Sci B, 6(4): 227–31.