Abstract
Abstract: A novel bioreactor containing viable APA microencapsulated yeast cells was designed. Rat plasma was used for perfusion. Yeast cell loading and perfusion flow rate were studied to maximize urea removal. An increase in column loading from 25% to 100%, increased urea removal from 5.67 ± 1.34% to 30.45 ± 0.48%. An increase in flow rate from low to high, increased urea removal from 30.46% to 40.4%. At 100% column loading and high flow rate, the creatinine and phosphate concentrations decreased by 22% and 10%, respectively, while ammonia concentrations increased by 58.9% (p < 0.05). Our in-vitro perfusion study demonstrates that microencapsulated yeast cells can remove urea efficiently.
INTRODUCTION
Annually, 200,000 people are affected by acute renal failure (ARF) in the United States alone, representing approximately 5% of all long-term hospitalized patients [Citation1–4]. ARF and ESRD have high mortality rates with an overall survival rate of 50% or less, depending on the severity of the renal malfunction, as discussed by Schrier et al. [Citation5]. A number of renal replacement therapies (RRTs), such as kidney transplantation and dialysis, have been developed since the 1950s, but, to date, fundamental management issues concerning these remain unresolved with respect to both ARF and chronic renal failure (CRF). Some examples are the indications and the timing of the initiation of therapy, the modality selection, and the optimal dosing strategy for each modality, as discussed by Han et al. [Citation6]. Furthermore, current treatment modalities simply do not address the metabolic, catabolic, and synthetic roles of the kidneys [Citation7–12]. These same modalities are, at the same time, uncomfortable and inconvenient for the patients due to multi-medication requirements and lead to detrimental effects on the patient's quality of life. There is, therefore, an immediate need for novel, non-invasive, practical RRTs, which are characterized by rapid, if not instantaneous, operability and outstanding efficiency. There is also a considerable drive to reduce morbidity, mortality, and the overall economic impact associated with kidney failure.
In the past few decades, molecular technology has greatly influenced the course of biomedical research with the discovery of the genetic basis for a number of ailments, the development of gene therapy, and the production of effective therapeutic agents. Medical scientists are, to this day, researching and developing innovative, low expense therapies, with several alternatives being considered [Citation13–22].
The microencapsulation of microorganisms capable of reducing urea is of particular interest as a novel renal replacement therapy. Microencapsulation, developed by Chang in the 1960s [Citation23], is a method by which biologically active materials are enclosed within a microscopic semi-permeable membrane [Citation24]. Alginate, a polysaccharide extracted from brown algae, is used for bio-encapsulation due to its superior biocompatibility and its approval as a safe compound by the American Food and Drug Administration. Calcium ions are used as a cross-linking agent for the formation of gel-like alginate beads followed by the additional coatings of poly- l-lysine (PLL) and alginate to reduce the porosity of Ca-alginate gel, thus giving rise to stable and mechanically resilient microcapsules [Citation23]. Such artificial cells can offer a prolonged in-vivo function due to their biocompatibility, their resistance to harsh environments, their mechanical stability, and their selective membrane permeability while diminishing potential immuno-rejection and elucidation of undesired inflammatory responses [Citation25]. This technology has already proven to be successful in facilitating a wide range of biomedical and pharmaceutical processes including drug delivery, artificial organ and cellular therapy applications.
Chang and Prakash proposed the use of microencapsulated genetically engineered bacterial cells for the removal of plasma urea and ammonia. In-vitro, 40.00 ± 8.60 g of APA encapsulated E. coli DH5 bacteria were shown to remove 87.89 ± 2.25% of the plasma urea within a span of 20 min and 99.99% of the urea in a mere 30 min [Citation26]. Thus, results demonstrate that this biotechnological approach is 10-30 times more efficient in the elimination of plasma urea and ammonia than the traditional approaches currently used [Citation27,Citation28]. In another study, surgical renal failure in rats, caused by the removal of one kidney and the partial ligation of the other, resulted in a substantial increase in blood urea levels. Upon daily oral administration of log phase microencapsulated genetically engineered E. coli DH5 cells for 21 days, a drop in the plasma urea levels from 52.08 ± 2.06% mg to 9.10 ± 0.71% mg was observed. Urea levels became elevated once the treatment was halted [Citation24,Citation29]. It is hypothesized that, throughout the passage of the encapsulated bacteria through the gastrointestinal tract, small molecules from the host, such as urea, ammonia, amino acids, etc., diffuse into the microcapsules where they are metabolized by the genetically engineered cells as a nitrogen source before the microcapsules are excreted in the stool. The bacterial metabolism results in lowering the high levels of plasma urea in uremic rats with induced renal failure [Citation30]. It is implied that there is no significant retention of E. coli DH5 cells in the intestine, since urea levels do return to pre-treatment values upon stopping the treatment [Citation31].
Microencapsulated, genetically engineered microorganisms that can remove waste metabolites such as potassium, phosphate, magnesium, sodium, chloride, uric acid, cholesterol, creatinine, and bilirubin in-vitro have been prepared. This can have a significant implication in the use of oral microencapsulated, genetically engineered microorganisms for the treatment of uremia. These artificial cells were effective in removing the majority of waste metabolites from the plasma [Citation32]. Prakash and Chang [Citation29,Citation32,Citation35] also reported that the oral administration of microencapsulated genetically engineered E. coli cells, containing the K. aerogenes urease gene for over-expression of urease, efficiently removes urea from the reaction media [Citation34] and is adequate to eliminate urea during renal insufficiency [Citation35]. Analogous reductions in blood levels of other metabolites have also been reported, implying that the DH5 cells have the capacity to regularize the levels of several elevated metabolites present in renal failure patients [Citation36]. The procedure for the microencapsulation of bacterial cells in an APA microcapsule was optimized; and the capability of genetically engineered microencapsulated bacteria to effectively remove urea and ammonia was studied in-vitro.
The use of microencapsulated genetically engineered cells has potential for use in the elimination of metabolites such as urea in kidney failure, ammonia in liver failure, and amino acids such as phenylalanine in phenylketonuria and other innate errors of metabolism [Citation37]. In addition, genetically engineered and microencapsulated E. herbicola cells have demonstrated an ability to convert ammonia into usable amino acids for cells before being eliminated via the bowel. Microencapsulated, genetically engineered E. coli DH5 cells are also efficient in the removal of urea and ammonia in an in-vitro system and in a uremic rat animal model [Citation38,Citation39]. Despite all the research in this field, a need for a more suitable and a safer urea and ammonia removal system exists. The procedures for microencapsulation of biologically active materials are well recognized and offer various biomedical applications [Citation13,Citation14,Citation21,Citation25, Citation27,Citation40,Citation42,Citation43]. The possibility of using bacterial cells to treat kidney failure has been explored for over four decades. Research in the field of artificial cells revealed the possibility of oral administration of live genetically engineered cells for therapeutic functions [Citation30,Citation44]. This concept has direct relevance for the use of microencapsulated bacterial oral therapy in renal failure, liver failure [Citation30], physiologically responsive gene therapy, and somatic gene therapy [Citation28,Citation45]. Modern technological advances in molecular biology have resulted in the accessibility of non-pathogenic genetically engineered microorganisms that can effectively use uremic metabolites for cell growth. An overview of and the options available to overcome renal sufficiency have been discussed extensively in the review article [Citation28].
Microencapsulating microorganisms capable of reducing urea are of particular interest, since they implement a novel renal replacement therapy. Previous research has demonstrated the feasibility and the potential of administrating microencapsulated microorganisms as an alternative oral therapy. However, the bacterial cells tend to alter the gastrointestinal tract's microbial flora, an undesired potential side-effect when treating renal failure. A more feasible, novel alternative treatment for kidney failure is explored here: the potential of orally administrating live yeast cells in microcapsules. S. cerevisiae, commonly known as baker's yeast, is an excellent bio-agent since it has been shown to efficiently degrade urea [Citation46,Citation47]. Furthermore, it is safe yet highly adaptive to changing environments and can easily be produced in industrial-sized bioreactors at a low cost [Citation46]. Ex-vivo perfusion treatment of renal failure uremia using novel bioreactors has already proven successful. Using microencapsulated live microorganisms is of particular importance because the membranes of these artificial cell can “have the required permeability characteristics to allow the rapid equilibration of external molecules to be acted on by the enclosed bio-reactants,” as discussed by Chang [Citation48]. Furthermore, such a therapeutic alternative can hydrolyze toxic wastes and other unwanted metabolites without deranging the physiological hemostasis or resulting in neither deleterious metabolic activities nor systemic infections.
In this study, the efficacy of using a novel bioreactor column loaded with APA microcapsules entrapping live yeast cells has been investigated.
MATERIALS AND METHODS
Chemicals
Sodium alginate (low viscosity), poly-L-lysine (M.W. 27,400 Da), urea and other chemicals for the preparation of simulated gastric fluid (SGF) and simulated intestinal fluid (SIF) were purchased from Sigma-Aldrich (Oakville, ON, Canada). SGF was composed of 1.0 g/L arabinogalactan, 2.0 g/L pectin, 1.0 g/L xylan, 3.0 g/L starch, 0.4 g/L glucose, 3.0 g/L yeast extract, 1.0 g/L peptone, 4.0 g/L mucin, 0.5 g/L mucin and the pH was adjusted using 0.2 N HCl. SIF consisted of SGF and the appropriate amount of pancreatic juice, 12 g of NaHCO3, 6 g of oxgall and 0.9 g of pancreatin, suspended in 1 L of sterilized water. Minimal SD Base was purchased from Clontech (Mountain View, CA, USA), which consisted of 26.7 g minimal SD Base with appropriate DO supplement / 1 L.
Microorganism and Culture Conditions
S. cerevisiae, ATCC 9896, was purchased from Cedarlane (Burlington, ON, Canada). Yeast mold broth (YMB) growth medium was purchased from Fisher Scientific (Ottawa, ON, Canada); it was used for primary cell cultivation and was composed of 10 g/L of glucose, 3 g/L of malt extract, 5 g/L of peptone, and 3 g/L yeast extract. The whole mixture was incubated aerobically at 37oC for 48 hrs.
Preparation of APA Microcapsules Containing Live Yeast Cells
Log phase cultures of S. cerevisiae were harvested by centrifugation at 3500 rpm for 15 min at 4oC. Pellets were then resuspended with a 2% (w/v) alginate solution in order to form a final mixture consisting of 8% (v/w) pellets and 1.75% (w/w) alginate. Alginate microcapsules were prepared by generating droplets of sodium alginate solution (15 mg/mL) extruded through a 300 μm nozzle by a syringe-driven pump using an IER-20 encapsulator from Inotech Biosystems International Inc. (Rockville, MD, USA). The droplets were collected in a well-stirred calcium chloride solution (11 mg/mL) and were allowed to cross-link and form beads for 30 min. The collected beads were then coated with a 0.1% (w/v) solution of PLL for 10 min and subsequently washed with a physiological saline (PS) solution for 5 min. Finally, the alginate coating was applied by immersing the beads in a 0.1% (w/v) sodium alginate solution for 10 min followed by a final 5 min PS wash. The resulting microcapsules, with an average diameter of 638 ± 17 μm, were collected and stored in minimal media, a 10% (w/v) YMB solution, at 4oC. All solutions used for the preparation of APA microcapsules were either filtered using a 0.22 μm filter or autoclaved to ensure sterility.
Viability of Live Encapsulated Yeast Cells
To test the viability of the microencapsulated S. cerevisiae cells, 0.1 mL of freshly made yeast microcapsules were ruptured using a sterile tissue and serially diluted in PS using 10-fold serial dilutions. 0.1 mL aliquots of the resuspended S. cerevisiae cells were plated on selective YM agar plates. The plates were then incubated aerobically for 48 hrs at 37oC. All experiments were performed in triplicates.
Column Bioreactor Design
The column bioreactor design criterion had the average surface area of a conventional dialyzer membrane, which is estimated to be 1.8 m2, as discussed by Jainkiatfu [Citation49]. Knowing the average diameter of the APA microcapsules containing the S. cerevisiae cells (638 ± 17 μm), the bioreactor's volume was calculated. The column bioreactor's parameters were 12 cm height and 22 mm internal diameter (). Poly (methyl methacrylate) (PMMA), more commonly known as Plexiglass was chosen as the ideal material of construction of the column due to its robustness and ability to withstand harsh conditions.
Figure 1. Column bioreactor packed with yeast APA microcapsules (60% yeast APA microcapsules loading). The column bioreactor design criterion had the average surface area of a conventional dialyzer membrane, which is estimated to be 1.8 m2. The column bioreactor's height and internal diameter are 12 cm and 22 mm, respectively. The column bioreactor is made of Poly (methyl methacrylate) (plexiglass). Two identical meshes equipped with rubber O-ring were utilized to prevent the microcapsules from being drifted away by the flow.
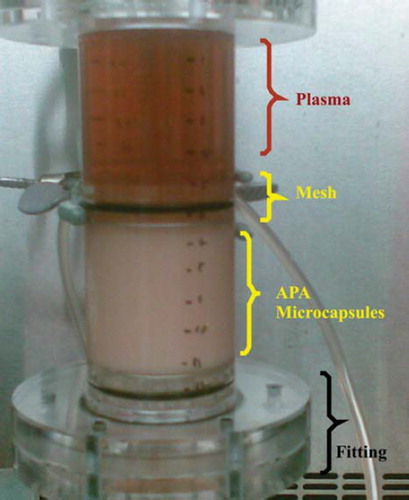
To the 12-cm-high cylindrical portion, two fittings, each measuring 3 cm in height and 22 mm in diameter, were added. The purpose of these was to allow a fully developed flow inside and outside of the column. This was essentially required to ensure an even distribution of the fluid around the microcapsules. Furthermore, two identical meshes equipped with rubber O-ring were utilized to prevent the microcapsules from being drifted away by the flow. Since the meshes were mobile, it was possible to adjust the microencapsulated S. cerevisiae loading inside the bioreactor column as desired and hence investigations into the effect of this on urea removal could also be measured.
Column Bioreactor Experimental Procedure
Saccharomyces cerevisiae Loading Experiments. 200 mL of heparinized sterile rat plasma, purchased from Equitech-Bio Inc. (Kerrville, TX, USA), was re-circulated using two identical Watson-Marlow peristaltic pumps (model 101 U/R). Pure urea beads at a concentration of 54 mmol/L were added to 200 mL of rat plasma. The temperature of re-circulating plasma was maintained at 37oC using hot plates. Four different yeast loading ratios of 25%, 50%, 75%, and 100% total column capacity were used in this experiment. Each experiment lasted for 4 hrs. 1 mL sample volume was retrieved at 0 min, 5 min, 15 min, 30 min, 1 hr, and after every 30 min interval until the 4th hr. The samples, which were stored at -80oC, were analyzed using the Hitachi 911 Chemistry Analyzer (Roche Diagnostics, USA) for BUN urea, creatinine, calcium, and phosphate kits. In order to keep a sterile environment, the column and all of its accessories were soaked in a 70% alcohol solution for 48 hrs before each usage.
Column Flow Rate Experiments. The investigation was carried out as aforementioned. Heparinized sterile rat uremic plasma (25 mL) was re-circulated using a Watson-Marlow peristaltic pump. Three different pump settings (low, medium, and high flow rates (mL/min)) were maintained. With 25% S. cerevisiae microcapsule loading, the flow rates were 1.98, 3.12, and 8.13 mL/min; for 50% S. cerevisiae microcapsule loading, the column flow rates were 1.97, 2.89, and 6.58 mL/min; for 75% S. cerevisiae microcapsule loading, the column flow rates were 0.96, 2.19, and 4.83 mL/min; and for 100% S. cerevisiae microcapsule loading, the column flow rates were 0.75, 1.55, and 3.33 mL/min for the low, medium, and high settings, respectively.
Statistical Analysis
The statistical Analysis System (SAS Enterprise Guide 4.1 (4.1.0.471) by SAS Institute Inc. (Cary, NC, USA) was used to analyze the data. Data was expressed as means ± SEM. Group and time effects were statistically investigated by ANOVA mixed models. Data were considered significant at p < 0.05.
RESULTS
Designing a yeast column bioreactor as an external mechanical device to lower urea concentrations provides insights into S. cerevisiae microcapsule urea saturation, the extent of S. cerevisiae APA microcapsules’ packing, and flow rheology around the microcapsules. – present the results of this set of experiments.
Figure 2. The efficacy of various yeast APA microcapsules loadings in plasma urea removal at a high flow rate 3.33 mL/min. The figure shows that higher the loading is, the greater the urea breakdown will be.
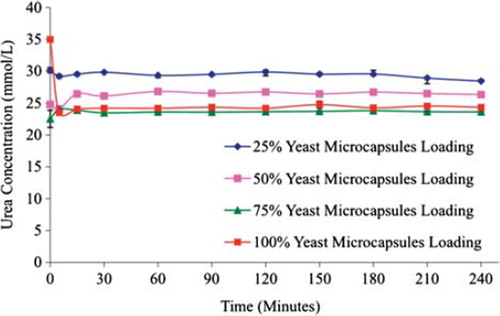
Figure 3. The effect of plasma flow rate through the column bioreactor on the urea removal by yeast APA microcapsules. The temperature of the re-circulating plasma was maintained at 37°C. 1 mL sample volume was retrieved at 0 min, 5 min, 15 min, 30 min, 1 hr, and after every 30 min interval thereafter until the 4th hour. (A) – Low flow rate (0.96 and 0.75 mL/min.) in 75% and 100% yeast APA microcapsules loading. (B) – Medium flow rate (2.19 and 1.55 mL/min.) in 75% and 100% yeast APA microcapsules loading. (C) – High flow rate (4.83 and 3.33 mL/min.) in 75% and 100% yeast APA microcapsules loading.
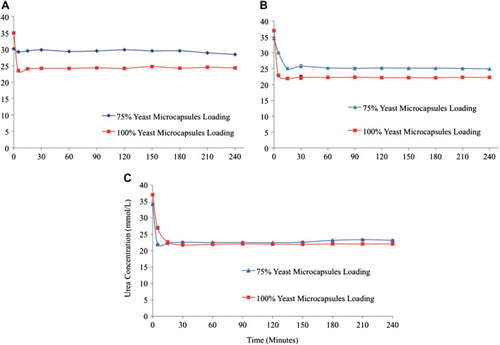
Figure 4. Comparative creatinine removal by 100 % yeast APA microcapsules loading at low, medium, and high flow rates (0.75, 1.55 and 3.33 mL/min, respectively). The temperature of the re-circulating plasma was maintained at 37°C. 1 mL sample volume was retrieved at 0 min, 5 min, 15 min, 30 min, 1 hr, and after every 30 min interval thereafter until the 4th hr.
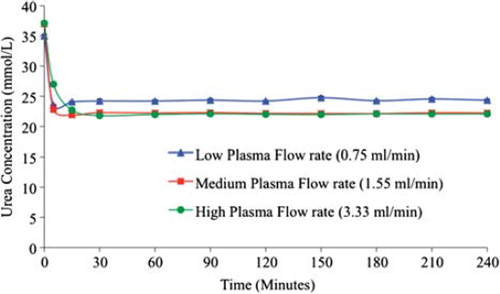
Figure 5. Percent change in the plasma urea (A), creatinine (B), phosphate (C), and ammonia (D) concentrations with 100 % yeast APA microcapsules loading at low, medium, and high flow rates (0.75, 1.55, 3.33 mL/min, respectively). The temperature of the recirculating plasma was maintained at 37°C. 1 mL sample volume was retrieved at 0 min, 5 min, 15 min, 30 min, 1 hr, and after every 30 min interval thereafter until the 4th hr.
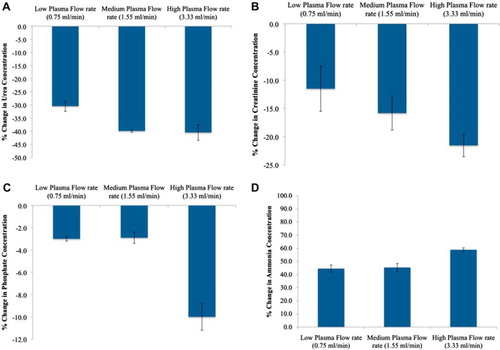
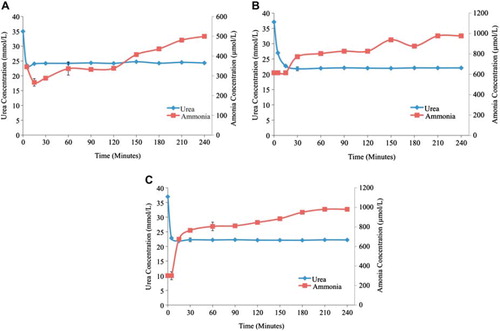
Figure 6. Plasma urea and ammonia concentrations as a function of time. (A) - Low flow rate (0.75 ml/min.) in 100% yeast APA microcapsules loading. (B) - Medium flow rate (1.55 ml/min.) in 100% yeast APA microcapsules loading. (C) - High flow rate (3.33 ml/min.) in 100% yeast APA microcapsules loading. The temperature of re-circulating plasma was maintained at 37°C using hot plates. The experiment lasted for 4 hrs. 1 ml sample volume was retrieved at 0min, 5min, 15min, 30min, 1hr, and after every 30 min interval until the 4th hour.
Urea Removal
It was imperative to find out whether these cells consumed the urea to grow. The presence of urease activity is indicated by the liberation of ammonia when S. cerevisiae is cultivated with urea as a substrate (urea agar). The production of ammonia causes the pH to rise, changing the phenol red indicator from yellow to pink. After 48 hrs of incubation at 37oC, several noticeable pink areas were observed on the surface of the agar, indicating urease activity.
Effect of Yeast APA Microcapsules’ Loadings on Urea
The ability of the microencapsulated yeast cells to hydrolyze urea was compared in 4 different S. cerevisiae microcapsule loadings (25%, 50%, 75%, and 100%) as uremic plasma was re-circulated at a constant high flow rate. As expected, the higher the column S. cerevisiae microcapsule packing is, the greater the urea removal, as illustrated in . Using 25% of the total bioreactor column volume, the urea concentration changed from 30.17 ± 0.43 mmol/L at t = 0 hr to 29.22 ± 0.26 mmol/L at t = 5 min, 29.53 ± 0.22 mmol/L at t = 15 min, 29.84 ± 0.1 mmol/L at t = 30 min, 29.35 ± 0.32 mmol/L at t = 1 hr, 29.87 ± 0.59 mmol/L at t = 2 hrs, 29.56 ± 0.24 mmol/L at t = 3 hrs and 28.45 ± 0.01 mmol/L at t = 4hrs. Similarly, for the 50% total bioreactor column packing, the urea concentration was 24.80 ± 0.41 mmol/L at t = 0hr, 24.08 ± 0.19 mmol/L at t = 5min, 26.44 ± 0.13 mmol/L at t = 15 min, 26.12 ± 0.38 mmol/L at t = 30 min, 28.82 ± 0.10 mmol/L at t = 1 hr, 26.75 ± 0.22 mmol/L at t = 2 hrs, 26.72 ± 0.27 mmol/L at t = 3 hrs and 26.33 ± 0.14 mmol/L at t = 4 hrs. For the 75% yeast loading, the urea concentration was 22.53 ± 1.35 mmol/L at t = 0 hr, 24.01 ± 0.24 mmol/L at t = 5 min, 23.89 ± 0.13 mmol/L at t = 15 min, 23.48 ± 0.38 mmol/L at t = 30 min, 23.60 ± 0.10 mmol/L at t = 1 hr, 23.65 ± 0.21 mmol/L at t = 2 hrs, 23.81 ± 0.06 mmol/L at t = 3 hrs and 23.62 ± 0.04 mmol/L at 4 hrs. The 75% packing of the total capacity of the bio-reaction column by S. cerevisiae generated the highest urea removal, decreasing the urea concentration from 34.99 ± 0.05 mmol/L at t = 0 hr to 23.50 ± 0.33 mmol/L at t = 5 min, 24.06 ± 0.16 mmol/L at t = 15 min, 24.20 ± 0.06 mmol/L at t = 30 min, 24.20 ± 0.18 mmol/L at t = 1 hr, 24.20 ± 0.33 mmol/L at t = 2 hrs, 24.25 ± 0.20 mmol/L at t = 3 hrs and 23.34 ± 0.18 mmol/L at t = 4 hrs.
The statistical analysis suggested that the group and time effects are important (p < 0.05); therefore, increasing the S. cerevisiae microcapsule loading yielded a higher urea removal. It was observed that the most efficient urea removal was achieved within the first few minutes of the experiment. The S. cerevisiae microcapsule loading also had a noticeable effect on the free plasma flow rate through the bioreactor column. In particular, the flow rates for the 25% and 100% S. cerevisiae microcapsule bioreactor column loading were 20 mL/min and 5 mL/min, respectively. Hence, there is a linear relationship between the flow rate and the column microcapsule packing.
Effect of Plasma Flow Rate
With a low flow rate and 75% S. cerevisiae microcapsule loading, the urea concentration decreased 5.66%, i.e. from 30.16 ± 0.43 mmol/L to 28.45 mmol/L, whereas with 100% yeast loading, it decreased 30.46%, i.e. from 34.99 ± 0.05 mmol/L to 24.33 ± 0.18 mmol/L (a). Similar results were obtained with the medium flow rate; with 75% S. cerevisiae microcapsule loading, the urea concentration decreased 27.88%, i.e. from 34.54 ± 0.313 mmol/L to 24.91 ± 0.03 mmol/L, whereas with 100% yeast loading it decreased to up to 40%, i.e. from 37.05 ± 0.32 mmol/L to 22.22 ± 0.08 mmol/L (b). More efficient urea removal was seen with higher flow rate, as with 75% S. cerevisiae microcapsule loading the urea concentration decreased 32.21%, i.e. from 34.24 ± 0.24 mmol/L to 23.21 ± 0.16 mmol/L and with 100% yeast loading, the urea removal decreased 40.4%, i.e. from 37.10 ± 0.2 to 22.07 ± 0.27 mmol/L (c). Therefore, as expected, the higher the bioreactor column S. cerevisiae microcapsule packing, the greater the urea removal from the uremic rat plasma. Also, most effective urea removal took place within a few minutes of the experiment.
Effect of Yeast Column Bioreactor Plasma Flow Rate on the Concentrations of Creatinine, Phosphate, and Ammonia
The creatinine concentration with 100% S. cerevisiae microcapsule loading decreased 11.5%, i.e. from 27.62 ± 0.71 μmol/L to 24.44 ± 0.73 μmol/L, with low flow rate. It decreased 15.8% with medium flow rate, i.e. from 26.67 ± 1.68 μmol/L to 22.45 ± 1.08 μmol/L, and further decreased 21.55% with high flow rate, i.e. from 30.15 ± 0.57 μmol/L to 23.65 ± 0.77 μmol/L. As shown in , it is clearly evident that most effective creatinine removal took place with 100% S. cerevisiae microcapsule loading and high flow rate. This effective removal was achieved within the first few minutes of the experiment.
The phosphate concentration with 100% S. cerevisiae microcapsule loading decreased 3.3%, i.e. from 1.8 ± 0.01 mmol/L to 1.74 ± 0.03 mmol/L with the low flow rate, 2.9% with medium flow rate, i.e. from 1.71 ± 0.03 mmol/L to 1.66 ± 0.05 mmol/L, and 10% with high flow rate, i.e. from 1.8 ± 0.03 mmol/L to 1.62 ± 0.01 mmol/L. The concentration of ammonia increased 44.5% at low flow rate, 45.4% at medium flow rate, and 58.9% at high flow rate with 100% yeast loading. illustrates the percentage change in the concentrations of urea, creatinine, phosphate, and ammonia as a function of low, medium, and high flow rates. represents the gradual increase in ammonia concentration as compared to urea at different flow rates. It was clearly observed that with increasing flow rate the ammonia concentrations tend to rise and reach a plateau much faster, i.e. 30 min for high flow rate as compared to 240 min for low flow rate. However, it was noted that the increase in ammonia concentration did not relate to the decrease in urea concentration, since each electrolyte follows a different trend with urea reaching the plateau much earlier as compared to ammonia. In conclusion, the high flow rate with 100% yeast loading proved to be the most efficient among all other parameters tested.
Saccharomyces cerevisiae Microcapsule APA Microcapsules’ Column Loadings on Yeast Cells Viability
Investigating the viability of the S. cerevisiae cells before and after the experiment is of particular importance since it provides information about the effect of plasma elution on the yeast viability. The viability of microencapsulated S. cerevisiae cells at t = 0min was 3.78X10⁸ ± 1.7X10⁷ CFU/mL, 3.65X10⁸ ± 1.4X10⁷ CFU/mL, and 3.72X10⁸ ± 1.5X10⁷ CFU/mL for the 25%, 50%, and 100% loading groups, respectively. After 4 hrs of continuous plasma elution, the viability for the same three groups was 3.69X10⁸ ± 1.2X10⁷ CFU/mL, 3.58X10⁸ ± 1.6X10⁷ CFU/mL, and 3.68X10⁸ ± 1.5X10⁷ CFU/mL, respectively. Clearly, varying the S. cerevisiae microcapsule loading does not seem to affect the yeast viability (p > 0.05).
DISCUSSION
Designing a column bioreactor is an attempt to implement an alternative to external dialysis machines. The basis of the design and feasibility of this novel renal failure treatment is the notion that the newly designed APA microcapsules entrapping live S. cerevisiae cells will remove excess urea concentrations. The column study was performed for 4 hrs, as most dialysis sessions last an average of 4 hrs [Citation50].
In this experiment, the control groups with no microcapsules as well as empty microcapsules showed relatively constant urea concentration while re-circulation of uremic plasma through different S. cerevisiae microcapsule loadings (25%, 50%, 75%, and 100%) showed lowered urea concentration. Fastest removal per unit time was seen with the highest S. cerevisiae microcapsule loading (100%) and at the highest flow rate.
The results suggest that urea removal by S. cerevisiae microcapsules depends on the S. cerevisiae microcapsule loading. The higher the loading, the greater the urea breakdown will be. As the column loading increased from 25% to 100%, the urea removal increased from 5.67 ± 1.34% to 30.45 ± 0.48%, respectively (p < 0.05). This difference accounts for approximately a 5-fold increase in urea removal capability. However, based on , the urea concentration seems stagnant after almost 1 hr of re-circulation. In fact, there were no significant differences among urea concentrations after 1 hr within each column loading group (p > 0.05). Microencapsulated S. cerevisiae cells seem to either saturate after 1 hr or to simply stop hydrolyzing the urea. The last hypothesis is not possible because it suggests that S. cerevisiae cells, by doing so, fail to survive after 4 hrs, which contradicts results obtained by the viability study. Saturation might be explained by an inefficient re-circulation, possibly jeopardizing the urea concentration gradient. The exact cause of this saturation cannot be explained at this stage and requires further investigation.
gives a general pattern of the behavior of the S. cerevisiae microcapsules’ different loadings with respect to the low flow rate. Another interesting point to note is the difference in flow rates due to the difference in S. cerevisiae microcapsule loading. This is illustrated in in which 75% and 100% loadings are used. The reason for this selection stems from the fact that a higher loading yields a higher urea removal (based on findings). Knowing that the ultimate goal is to maximize the functionality of the column bioreactor, it is then justified to establish to study the urea removal profile only in the higher loadings (i.e. 75% and 100%).
Higher packing density leaves less space inside the column for plasma particles to flow. Thus the retention time of the plasma increases with an increase in S. cerevisiae microcapsule loading. As the retention time increases, more urea gets hydrolyzed thus being more efficient as compared to the low packing of S. cerevisiae microcapsule loading, even though the plasma travels several times through the column. For this reason, the 100% loading had the highest removal extent compared to the others.
In a previous Minimal SD Base medium study, an optimal oral yeast microcapsule dosage of 1g per100 ml was determined. When comparing the urea removal with respect to the dosage by the 100% S. cerevisiae microcapsule loading group, a clear difference was noticed (30.45 ± 0.48% for the column vs. 10.93 ± 0.06% for simulated intestinal fluid experiment and 12.91 ± 1.04% for the Minimal SD Base experiment). However, this does not suggest that the latter loading is inefficient simply because each one of these optimal loadings has its own application. The 1 g per 100 mL was the S. cerevisiae APA microcapsules loading, which should be used when these microcapsules are to be administered orally. Due to medical concerns, it would not be feasible to orally administer a yeast loading equivalent to that of the column. Similarly, loading the column with a ratio of 1 g of microcapsules for each 100 mL will not yield any noticeable urea removal since such loading implies using very few microcapsules.
CONCLUSION
We have investigated microencapsulated live S. cerevisiae cells when packed in a column bioreactor for potential use in renal failure uremia. Results showed that complete loading of the column with the S. cerevisiae microcapsules generates the fastest urea removal rate per unit time. Even though the design is not as complex and elaborated as those of dialysis machines, it provides, nonetheless, comprehensive results with respect to urea removal. The S. cerevisiae microcapsule formulation in a column bioreactor shows promising outcomes for further investigations.
Declaration of interest: The authors report no conflicts of interest. The authors alone are responsible for the content and writing of the paper.
REFERENCES
- Zhang, Q. and Rothenbacher, D. (2008). Prevalence of chronic kidney disease in population-based studies: Systematic review. BMC Public Health, 8: 117.
- Thadhani, R., Pascual, M., Bonventre, J.V. (1996). Medical progress: Acute renal failure. N Engl J Med, 334: 1448–1460.
- Lieberthal, W., Nigam, S.K. (2000). Acute renal failure. II. Experimental models acute renal failure: Imperfect but indispensable. Am J Physiol Renal Physiol, 278: F1–F12.
- Nigam, S.K. and Lieberthal, W. (2000). Acute renal failure. III. The role of growth factors in the process of renal regeneration and repair. Am J Physiol Renal Physiol, 279: F3–F11.
- Schrier, R.W., Wang, W. (2004). Acute renal failure and sepsis. N Engl J Med, 351: 159–69.
- Han, M.K., Hyzy, R. (2006). Advances in critical care management of hepatic failure and insufficiency. Crit Care Med, 34: 225–31.
- Kida, K., Nakajo, S., Kamiya, F., Toyama, Y., Nishio, T., and Nakagawa, H. (1978). Renal net glucose release in vivo and its contribution to blood glucose in rats. J Clin Investig 62: 721–726.
- Tannen, R.L. and Sastrasinh, S. (1984). Response of ammonia metabolism to acute acidosis. Kidney Int, 25: 1–10.
- Deneke, S.M. and Fanburg, B.L. (1989). Regulation of cellular glutathione. Am J Physiol, 257: L163–L173.
- Maak, T. (1992). Renal Handling of Proteins and Polypeptides in Handbook of Physiology. New York: Oxford University Press.
- Frank, J., Engler-Blum, G., Rodemann, H.P., and Muller, G.A. (1993). Human renal tubular cells as a cytokine source: PDGF-B, GM-CSF and IL-6 mRNA expression in vitro. Exp Nephrol 1: 26–35.
- Stadnyk, A.W. (1994) Cytokine production by epithelial cells. FASEB J, 8: 1041–1047.
- Bruni, S., Chang, T.M. (1991). Encapsulated hepatocytes for controlling hyperbilirubinemia in Gunn rats. Int. J. Artif. Organs, 14: 239–241.
- Bruni, S., Chang, T.M. (1989). Hepatocytes immobilised by microencapsulation in artificial cells: Effects on hyperbilirubinemia in Gunn rats. Biomater. Artif. Cells Artif. Organs, 17: 403–411.
- Chang, T.M. (1997). Artificial cells and bioencapsulation in bioartificial organs. Ann.N.Y.Acad.Sci, 831: 249–259.
- Chang, T.M.S. (2001). Present status of modified hemoglobin as blood substitutes and oral therapy for end stage renal failure using artificial cells containing genetically engineered cells. Ann.N.Y.Acad.Sci, 944: 362–372.
- Chang, T.M.S. (1992). Living cells and microorganism immobilized by microencapsulation inside artificial cells. Fundamentals of Animal Cell Encapsulation and Immobilization. New York: CRC Press, 183–196.
- Chang, T.M.S. (1985). Biotechnology of artificial cells including its application in artificial organs. The Principles, Applications and Regulations of Biotechnology in Industry, Agriculture and Medicine. New York: Pergamon Press, 53–72.
- Chang, T.M.S. (1994). Artificial cell including blood substitutes and biomicroencapsulation: From ideas to applications. Blood substitutes and immbolization biotechnology. J. Artificial Cells, 22: vii–xiv.
- Friedman, E.A., Saltzman, M.J., Beyer, M.M., Josephson, A.S. (1976). Combined oxystarch-charcoal trial in uremia: Sorbent-induced reduction in serum cholesterol. Kidney Int. Suppl, S273–S276.
- Giordano, C., Esposito, R., Pluvio, M. (1976). Further studies with oxystarch. Kidney Int. Suppl, S266–S268.
- Goosen, A.M., Mattheus, F.A. (1988). Research on animal cell culture in microcapsules. Chem. Eng. Educ, 22: 196–200.
- Prakash, S., Chang, T.M.S. (1996). Microencapsulated genetically engineered E. coli DH5 cells for plasma urea and ammonia removal based on 1. Column bioreactor and 2. Oral administration in uremic rats. Artif. Cells Blood Substit. Immobil.Biotechnol, 24: 201–218.
- Chang, T.M.S. (1964). Semipermeable microcapsules. Science, 146: 524–525.
- Chang, T.M.S. (1966). Semipermeable aqueous microcapsules (“artificial cells”) with emphasis on experiments in an extracorporeal shunt system. Trans. Am. Soc. Artif. Intern. Organs, 12: 13–19.
- Chang, T.M.S. (1988). Medical applications of immobilized proteins, enzymes, and cells. Methods Enzymol, 137: 444–457.
- Charles, S., David, M., Stacia, M. (1998). Control of Body Fluid, Electrolyte, and Acid-base Balance in Human Physiology: Foundations and Frontiers. St. Louis, Missouri: Times-Mirror College Publications, 526–527.
- Jain, P., Shah, S., Coussa, R., Prakash S (2009). Potentials and limitations of microorganisms as renal failure biotherapeutics. Biologics: Targets and Therapy, 3: 233–243.
- Chang, T.M.S., Prakash, S. (1997). Microencapsulated genetically engineered microrganisms for clinical application (6217859). US. Ref Type: Patent.
- Chang, T.M.S., Loa, S.K. (1970). Urea removal by urease and ammonia absorbents in the intestine. The Physiologist, 13: 70.
- Chang, T.M.S. (1969). Removal of endogenous and exogenous toxins by a microencapsulated absorbent. Can. J. Physiol Pharmacol, 47: 1043–1045.
- Prakash, S., Chang, T.M.S. (2000). In vitro and in vivo uric acid lowering by artificial cells containing microencapsulated genetically engineered E. coli DH5 cells. Int. J. Artif. Organs, 23: 429–435.
- Chang, T.M.S., Prakash, S. (1998). Therapeutic uses of microencapsulated genetically engineered cells. Mol. Med. Today, 4: 221–227.
- Chang, T.M.S., Malouf, C., Ressurreccion, E.N. (1979). Artificial cells containing multienzyme systems for the sequential conversion of urea into ammonia, glutamate, then alanine. Artif. Organs, 3: 284–287.
- Chang, T.M.S., Prakash, S. (1996). Methods in Molecular Biology: Recombinant Gene Expression Protocols. Humana Press, New Jersey, 343–357.
- Chow, K.M., Liu, Z.C., Prakash, S., Chang, T.M.S. (2003). Free and microencapsulated Lactobacillus and effects of metabolic induction on urea removal. Artif. Cells Blood Substit. Immobil. Biotechnol. 31: 425–434.
- Castelman, B., McNeely, B.U. (1974). Case records of the Massachusetts General Hospital. New England Journal of Medicine, 290: 39–49.
- Demetriou, A.A., Whiting, J.F., Feldman, D., Levenson, S.M., Chowdhury, N.R., Moscioni, A.D., Kram, M., Chowdhury, J.R. (1986). Replacement of liver function in rats by transplantation of microcarrier-attached hepatocytes. Science, 233: 1190–1192.
- Dixit, V., Darvasi, R., Arthur, M., Brezina, M., Lewin, K., Gitnick, G. (1990). Restoration of liver function in Gunn rats without immunosuppression using transplanted microencapsulated hepatocytes. Hepatology, 12: 1342–1349.
- Chang, T.M.S. (1999). Future prospects for artificial blood. Trends Biotechnol, 17: 61–67.
- Chang, T.M.S. (1990). Biotechnological and medical applications based on immobilization of hepatocytes, microorganisms, or enzyme systems by microencapsulation in artificial cells. Ann. N. Y. Acad. Sci, 613: 109–115.
- Chang, T.M.S. (1992). Artificial cells: 35 years. Artif. Organs, 16: 8–12.
- Chang, T.M.S. (1980). New approaches using immobilized enzymes for the removal of urea and ammonia. Enzyme Engineering, 5: 225–229.
- Cohen, B.D. (1972), Uremic toxins. In Uremia: An International Conference on Pathogenesis, Diagnosis and Therapy, R. Kulte, B. Geoffrey, and B. C. Benjamin, Eds, Stuttgart, Germany: Thieme, 1–11.
- Friedman, E.A. (1978). Future Treatment of Renal Failure: Strategy in Renal Failure. New York: Wiley, 521–528.
- Hausinger, R.P. (2004). Metabolic versatility of prokaryotes for urea decomposition. Journal of Bacteriology, 186: 2520–2522.
- Sumrada, R.A., Cooper, T.G. (1982). Urea carboxylase and allophanate hydrolase are components of a multifunctional protein in yeast. J. Biol. Chem, 257: 9119–9127.
- Chang, T.M.S. (1988). Artificial cells as bioreactive biomaterials. J Biomater Appl., 3: 116–25.
- Jainkiatfu, K. (2005). Effects of vitamin E-coated membrane dialyzer on reduction of inflammation. Hemodialysis International, 9: 88–88.
- National Kidney and Urologic Diseases Information Clearinghouse. Kidney Failure: Choosing a Treatment That's Right for You. Aavailable at: http://kidney.niddk.nih.gov/Kudiseases/pubs/choosingtreatment/index.htm.