Abstract
Abstract: We report the application of Vitamin D3 (VD3) in nanoparticles of oleoyl alginate ester (OAE)(OAE-VD3). The internalization of fluorescent OAE-VD3 by Caco-2 cells was visualized by confocal laser scanning microscopy. In vivo pharmacokinetic studies showed that incorporation into OAE nanoparticles resulted in increased absorption of VD3. Its application in the treatment of rickets was assayed using a model of nutritionally induced vitamin D-deficiency rickets. The results showed that the encapsulated VD3 had better efficacy than that of the free drug in vivo. Our studies provide evidence that OAE nanoparticles are valuable as nutraceutical delivery vehicles to enhance the absorption of VD(3).
INTRODUCTION
Recently, incorporation of functional lipids (such as carternoids, phytosterals, and ω-3 fatty acids) and antioxidants into biopolymer nanoparticles have been studied for nutraceutical delivery [Citation1,Citation2]. These nanoparticles provide a simple way for poorly water-soluble substances to improve oral bioavailability and overcome the shortcoming absorbed only with the help of lipids. For example, Vitamin D3 (VD3) is absorbed in a bile-fat complex [Citation3,Citation4]; the absorption is blocked when there are not enough lipids in the intestine. To improve the bioavailability of VD3, it is important to enhance the water solubility. We have prepared a hydrophobic nanoparticles of oleoyl alginate ester (OAE) by acid chloride reaction using oleoyl chloride without organic solvents, and revealed the potential of OAE nanoparticles as oral carriers for sustained release of liposoluble nutraceuticals such as VD3 [Citation5]. The aim of this paper was to further study the application of hydrophobic OAE nanoparticle as a carrier for oral administration of VD3 in vitro and in vivo.
METHODS
Confocal Laser Scanning Microscopy
A caco-2 cell line was obtained from Shanghai Institute for Biological Sciences. The cells were maintained in Dulbecco's Modified Eagle's Medium (DMEM, pH 7.4; Sigma, USA) supplemented with 10% heat-inactivated fetal calf serum at 37°C in a tissue culture incubator with 5% CO2 and 95% relative humidity.
Caco-2 cells were seeded in 6-well plates (5 × 10⁴/ml cells/well with 2 ml DMEM −10% heat-inactivated fetal calf serum). VD3 imbed by OAE nanoparticles labeled by fluorescein isothiocyanate (FITC) (OAE-VD3-FITC) dissolved in DMEM was added in by final concentration 400μg/ml. After 1h of treatment with OAE-VD3-FITC, cells were fixed with 75% ethanol for 15 min, washed with Hanks three times, stained with 4,6-diamidino-2-phenylindole(DAPI) stain, and then the plates were observed under a confocal laser scanning microscopy in the following channels: excitation 488 nm (for FITC) and excitation 358 nm (for DAPI). Images from individual optical planes and multiple serial optical sections were analyzed and the images were sequentially scanned on the two channels.
In Vivo Pharmacokinetics Studies
The pharmacokinetic studies in vivo were conducted on KM mice (Experimental Animal Center of Qingdao Drug Control Institute) weighing 20 to 26g. These mice were fed with the following modified U.S.P. No. 2 vitamin D-deficient diet [Citation6] (Yellow corn, 76%; wheat gluten, 20%; calcium carbonate, 3%; sodium chloride, 1%; lysine monohydrochloride, 0.5%; and the following vitamins in milligrams per kilo of diet: thiamine hydrochloride, 2; riboflavin, 4; niacin, 10; and calcium pantothenate, 4) and were housed in the room kept from sunlight for 15 days, then divided randomly into 2 groups with 36 mice each. They were administered (i.g.) in two types of formulations, VD3 (2mg/kg) and OAE-VD3 (OAE-VD3 were administered at VD3 doses of 2 mg/kg), respectively. Blood was withdrawn through culling the eye globe at 2, 4, 8, 16, 24, and 48h after administration, centrifuged at 3500 rpm for 10min and then the separated serum was collected. The serum (200 μL) was added with 200 μL absolute alcohol, vortexed for 30 s, added with 800 μL hexane, vortexed for 60 s, and then centrifuged at 12,000 rpm for 3 min in 4°C. A 400 μL of supernatant was removed and dried by blowing nitrogen gas, then dissolved in 100 μL methanol. A 20 μL of supernatant was injected onto high-performance liquid chromatography (HPLC) (HP1100, Agilent Technologies Co. Ltd, USA) with a C18 column for determination of VD3 in serum. The mobile phase was composed of methanol and water (97: 3, v/v) at a flow rate of 0.5 mL/min and the effluent was monitored at 265 nm. Pharmacokinetic parameters were evaluated using DAS software 2.0.
In Vivo Pharmacological Activity
Treatment of Animal
This pharmacological experiment was conducted on 21-day-old Sprague-Dawley male rats (Experimental Animal Center of Hebei Province, China) weighing 45 to 60 g. Rats were randomized into two groups. The control group was fed with a basal diet whereas the others consumed the modified U.S.P. No. 2 vitamin D-deficient diet for 5 weeks. During this period, the animals were also protected from exposure to UV light. Subsequently, the animals developed morphological signs of rickets [Citation7,Citation8].
The rickets rats were randomized into the following groups: model group; H- Vd N group (OAE-VD3 were administered at VD3 doses of 37.5μg /kg· d); L- Vd N group (OAE-VD3 were administered at VD3 doses of 15μg VD3/kg·d); H- Vd group and L- Vd group rats were administered with equivalent volumes of VD3 (37.5 and 15μg /kg·d), respectively. All rats were administered by gavage. After 5 weeks of treatment, the rats were anesthetized with sodium pentobarbital (60 mg/kg, i.p.). Blood was collected from the abdominal aorta under fasting conditions. The blood was centrifuged at 3000 rpm for 15 min and separated serum was collected; the tibiae and femur were dissected free and preserved at −80°C.
Analysis of Blood Samples
Serum calcium, phosphorus, and alkaline phosphatase (AKP) levels were measured using an automatic blood chemical analyzer (Hitachi, 7600D-210). Bone alkaline phosphatase (BAP) and 25-hydroxy vitamin D3 (25- (OH) D3) concentrations were determined by ELISA kits (Adlitteram Diagnostic Laboratories, USA).
Radiographic Examination of Bone Samples
CR molybdenum target X-ray (Lorad Selenia, USA) was used to evaluate the right tibial and femoral radiological changes (30KV, 80mas, and ×1.8).
Measurement of Calcium and Phosphorus Content
Inductively coupled plasma mass spectrometry (Varian 710-ES, USA) was used to detect calcium and phosphorus content of the left tibia bones. The sample (0. 1g) was weighed into a 50 mL erlenmeyer flask, and then 10 mL of HNO3 and HClO4 (4:1,v/v) was added. The sample was digested at 210°C for 60min on an electric hot plate. After the solution was cooled, 500 mL of 1% HNO3 was added. Then the sample was run by inductively coupled plasma mass spectrometry. The instrumentation and operating conditions are as follows: forward power 1Kw; coolant gas flow rates Ar 15.0L/min; auxiliary gas flow rates Ar 1.50L/min; dwell time 30s; replicate 3.
Measurement of Bone Mineral Density (BMD)
The femoral BMD was measured by dual energy X-ray absorptiometry (DEXA, Hologic Discovery A, USA) in small animal models at the proximal and distal femur. All DEXA scans were reanalyzed by one observer to increase precision.
Hematoxylin/eosin (HE) Staining
The femur specimen was dissected, fixed in formaldehyde, decalcified, dehydrated in ascending series of ethanol, cleared with xylene, and embedded in paraffin. Subsequently, the section was produced, mounted on glass slides, and stained with hematoxylin and eosin for light microscopic observation.
Statistical Analysis
All data were expressed as the mean ± S.D. Statistical evaluation was conducted by ANOVA for comparisons among groups, followed by Student's t-test for analysis of significance. A level of P < 0.05 was accepted as indicating statistical significance.
RESULTS
Cellular Uptake of Nanoparticles
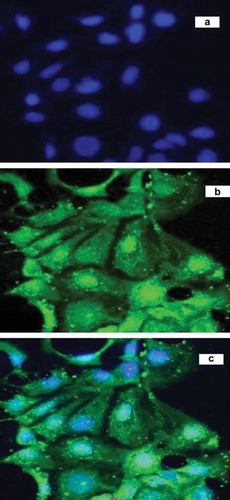
Caco-2 cells were utilized as an in vitro model of the gastrointestinal drug barrier. shows confocal microscopic images of Caco-2 cells after 1 h incubation with OAE-VD3 nanoparticles, which were imaged by (a) the combined DAPI channel and FITC channel, (b) FITC channel, and (c) DAPI channel, respectively. DAPI was used as a marker for cell nuclei of Caco-2 cells giving a typical blue fluorescence. The green fluorescence of FITC implied the existence of a substantial amount of intracellular nanoparticles. The intensity of the fluorescence (green, OAE-VD3-FITC) closely around the nuclei (blue, stained by DAPI) indicates that the nanoparticles had been internalized by the cells. The images can evidence the internalization of the fluorescent nanoparticle. We also have demonstrated that the uptake of OAE nanoparticles by Caco-2 cells was noted in a concentration- and time-dependent manner, and the uptake was influenced by the pH of the culture solution [Citation9]. These results showed that OAE nanoparticles seemed promising for the oral administration.
Figure 1. Confocal microscopic images of Caco-2 cells after 1 h incubation with OAE-VD3-FITC at 37°C, which were imaged by (a) DAPI channel, (b) FITC channel and (c) the combined DAPI channel and FITC channel, respectively.
Changes of Pharmacokinetic Parameters In Vivo
The oral pharmacokinetic parameters are listed in . The mean serum concentration-time curves in mice are shown in . As shown in , at 24 and 48h after administration, the VD3 serum concentrations were significantly higher for mice treated with OAE-VD3 than for those treated with VD3 (p < 0.05). The peak concentration (Cmax) value of OAE-VD3 was higher than that obtained with VD3, but there were no significant differences (p >0.05). The area under the curve (AUC) determines the bioavailability of the drug for those given the same dose in the formulation. The AUC (0–48h) and AUC (0–∞) value of OAE-VD3 were higher than than VD3 (p < 0.05). The pharmacokinetic results showed incorporation into OAE nanoparticles resulted in increased absorption of VD3 by oral administration.
Figure 2. The mean serum concentration-time curve of VD3 and OAE-VD3 in mice after a single oral dose (2mg/kg) of VD3 and OAE-VD3. Each data represents the mean ± S.D. of 6 rats.
Table 1. Pharmacokinetic parameters of VD3 and OAE-VD3 in mice serum (n = 6).
Changes of Pharmacological Activity In Vivo
As shown in , rats of model group showed significant decrease in body weight. The value of body weight in the H-N Vd, L-N Vd, H-Vd or L-Vd group was relatively higher than the model group in the 11th week, but the data were not significantly different.
Table 2. Changes of body weight (n = 6).
As shown in , rats of model group showed increase in AKP and BAP when compared with control rats (p < 0.05). H-N Vd, L-N Vd or H-Vd treatment decreased AKP and BAP concentrations. Treatment with low dose of Vd had no effect on AKP and BAP values of rickets rats, but the parameter of AKP in L-Vd group rats was significantly higher than L-N Vd group (p < 0.05).
Table 3. Changes of serum parameters (n = 6).
The parameter of 25-(OH) D3 in model rats was significantly decreased compared to control rats (p < 0.05). There was a tendency that H-N Vd, L-N Vd, H-Vd or L-Vd treatment increased the levels of 25-(OH) D3, but there was no statistical significance. However, a significant difference in 25-(OH) D3 value between L-N Vd and L-Vd group was observed (p < 0.05) ().
The parameters of serum phosphorus in model rats were significantly decreased compared to the control rats (p < 0.05). H-N Vd, L-N Vd, H-Vd or L-Vd treatment increased the levels of phosphorus (p < 0.05). However, the mean serum calcium levels were not significantly different between groups ().
Compared to the control group, a decrease of bone calcium and phosphorus in the model group was found (p < 0.05). The value of bone calcium and phosphorus in the H-N Vd, L-N Vd, or H-Vd group was relatively higher than the model group, but L-Vd treatment only increased bone phosphorus concentrations (p < 0.05) ().
Table 4. Changes of the content of calcium and phosphorus in rat tibia (n = 6).
As shown in , significantly decreased BMD of both proximal and distal femurs was observed in rats of model group (p < 0.05). BMD of both the proximal and distal femur was augmented in H-N Vd, L-N Vd, and H-Vd treatment groups compared to model rats (p < 0.05). However, in the L-Vd group, the BMD was not significantly different from the model group. A significant difference in BMD of distal femur between L-N Vd and L-Vd was also observed (p < 0.05).
Table 5. Changes of mineral density in rat femur (n = 6).
Radiography of the femur in the model group showed decreased cortical width along the diaphysis, as well as broadening fuzziness and cupping of the growing metaphysis, consistent with rickets. These abnormalities were relieved in the H-N Vd, L-N Vd, or H-Vd group ().
Figure 3. Femoral radiological changes.
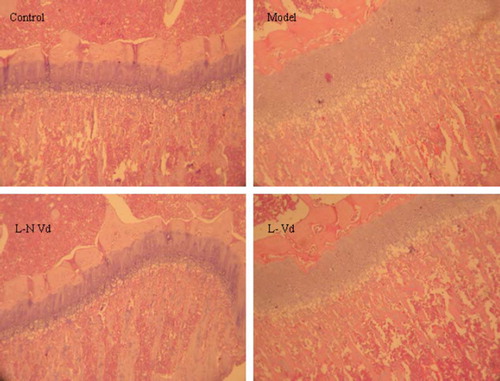
Histologic changes of the model group are seen at the level of the growth plates or, more specifically, at the level of the hypertrophic zone, where an increased number of disorganized cells is found. The increased number of cells results in increased width and thickness of the hypertrophic zone. And there is poorly defined zone of provisional calcification. Trabeculas are thin and irregular. The changes were repaired in the L-N Vd group not in L-Vd group ().
Figure 4. Histological changes in femur (HE staining, ×400).
DISCUSSION
It is well known that severe vitamin D deficiency causes rickets in childhood, is associated with raised serum AKP [Citation10] and BAP [Citation11], impaired mineralization of bone and deformity, and produces the characteristic radiographic findings of flaring of the epiphyses, Looser's zones (fissure fractures), and ill-defined trabeculae [Citation12]. In this study, the animals of model group showed an elevation of AKP and BAP (), a decrease of BMD (), and marked rachitic alterations in bone (, ). Thus, these data indicated that a model of nutritionally induced vitamin D-deficiency rickets was successfully induced.
After it is consumed in the diet or synthesized in the epidermis of the skin, VD3 enters the circulation and is transported to the liver. In the liver, VD3 is hydroxylated to form 25-(OH) D3, the major circulating form of VD3. Increased exposure to sunlight or increased dietary intake of vitamin D increases serum level of 25-(OH) D3, making the serum 25-(OH) D3 concentration a useful indicator of vitamin D nutritional status. Many investigators have suggested that the level of serum 25-(OH) D3 is necessary for bone health [Citation13,Citation14] and a serum 25-(OH) D3 of < 30 nmol/L represents vitamin D insufficiency [Citation15,Citation16]. In this study, the parameter of 25-(OH) D3 in model rats was significantly decreased compared to control rats (p < 0.05), and a significant difference in 25-(OH) D3 value between L-N Vd and L-Vd group was observed (p < 0.05).
In the kidney, the 25-hydroxyvitamin D3-1-hydroxylase enzyme catalyzes a second hydroxylation of 25-(OH) D3, resulting in the formation of 1,25-dihydroxyvitamin D (1,25-(OH)2D)3. Vitamin D deficiency leads to decreased production of the active metabolite 1,25-(OH)2D3. It is the main stimulator of the calcium absorption from the gut and indirectly as well as directly inhibits parathyroidhormone (PTH) production [Citation17,Citation18]. The increased secretion of PTH in the case of vitamin D deficiency causes the gastrointestinal tract to increase calcium absorption from food, causes the bones to release some of their calcium stores, and causes the kidneys to excrete more phosphorous, which indirectly raises serum calcium levels. In this study, the mean serum calcium levels were not significantly different between groups (). The role of PTH to maintain adequate serum calcium levels may account for this. H-N Vd, L-N Vd, H-Vd treatment increased the levels of serum phosphorus, bone calcium, bone phosphorus, and BMD (p < 0.05), but L-Vd treatment only increased serum and bone phosphorus concentrations (, , ). Furthermore, the radiological and histologic abnormalities of rat femur were relieved in the L-N Vd group, not in the L-Vd group.
These results showed that VD3 loaded nanoparticles had better efficacy than that of the free drug in terms of rickets treatment in vivo. However, the mechanisms are not well understood. The mechanisms may involve increasing the apparent solubility of the active ingredient, increasing the rate of mass transfer, increasing the retention time, or increasing the absorption via direct uptake of the nanoparticle carrier [Citation19–23].
CONCLUSIONS
The VD3-loaded nanoparticles were able to cross cell membranes and had higher AUC value than VD3. Moreover, VD3-loaded nanoparticles had better efficacy than those treated for Vitamin D-deficiency rickets with free VD3, and suggested that these nanoparticles were excellent carriers to transport VD3. These results strongly support the conclusion that these systems could be potentially used as delivery nutraceutical systems for VD3.
Declaration of interest: The authors report no conflicts of interest. The authors alone are responsible for the content and writing of the paper.
Related Research Data
REFERENCES
- Florence, A.T., Hillery, A.M., Hussain, N., Jani, P.U. (1995). Nanoparticles as carriers for oral peptide absorption: Studies on particle uptake and fate. J Controlled Release., 36: 39–46.
- Sozer, N., Kokini, J.L. (2009). Nanotechnology and its applications in the food sector. Trends Biotechnol., 27: 82–89.
- Williams, S.R., Schlenker, E.D. (2002). Essentials of nutrition and diet therapy. In Absorption, Transport, and Storage. St. Louis: Mosby Press.
- Insel, P., Ross, D., McMahon, K., Bernstein, M. (2011). Nutrition. In Digestion of Triglycerides and Phospholipids. Mississauga: Jones & Bartlett Learning Press.
- Li, Q., Liu, C.G., Huang, Z.H., Xue, F.F. (2011). Preparation and characterization of nanoparticles based on hydrophobic alginate derivative as carriers for sustained release of Vitamin D3. J Agric Food Chem., 59: 1962–1967.
- Numerof, P., Sassaman, H.L., Rodgers, A., Schaefer, A.E. (1955). The use of radioactive phosphorus in the assay of vitamin. J Nutr., 55: 13–21.
- Nordahl, J., Hollberg, K., Mengarelli-Widholm, S., Andersson, G., Reinholt, F.P. (2000). Morphological and functional features of clasts in low phosphate, Vitamin D-deficiency rickets. Calcif Tissue Int., 67: 400–7.
- Engfedt, B., Hjertqvist, S.O. (1960). Vitamin D deficiency and bone and tooth structure. World Rev Nutr Diet., 2: 185–208.
- Gao, Y.L., Liu, S., Wang, K.K., Yu, N. (2009). Uptake of self-assembled sodium alginate nanoparticles in human colon carcinoma Caco-2 cell in vitro. China Pharmacy., 20: 24–26.
- Thomas, M.K., Lloyd-Jones, D.M., Thadhani, R.I., Shaw, A.C., Deraska, D.J., Kitch, B.T., Vamvakas, E.C., Dick, I.M., Prince, R.L., Finkelstein, J.S. (1998). Hypovitaminosis D in medical inpatients. N Engl J Med., 338: 777– 83.
- Jones, G., Dwyer, T., Hynes, K.L., Parameswaran, V., Greenaway, T.M. (2005). Vitamin D insufficiency in adolescent males in southern Tasmania: Prevalence, determinants, and relationship to bone turnover markers. Osteoporos Int., 16: 636– 41.
- (2003). children. In Primer on the Metabolic Bone Diseases and Disorders of Mineral Metabolism, 5th, Favus, M.J.. American Society for Bone and Mineral Research, 173.
- Webb, A. R., Pilbeam, C., Hanafin, N., Holick, M. F. (1990). An evaluation of the relative contributions of exposure to sunlight and of diet to the circulating concentrations of 25-hydroxyvitamin D in an elderly nursing home population in Boston. Am J Clin Nutr., 51: 1075–1081.
- Haden, S. T., Fuleihan, G. E. H., Angell, J. E., Cotran, N. M., LeBoff, M. S. (1999). Calcidiol and PTH levels in women attending an osteoporosis program. Calcif Tissue Res., 64: 275–279.
- LeBoff, M. S., Kohlmeier, L., Hurwitz, S., Franklin, J., Wright, J., Glowacki, J. (1999). Occult vitamin D deficiency in postmenopausal US women with acute hip fracture. JAMA, 281: 1505–1511.
- Ooms, M. E., Lips, P., Roos, J. C., van der Vijgh, W. J. F., Popp-Snijders, C., Bezemer, P. D., Bouter, L. M. (1995). Vitamin D status and sex hormone binding globulin: Determinants of bone turnover and bone mineral density in elderly women. J Bone Miner Res., 10: 1177–1184.
- Parfitt, A.M., Gallagher, J.C., Heaney, R.P., Johnston, C.C., Neer, R., Whedon, G.D. (1982). Vitamin D and bone health in the elderly. Am J Clin Nutr., 36: 1014–1031.
- Reichel, H., Koeffler, H.P., Norman, A.W. (1989). The role of the vitamin D endocrine system in health and disease. N Engl J Med., 13: 980–991.
- Porter, C.J.H., Charman, W.N. (2001). In vitro assessment of oral lipid based formulations. Adv Drug Deliv Rev., 50: S127–147.
- Johnson, K.C., Swindell, A.C. (1996). Guidance in setting of drug particle size specifications to minimize variability in absorption. Pharm Res., 13: 1795–1798.
- Oh, D.M., Curl, R.L., Amidon, G.L. (1993). Estimating the fraction dose absorbed from suspensions of poorly soluble compounds in humans: A mathematical model. Pharm Res., 10: 264–70.
- Desai, M.P., Labhasetwar, V., Amidon, G.L., Levy, R.J. (1996). Gastrointestinal uptake of biodegradable microparticles: Effect of particle size. Pharm Res., 13: 1838–45.
- Hussain, N., Jaitley, V., Florence, A.T. (2001). Recent advances in the understanding of uptake of microparticula cross the gastrointestinal lymphatics. Adv Drug Deliv Rev., 50, 107–42.