Abstract
This study is related to the preparation of lysozyme-imprinted poly(hydroxyethyl methacrylate-N-methacryloyl-(L)-tyroptophan methylester) [nano-MIP] nanoparticles for purification of lysozyme. Nano-MIP particles were found to be 261 nm in diameter with a surface area of 1648 m2/g. According to the elemental analysis results, the particles contained 0.85 μmol MATrp/g polymer. The maximum lysozyme adsorption capacity was 1182.8 mg/g. Adsorbed lysozyme was desorbed with 94% recovery. It was observed that after five adsorption-desorption cycles there was no significant loss in adsorption capacity. In order to show the selectivity of the Lys-MIP nanoparticles, adsorption of lysozyme, bovine serum albumin (BSA), and cytochrome c were investigated.
Introduction
One of the most unique features of nature is the capability of molecular recognition. The molecular recognition of nature has inspired scientists to attempt to mimic it (Lehn Citation1995, Ramstrom et al. Citation1998, Shea Citation1994). Molecular imprinting based on synthetic polymers have well-defined recognition sites for the target molecules, first reported in 1972 (Alexander et al. 2003, Wulff et al. Citation1997). This technique aimed to carry out both the reaction cavity and the active sites in the polymer. In principle, forming cavities by this technique plays a key role for guest molecules. Furthermore, on the grounds that it provides cheap, stable, and selective materials, it is of great importance for scientists in order to sustain further developments in science and techology. Molecular imprinting procedures occur in three steps. First, there is a complexing formation between the appropriate functional monomer and template molecule, referred to as prepolymerization, and using templates that can be small molecules such as ions (Ersoz et al. Citation2004), sugars (Kugimiya et al. Citation1995), steroids (Yavuz et al. Citation2007, Asanuma et al. Citation1997), drugs (Suarez-Rodriguez and Diaz-Garcia 2001, Fu et al. Citation2001), amino acids and derivatives (Kempe and Mosbach Citation1995), or larger molecules such as proteins, cells, bacteria, and viruses (Turner et al. Citation2006, Bossi et al. Citation2007). Second, the polymerization is carried out around the template molecule and functional monomer in the presence of cross-linking agents (whitcombe et al. Citation2011), which provide mechanical stability of the polymer matrix to prevent the collapse of structure and maintain the ability of the imprinting sites in the network after the removal of template molecule. Finally, subsequent to the removal of the template molecule, functionalized cavities remaining in the imprinting sites, which are complementary in size and shape to the guest molecule, are able to recognize the template molecule selectively and also provide rebinding of the template molecule to the sites (Holthoff and Bright 2007).
Molecularly imprinted polymers depending on the interaction between functional monomer and template molecule for specific applications may be prepared by various intermolecular interactions (Vasapollo et al. Citation2011). Thus, between the functional monomer and template molecule covalent (Wulff et al. Citation1982), non-covalent (Spivak and Shea Citation2001, Carter and Rimmer Citation2002), and metal-coordination interactions (Conrad and Shea Citation2005) have been used to synthesize novel molecularly imprinted polymers.
Different molecular imprinting techniques have been employed for synthesis of the polymer to the separation and purification of biological molecules. Several approaches have been reported for imprinting of small molecules; however, there are few studies related to the imprinting of large molecules, especially biological macromolecules. Imprinting of biological macromolecules such as proteins remains a challenge because of the geometric and chemical complexity of protein structures (Ge and Turner Citation2008). Nevertheless, a number of significant protein-imprinting polymers have been reported in a wide range of applications, such as chromatography and biosensors (Ertürk et al. Citation2011). In this study, we have synthesized lysozyme-imprinted hydrophobic nanoparticles by a surface imprinting technique.
Lysozyme (EC 3.2.1.17), known as N-acetylmuramide glycanhydrolase, is one of the best characterized enzymes (Başar et al. Citation2007). Lysozyme hydrolyzes 1–4 glucosidic linkages between N-acetylmuramic acid and N-acetylglucosamine, which are present in the bacterial cell wall (Bereli et al. Citation2008), due to its own antibiotic activity inside the body, called a body self-defense enzyme (Sener et al. Citation2010). Lysozyme is found in human bodies, animals, plants, microorganisms, and viruses (Altintas et al. 2007). Lysozme is of great value in the diagnosis of various diseases. For instance, in cerebrospinal fluid, urine, and blood with an increase of lysozyme concentration, various diseases, such as tuberculosis meningitis, leukemia and hepatitis and, with a decrease of lysozyme concentration, diabetes or lead poisoning have been described in patients (Sener et al. Citation2011). Therefore, as a drug for treatment, lysozyme is used in pharmacological technology (Senel et al. Citation2001).
In this paper, we present a simple polymerization method for preparing non-covalent molecularly imprinted polymer (MIP) nanoparticles with specific lysozyme recognition sites. We have employed the surface-imprinting technique that relies on hydrophobic interactions between a functional monomer and the chosen template molecule lysozyme to produce MIP capable of selective recognition in aqueous media. For this purpose, first, we prepared N-methacryloyl-(L)-tryptophan methylester (MATrp) as a functional monomer. Then, the lysozyme-imprinted, poly(hydroxyethyl methacrylate-N-methacryloyl-(L)-tryptophan methylester) poly(HEMA-MATrp) nanoparticles were synthesized via mini-emulsion polymerization. Lysozyme adsorption capacity and molecular recognition selectivity studies in a batch system versus other proteins such as bovine serum albumin (BSA) and cytochrome c (Cyt-c) were investigated and characterized in detail. Finally, repeated use of the nano-MIP nanoparticles is also discussed.
Materials and methods
Materials
Lysozyme (chicken egg white, EC 3.2.1.7, molecular mass 14.6 kDa), cytochrome c (from horse heart, molecular mass 12.3 kDa), bovine serum albumin (BSA, molecular mass 67 kDa), L-tryptophan methyl ester, poly(vinyl alcohol) (PVA), sodium dodecyl sulfate (SDS), ammonium persulfate, sodium bicarbonate, sodium bisulfite, and potassium bromide (FTIR grade) were obtained from Sigma Chemical Co. (St. Louis, USA). Hydroxyethyl methacrylate (HEMA), ethylene glycol dimethacrylate (EGDMA), and ethanol were purchased from Fluka A.G. (Buchs, Switzerland). All other chemicals were of reagent grade and purchased from Merck A.G. (Darmstadt, Germany). All water used in the adsorption experiments was purified using a Barnstead (Dubuque, IA) ROpure LP® reverse osmosis unit with a high-flow cellulose acetate membrane (Barnstead D2731), followed by a Barnstead D3804 NANOpure® organic/colloid removal and ion exchange packed-bed system.
Synthesis of N-methacryloyl-L-tryptophan methylester (MATrp) monomer
The following experimental procedure was applied for the synthesis of N-methacryloyl-(L)-tryptophan (MATrp) (Uygun et al. Citation2010). L-Tryptophan methyl ester (5.0 g) and NaNO2 (0.2 g) were dissolved in 30 mL of K2CO3 aqueous solution (5%, w/v). This solution was cooled down to 0°C. Methacryloyl chloride (4.0 mL) was slowly poured into this solution under nitrogen atmosphere and this solution was then stirred magnetically at room temperature for 2 h. At the end of this period, pH of the solution was adjusted to 7.0 and subsequently the solution was extracted with ethyl acetate. The liquid phase was evaporated in a rotary evaporator. The residue (MATrp) was crystallized from ether and cyclohexane. The 1H-NMR and 13C-NMR spectra of MATrp were used to indicate the characteristic peaks from the groups in MATrp monomer. Peaks in 1H-NMR spectrum were observed as CH3 1.80 ppm (s), CH2 3.42 - 3.36 ppm (q), CH 4.50–4.51 ppm (m), CH2 5.33 ppm (s), CH2 5.64 ppm (s), NH (amid) 7.15 ppm (d), 5H, indol 7.15–7.57 ppm (m), NH (indol) 8.25 ppm (d), OH (acid) 11.1 ppm (s). Peaks in 13C-NMR spectrum were observed as CH3, 18.9 ppm; CH, 53.8 ppm; CH2, 65.4 ppm; C (vinyl), 110.7 ppm; CH (indole), 111.8 ppm; CH (benzene ring), 118.6 ppm; CH (benzene ring), 118.8 ppm; CH2 (vinyl), 120.0 ppm; CH (benzene ring), 121.37 ppm; CH (benzene ring), 124.0 ppm; C (indole), 127.6 ppm; C (benzene ring), 136.6 ppm; CH (benzene ring), 139.9 ppm; C = O (amide), 167.9 ppm and C = O (acid), 173.9 ppm, respectively.
Preparation of lysozyme-imprinted PHEMA-MATrp nanoparticles
Lysozyme-imprinted poly(2-hydroxyethyl methacrylate-N-methacryloyl-(L)-tryptophan methyl ester) poly(HEMA-MATrp) nanoparticles (nano-MIP) were prepared by two-phase mini-emulsion polymerization method. Before polymerization, two different aqueous phases were prepared. The first aqueous phase was prepared by dissolving PVA (200 mg), SDS (30 mg), and sodium bicarbonate (25 mg) in 10 mL deionized water (DI). The second phase was prepared by dissolving PVA (100 mg) and SDS (100 mg) in 200 mL of DI. An organic phase was formed by using MATrp (216 μL (≈21 μmol)), 2-hydroxyethyl methacrylate (HEMA) (0.7 mL), and ethylene glycol dimethacrylate (EGDMA) (1.4 mL). The organic phase was slowly added to the first aqueous phase. In order to obtain mini-emulsion, the mixture was homogenized at 25,000 rpm by a homogenizer (T10, Ika Labortechnik, Germany). After homogenization, the template molecule (lysozyme, 100 mg (≈ 7 μmol)) was added to the mini-emulsion and the mixture was stirred for 2 h to obtain an effectively interacted monomer-template pre- polymerization complex. Then, the mixture was slowly added to the second aqueous phase while the phase was stirred in a sealed-cylindrical polymerization reactor (250 mL). The reactor was magnetically stirred at 300 rpm (Radleys Carousel 6, UK). The polymerization mixture was slowly heated to 40°C, polymerization temperature. After that, nitrogen gas was bubbled through the solution for 5 min for removing dissolved oxygen. Then, initiators, sodium bisulfite (125 mg), and ammonium persulfate (125 mg) were added into the solution. Polymerization was continued at 40°C for 24 h. The lysozyme-imprinted nanoparticles were washed with water and water/ethyl alcohol mixtures in order to remove unreacted monomers, surfactant, and initiator. For each washing step, the solution was centrifuged at 30,000 rpm for 30 min (Allegra-64R Beckman Coulter, USA); then, the nanoparticles were dispersed in a fresh washing solution. After the last washing step, the lysozyme-imprinted nanoparticles were dispersed in DI containing 0.3% sodium azide and stored at 4°C. Non-imprinted poly(HEMA–MATrp) nanoparticles [nano-NIP] were prepared using the same polymerization recipe given above except lysozyme.
Characterization of lysozyme-imprinted poly(HEMA–MATrp) nanoparticles
Characterization of nano-MIP nanoparticles was investigated with Fourier transform infrared spectroscopy (FTIR), scanning electron microscopy (SEM), atomic force microscopy (AFM), zeta-sizer, and elemental analysis. The characteristic functional groups of the nano-MIP nanoparticles were analyzed using an FTIR spectrophotometer (Varian FTS 7000, USA). For this purpose, dry nanoparticles (0.1 g) were mixed with KBr (0.1 g) and pressed into a pellet form. The FTIR spectrum was recorded. The average bead diameter, size distribution, and surface morphology of the beads were obtained by scanning electron microscopy (SEM, Philips XL-30 S FEG, Netherlands). A drop of dilute nanoparticles dispersion in ethanol was spread on the glass surface and dried in a dust-free environment at room temperature. The dried sample was then sputtered under vacuum with a thin layer (ca. 4 nm) of gold before viewing under SEM and photographing. The amount of MATrp incorporation in the nano-MIP was evaluated using an elemental analysis instrument (CHNS-932, Leco, USA) by nitrogen stoichiometry. The surface area of nano MIP was calculated using the following expression (Bangs Citation1987):
N =6 × 10¹⁰S = πρsd3
Here N is the number of nanoparticles per milliliter; S the % solids; ρs the density of bulk polymer (g/mL); d is the diameter (nm). The number of nanoparticles in mL suspension was determined by utilizing the mass–volume graph of nanoparticles. From all these data, specific surface area of nano-MIP was calculated by multiplying N and surface area of one nanoparticle.
Lysozyme adsorption studies
Adsorption of lysozyme on the nano-MIP and the nano-NIP from aqueous solutions was investigated batch-wise. The adsorption experiments were carried out for 2h at 25°C at a stirring rate of 100 rpm. Effects of pH of the medium, lysozyme concentration, temperature, salt type, and ionic strength on the adsorption capacity were investigated. The adsorption was followed by monitoring the decrease in lysozyme concentration by UV absorbance at 280 nm. To determine the effect of pH on the adsorption, the pH of the adsorption medium was changed between 4.0 and 11.0 using different buffer systems (0.1 M acetate for pH 4.0–5.0, phosphate for 6.0–8.0, carbonate for 9.0–11.0). To investigate the effects of the initial concentration of lysozyme on adsorption, lysozyme concentration was changed between 0.01 and 3.0 mg/mL. To observe the effects of the temperature on the adsorption, adsorption studies were performed between 4 and 45°C. Additionally, lysozyme adsorption studies were investigated in a salt concentration range of 0–1.5 M and different salt type [NaCl, (NH4)2SO4, Na2SO4].
The amount of lysozyme adsorption per unit mass of the nanoparticles was evaluated using mass-balance. Each experiment was performed in triplicate for quality control and statistical purposes.
Selectivity studies
The selectivity experiments were carried out to show the ability of nano-MIP to recognize the lysozyme molecules against other proteins, which are related to the lysozyme. For this purpose, BSA and Cyt-c were involved in competitive adsorption experiments. The selectivity studies, as in the binding experiment, were performed in aqueous media. The procedure was performed on both the nano-MIP and the nano-NIP with competitive proteins, which were treated separately.
After competitive adsorption equilibrium was reached, the remaining samples were detected separately for each protein by a UV-spectrophotometer (UV-1601, Shimadzu, Japan) at 280 nm. The distribution coefficients (Kd) for BSA and Cyt-c with respect to Lys were calculated by the following equation.
Kd = [(Ci – Cf)/Cf] ×s V/ m
Where Kd represents the distribution coefficient for the protein (mL/g); Ci and Cf are initial and final concentrations of proteins (mg/mL), respectively. V is the volume of the solution (mL) and m is the weight of nanoparticles (g). The selectivity coefficient (k) for the binding of Lys with competing species (i.e, BSA and Cyt-c) was determined by the following equation.
k = Kd(template protein)/Kd(competing protein)
Where Kd (template protein) is the distribution coefficient of the template protein (Lys) and Kd (competing protein) is the distribution coefficient of the competing proteins (BSA and Cyt-c). The relative selectivity coefficient, which was used to estimate the effect of imprinting on protein selectivity, can be defined from the following equation.
k = kimprinted/knon-imprinted
Where kimprinted is for the nano-MIP, and knon-imprinted is for nano-NIP.
Desorption and reusability
The desorption of the adsorbed lysozyme from the lysozyme-imprinted nanoparticles was studied in a batch system. Desorption was performed with 1.0 M ethylene glycol to disrupt the specific interactions taking place at imprinted cavities. The desorption ratio was calculated from the amount of lysozyme adsorbed on the nanoparticles and the final lysozyme concentration in the desorption medium. The final lysozyme concentration in the desorption medium was determined by absorbance measurement at 280 nm. In order to test the reusability of nano-MIP, the lysozyme adsorption–desorption procedure was repeated five times. In order to regenerate and sterilize the nano-MIP, they were washed with 50 mM NaOH solution after each desorption procedure.
Adsorption of lysozyme from egg white
Adsorption of lysozyme from chicken egg white on the nano-MIP was studied in a batch. The classical lysozyme purification method required several steps, such as precipitation, centrifugation, and affinity adsorption. Chicken egg white was separated from fresh eggs. The egg white was filtered through a cheesecloth in order to remove particulate matter (e.g., chalazae) and diluted to 50% (v/v) with carbonate buffer (100 Mm, pH 10.0). The diluted egg white was homogenized in an ice bath and centrifuged at 5000 rpm for 30 min at 4°C. This study was performed for 2 h at 25°C at a stirring rate of 100 rpm batch-wise as in the binding experiment. The desorption of lysozyme from the nanoparticles was performed with 1.0 M ethylene glycol solution. The purity of lysozyme was assayed by sodium dodecylsulfate-polyacrylamide gel electrophoresis (SDS-PAGE) using 10% separating gel (9 cm × 7.5 cm) and 6% stacking gels were stained with 0.25% (w/v) Coomassie Brillant R 250 in acetic acid–methanol–water (1:5:5, v/v/v) and destained in ethanol–acetic acid–water (1:4:6, v/v/v). Electrophoresis was run for 2 h with a voltage of 220V.
Results and discussion
Characterization studies
Nano-MIP was obtained through surface imprinting, which was formed via mini-emulsion polymerization in the presence of the imprinted template molecule (lysozyme) and N-methacryloyl-(L)-tryptophan methyl ester as functional monomers.
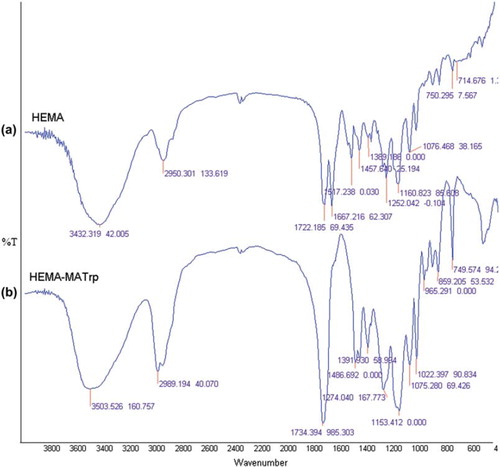
Poly(HEMA-MATrp) nanoparticles obtained from the polymerization process were characterized using FTIR analysis to determine the functional groups presence in the polymer. As seen in , the FTIR spectra of both poly(HEMA) and poly(HEMA-MATrp) have a characteristic stretching vibration band of hydrogen-bonded alcohol, O-H, around 3432 cm − 1 and 3503 cm − 1, respectively. It has been observed that the band at 3503 cm − 1 is broader than the band at 3432 cm − 1m due to the additive of NH2 from MATrp. The appearance of bands at 749 cm − 1 indicates the presence of the aromatic group of MATrp. Additionally, the characteristic stretching vibration band of the carbonyl group 1734 cm − 1 in poly(HEMA–MATrp) was excessively sharp because of extra carbonyl groups.
Figure 1. FTIR spectra: (a) poly(HEMA); (b) poly(HEMA–MATrp).
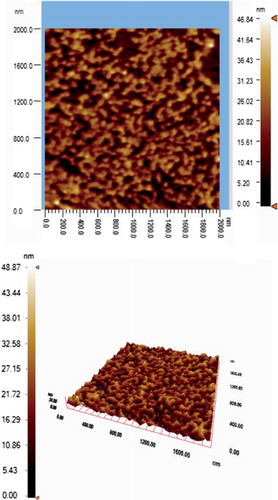
SEM and AFM were employed to investigate the surface morphology of nano-MIP. As seen in , monodispersed and nonporous nano-MIP nanoparticles sized around 261 nm were synthesized by mini-emulsion polymerization. The AFM image of nano-MIP is shown in . It is clear that the nanoparticles were uniform in size (261 nm) and spherical form ().
Figure 2. SEM photograph of nano-MIP.
Figure 3. Zeta-sizer result of nano-MIP.
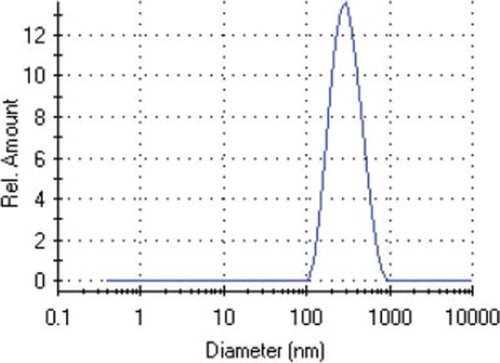
Figure 4. Atomic force microscopy images of nano-MIP.
The amount of MATrp in the nano-MIP nanoparticles was determined by elemental analysis. This nitrogen amount determined by elemental analysis comes from only MATrp groups incorporated into the polymeric structure. The incorporation of the MATrp was found to be 0.85 μmol/g polymer using nitrogen stoichiometry. The specific surface area of synthesized nanoparticles was calculated to be 1648 m2/g.
Adsorption of lysozyme from aqueous solutions
Effect of pH
The effect of pH on lysozyme adsorption onto the nano-MIP was determined in the pH range of 4.0–11.0 and the results are presented in . The maximum adsorption in our experiments was observed around pH 10.0. At this pH value, lysozyme molecules have slightly positive charge. These results indicate that the binding of lysozyme on the nano-MIP should involve hydrophobic interactions with a higher percentage according to the other interactions, i.e. electrostatic interactions. Actually, these specific interactions between lysozyme and imprinted nanoparticles may result from interaction of the biomolecule with the functional groups presented in the nano-MIP nanoparticles that have ability to selective recognition.
Figure 5. The effect of pH on lysozyme adsorption: lysozyme concentration: 1.0 mg/mL; incubation time: 2 h; temperature: 25°C.
Effects of initial lysozyme concentration
shows the dependence of the equilibrium concentration on the adsorbed amount of the lysozyme onto the nano-MIP and corresponding nano-NIP. Adsorption experiments were carried out for 2 h at 25°C at a stirring rate of 100 rpm as previously discussed. From the results obtained, the adsorption values increased with increasing concentration of lysozyme and adsorption capacity also reached a plateau at lysozyme concentration of 2.0 mg/mL. Thus, there was a plateau in the maximum adsorption capacity of both types of adsorbent. This can be explained by saturation of the active binding cavities on both nano-MIP and nano-NIP, as a result of which maximum adsorption capacity was achieved. Nano-MIP have a higher capacity for lysozyme than the nano-NIP. That's the reason that three-dimensional effects of binding sites may play a crucial role.
Figure 6. Effect of concentration of lysozyme on the lysozyme adsorption; incubation time: 2 h; pH: 10.0; temperature: 25°C.
Effects of type of salt and salt concentration
The effect of salt concentration and type on the adsorption capacity of nano-MIP nanoparticles is presented in . As seen in this figure, lysozyme adsorption values by Na2SO4 and (NH4)2SO4 differ from NaCl when the ionic strength is increased. Lysozyme adsorption capacity increased with increasing salt concentration, except NaCl, and the highest amount of adsorbed lysozyme on nano-MIP nanoparticles was obtained by adding Na2SO4 to the adsorption medium and maximum adsorption capacity was observed in the presence of 1.0 M Na2SO4 (605 mg/g). The salts randomize the structure of the liquid water and thus tend to reduce the surface tension of water (Akgöl et al. Citation2010). As a consequence, the use of high salt concentration in the equilibrium buffer and sample solution promotes the ligand-protein interactions, thus leading to higher adsorption capacity.
Figure 7. Effect of salt type and concentration on lysozyme adsorption; lysozyme concentration: 0.5 mg/mL; incubation time: 2 h; pH: 10.0; temperature: 25°C.
Effect of temperature
The effects of temperature on the amount of lysozyme adsorbed on the nano-MIP nanoparticles are demonstrated in . Lysozyme adsorption onto nano-MIP nanoparticles was significantly increased with increasing temperature, indicating that by hydrophobic interactions adsorption capacity was significantly increased. Hjerten et al. stated that increasing the temperature enhances protein retention and lowering the temperature generally promotes the protein elution (Uygun et al. Citation2009). At higher temperature during the unfolding process, the proteins expose buried hydrophobic amino acid residues on the surface (Arica et al. 2001). Thus, the contact area between the protein and the ligand on the matrix should increase, resulting in an increase in the affinity of proteins to the adsorbent at higher temperature.
Figure 8. Effect of temperature on lysozyme adsorption; lysozyme concentration: 0.5 mg/mL; incubation time: 2 h; pH: 10.0.
Effect of time
Adsorption time is one of the important sensitivity factors of the nano-MIP, which was investigated from aqueous solutions at a time range of 0.0–120 min. From , it can be seen that lysozyme adsorption sharply increased with time during the first 60 min and then leveled off as equilibrium was reached. The same adsorption trend was observed with the nano-NIP. This adsorption equilibrium is most probably due to high complexation and geometric shape affinity (or memory) between the lysozyme molecule and specific cavities formed in the nanoparticle structure.
Figure 9. Effect of time on lysozyme adsorption; lysozyme concentration: 1.0 mg/mL; incubation time: 2 h; pH: 10.0; temperature: 25°C
Evaluation of adsorption isotherm
In order to determine which theoretical isotherm best fit the data, adsorption isotherms were used to evaluate adsorption properties for nano-MIP and nano-NIP from batch experiments. The kinetics and equilibrium of the lysozyme adsorption process constitute the major determinants of evaluating the efficiency of the nano-MIP and nano-NIP. The Langmuir adsorption model assumes that the molecules are adsorbed at a fixed number of well-defined sites, each of which can only hold one molecule. These sites are also assumed to be energetically equivalent, and distant to each other, so that there are no lateral interactions between molecules adsorbed to adjacent sites.
The Langmuir is represented as follows in Eq. (1):
Where qmax is the theoretical maximum adsorption capacity (mg/g) of nano-MIP (1.67 × 10³) and nano-NIP (1.00 × 10³) b is the Langmuir isotherm (mL/mg) constant, The ratio of qe gives the theoretical monolayer saturation capacity of nano-MIP () and nano-NIP. Comparison of all theoretical approaches used in this study shows that the Langmuir equation fits the experimental data best.
Kinetic analysis
Adsorption time parameters were calculated for the nano-MIP and nano-NIP to investigate time to reach equilibrium adsorption capacity (). As seen in , lysozyme adsorption capacity increased in the first 60 min. After that, the rate of adsorption increased slowly with time extension. Then it leveled off as equilibrium was reached. Rapid realization of adsorption was associated with a large number of imprinted cavities existing on or close to the surface; thus these nanoparticles reduced diffusional resistance of lysozyme molecules and facilitated mass transfer. This also provides higher lysozyme adsorption capacity and allows a rapid desorption kinetics.
In order to determine the controlling mechanism of the adsorption process, such as mass transfer resistance and chemical adsorption between the nano-MIP/NIP nanoparticles and lysozyme molecules, theoretical kinetic models were used to test experimental data. The kinetic models (pseudo-first and second-order equations) were used in this case, assuming that the measured concentrations are equal to adsorbent surface concentrations.
lists the computed results obtained from the pseudo-first order and pseudo-second order kinetic models. The correlation coefficients for the pseudo-second order kinetic model are higher than the pseudo-first order kinetic model for all cases. These results suggest that the pseudo-second order mechanims are predominant and the chemisorption might be the rate-limiting step that controls the adsorption process. In other words, lysozyme molecules can reach binding sites on the nanoparticles without any diffusion limitation mass transfer resistance as expected.
Table I. Pseudo-first and second-order kinetic constants determined for nano-MIP and nano-NIP.
Selectivity
In order to confirm the selectivity of the nano-MIP towards the lysozyme, competitive adsorption studies were performed on both nanoparticles. To evaluate the effect of the recognition sites of the cavities on protein recognition, we also used two proteins that are comparable in molecular weight, dimension. and isoelectric point. For the selectivity experiments, Cyt-c (molecular weight and isoelectric point similar to lysozyme) and BSA (dimensions and charge different from lysozyme) were studied in a batch system under the same rebinding conditions as those for the lysozyme.
A comparison of the Kd values for the nano-MIP with the control (i.e., nano-NIP) samples shows an increase in Kd values for lysozyme while decreases in Kd values for BSA and Cyt-c were observed. The relative selectivity coefficient is an indicator to express protein adsorption affinity of recognition sites to the nano-MIP. A comparison of the selectivity coefficient of nano-MIP with the selectivity coefficient of nano-NIP showed that the nano-MIP for lysozyme/Cyt-c and lysozyme/BSA was 19.2 and 7.3 times greater than nano-NIP, respectively.
As seen in and , the nano-MIP showed selectivity for the template molecule (lysozyme). The results demonstrated that nano-MIP has higher adsorption capacities for lysozyme than for both Cyt-c and BSA. It can be explained that binding sites on the surface play a major role in a combination of charge, shape, and dimensional effects. Although the imprinting cavities were not complementary to Cyt-c and BSA, they were adsorbed on the nano-MIP via the non-specific inteaction. In spite of this, the adsorption capacity of the nano-MIP for the competiting proteins was lower than that of Lys. When we compare the nano-MIP to nano-NIP, protein adsorption onto tje nanoparticle surface could occur because of hydrophobic interactions between protein and ligands on the nanoparticles; nevertheless nano-MIP does not have any specific imprinted cavities.
Figure 10. Adsorption capacities of the nano-MIP and nano-NIP for lysozyme, BSA, and Cyt-c. Adsorption time: 2 h; T: 20°C.
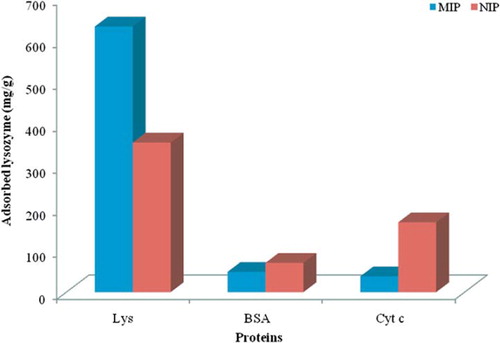
Table II. The distribution (Kd), selectivity (k), and relative selectivity (k′) coefficient values of BSA and Cytochrome-c with respect to lysozyme.
Purification of lysozyme from egg white
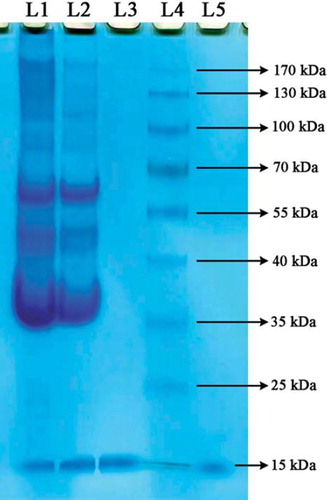
Egg white contains several proteins that are approximately 54% ovalbumin, 12–13% ovotransferrin, 11% ovomucoid, and 3.4–3.5% lysozyme. The purity of lysozyme eluted from nano-MIP was assayed by SDS-PAGE. As clearly seen in , the presence of only bands at L5 indicate the purity of lysozyme after desorption of nano-MIP. The nano-MIP provided an efficient single-step method to purify lysozyme from diluted egg white, showing high adsorption capacity and high selectivity for lysozyme (Yilmaz et al. 2009).
Figure 11. SDS-PAGE of egg white fractions. The fractions were assayed by SDS-PAGE using 10% separating gel (9 × 7.5 cm), and 5% stacking gels were stained with 0.25% (w/v) Coomassie Brillant R 250 in acetic acid–methanol–water (1:5:5, v/v/v) and destained in ethanol–acetic acid–water (1:4:6, v/v/v). Lane 1, egg white before adsorption; lane 2, egg white after adsorption; lane 3, commercial lyzoyme; lane 4, commercial marker; lane 5, desorbed lysozyme. Equal amounts of sample were applied to each line.
Desorption
In order to evaluate the stability and reusability of imprinted nanoparticles, desorption steps under mild conditions are performed. The regeneration of the nanoparticles is likely to be a key factor so that it can be used several times to adsorb the template molecule. In this study, it can be observed that the experimental conditions are efficient for desorbing the lysozyme molecules from the polymeric matrix. The desorption ratio was determined to be as high as 94%. Although the adsorption–desorption cycles for the nanoparticles were repeated five times, the adsorption capacity of the particles was about 90% after the fifth cycle, as shown in . The results clearly showed that the nano-MIP nanoparticles can be used repeatedly without losing significantly their adsorption capabilities.
Figure 12. Reusability of nano-MIP; lysozyme concentration: 0.5 mg/mL; incubation time: 2 h; pH: 10.0; temperature: 25°C. Desorption agent: 1M ethylene glycol.
Conclusion
Until today, many separation techiques have been applied for the purification of proteins. In spite of significant growth within the techniques, because of low adsorption capacity, wasteful and time-consuming factors that are unfavorable for applications, a new technique was proposed. In this study, new sorbent-producing methodology, called molecular imprinting techniques, was successfully performed via mini-emulsion polymerization. Molecular imprinting is a new technique for the preparation of adsorbents for the separation of biological molecules from aqueous solutions (Tan and Tong Citation2007). We have prepared the lysozyme-imprinted nanoparticles including N-methacryloyl-(L)-tryptophan methyl ester as functional monomer. The maximum lysozyme adsorption capacity was 1182.8 mg/g polymer. A comparison of the selectivity coefficient of nano-MIP with the selectivity coefficient of nano-NIP showed that the nano-MIP matrix for lysozyme/Cyt-c and lysozyme/BSA was 19.2 and 7.3 times greater than nano-NIP, respectively. The nano-MIP can be used repeatedly without losing significantly their adsorption capabilities. Molecular-imprinting polymers have potential applications in the separation and purification of biomacromolecules. In the adsorption experiments of the imprinted polymer, remarkably high selectivities and binding strengths are accomplished for lysozyme. We have shown that nano-MIP, having high adsorption capacity for purification of lysozyme, is easily synthesized, cheap, stabile, and can be used to specifically and selectively recognize its template molecule. In summary, based on our evaluations of adsorption capacity, recovery, and binding-specificity step, it is promising that nano-MIP is a favorable tool for specific protein recognition and single purification.
Declaration of interest
The authors report no conflicts of interest. The authors alone are responsible for the content and writing of the paper.
References
- Akgöl S, Öztürk N, Denizli A. 2010. New generation polymeric nanospheres for lysozyme adsorption. J. Appl. Polym. Sci. 115:1608–1615.
- Alexander C, Andersson HS, Andersson LI, Ansell RJ, Kirsch N, Nicholls IA, Omahony J, Whitcombe MJ. 2006. Molecular imprinting science and technology: A survey of the literature for the years up to and including. J. Mol. Recognit. 19:106–180.
- Altıntas EB, Tuzmen N, Candan N, Denizli A. 2007. Use of magnetic poly(glycidyl methacrylate) monosize beads for the purification of lysozyme in batch system J. Chromatogr B. 853:105–113.
- Arıca MY, Oktem GA, Denizli A. 2001. Novel hydrophobic ligand-containing hydrogel membrane matrix: Preparation and application to g-globulins adsorption. Colloid. Surface. B. 21:273–283.
- Asanuma H, Kakazu M, Shibata M, Hishiya T, Komiyama M. 1997. Imprinting polymer of cyclodextrin for efficient binding of cholesterol. Chem. Commun. 1971–1972.
- Bangs LB. 1987. Uniform latex particles.Seragen Diagnostics Inc. Indianapolis: Seradyn Inc.
- Başar N, Uzun L, Guner A, Denizli A. 2007. Lysozyme purification with dye-affinity beads under magnetic field. Int. J. Bıol. Macromol. 41:234–242.
- Bereli N, Andac M, Baydemir G, Say R, Galaev IY, Denizli A. 2008. Protein recognition via ıon-coordinated molecularly ımprinted supermacroporous cryogels. J. Chromatogr. A. 1190:18–26.
- Bossi A, Bonini F, Turner APF, Piletsky SA. 2007. Molecularly imprinted polymers for the recognition of proteins: The state of the art. Biosens. Bioelectron. 22:1131–1137.
- Carter SR, Rimmer S. 2002. Molecular recognition of caffeine by shell molecular imprinted core-shell polymer particles in aqueous media. Adv. Mater. 14:667–670.
- Conrad PG, Shea KJ. 2005. The use of metal coordination for controlling the microenvironment of imprinted polymers. In: Yan M, Ramstrom O. Molecularly imprinted materials: Science and technology. New York: Marcel Decker, pp. 123–180.
- Ersoz A, Say R, Denizli A. 2004. Ni(II) ion-imprinted solid-phase extraction and preconcentration in aqueous solutions by packed-bed columns Anal. Chim Acta. 502:91–97.
- Ertürk G, Uzun L, Tümer MA, Say R, Denizli A. 2011. Fab fragments imprinted SPR biosensor for real-time human immunoglobulin G detection. Biosens Bioelectron. 28:97–104.
- Fu Q, Zheng N, Li YZ, Chang WB, Wang ZM. 2001. Molecular impinted polymers from nicotinamide and its positional isomers. J. Mol. Recogn. 14:151–156.
- Ge Y, Turner APF. 2008. Too large to fit? Recent developments in macromolecular imprinting. Trends Biotechnol. 26:218–224.
- Holthoff EL, Brıght FV. 2007. Molecularly imprinted xerogels as platforms for sensing. Acc. Chem. Res. 40:756–767.
- Kempe M, Mosbach K. 1995. Separation of amino acids, peptides and proteins on molecularly ımprinted stationary phases. J. Chromatogr. A. 691:317–323.
- Kugimiya A, Matsui J, Takeuchi T, Yano K, Muguruma H, Elgersma AV, Karube I. 1995. Recognition of sialic-acid using molecularly imprinted polymer. Anal. Lett. 28:2317–2323.
- Lehn JM. 1995. Supramolecular chemistry: concepts and perspectives. Weinheim:VCH.
- Ramstrom O, Ye L, Krook M, Mosbach K. 1998. Screening of a combinatorial steroid library using molecularly imprinted polymers. Anal Commun. 35:9–11.
- Senel S, Akgöl S, Arıca MY, Denizli A. 2001. Dye-affinity hollow fibers and their lysozyme adsorption-desorption characteristics. Polym. Int. 50:1143–1149.
- Sener G, Ozgur E, Yılmaz E, Uzun L, Say R, Denizli A. 2010. Quartz crystal microbalance based nanosensor for lysozyme detection with lysozyme ımprinted nanoparticles. Biosens. Bioelectron. 26:815–821.
- Sener G, Uzun L, Say R, Denizli A. 2011. Use of molecular imprinted nanoparticles as biorecognition element on surface plasmon resonance sensor. Sensor. Actuat. B: Chem. 160:791–799.
- Shea KJ. 1994. Molecular imprinting of synthetic network polymers: The de novo synthesis of macromolecular binding and catalytic sites. Trends Polym. Sci. 2:166–173.
- Spivak DA, Shea KJ. 2001. Investigation into the scope and limitations of molecular imprinting with DNA molecules. Anal. Chim. Acta. 435:65–74.
- Suarez-Rodrıguez JL, Diaz-Garcia ME. 2001. Fluorescent competitive flow-through assay for chloramphenicol using molecularly imprinted polymers. Biosens. Bioelectron. 16:955–961.
- Tan CJ, Tong YW. 2007. The effect of protein structural conformation on nanoparticle molecular ımprinting of Ribonuclease A using miniemulsion polymerization. Langmuir 23:2722–2730.
- Turner NW, Jeans CW, Brain KR, Allender CJ, Hlady V, Britt DW. 2006. From 3D to 2D: A review of the molecular imprinting of proteins. Biotechnol. Prog. 22:1474–1489.
- Uygun DA, Corman ME, Ozturk N, Akgol S, Denizli A. 2010. Poly(hydroxyethyl methacrylate-co-methacryloyl amido tryptophane) nanospheres and their utilization as affinity adsorbents for porcine pancreas lipase adsorption. Mater. Sci. & Engin. C>. 30: 1285–1290.
- Uygun DA, Karagozler AA, Akgol S, Denizli A. 2009. Magnetic hydrophobic affinity nanobeads for lysozyme separation. Mater. Sci. & Engin. C. 29:2165–2173.
- Vasapollo G, Del Sole R, Mergola L, Lazzoi MR, Scardino A, Scorrano S, Mele G. 2011. Molecularly imprinted polymers: Present and future prospective. Int. J. Mol. Sci. 12:5908–5945.
- Whitcombe MJ, Chianella I, Larcombe L, Piletsky SA, Noble J, Porter R, Horgan A. 2011. The rational development of molecularly imprinted polymer-based sensors for protein detection. Chem. Soc. Rev. 40:1547–1571.
- Wulff G, Dederichs R, Grotstollen R, Jupe C. 1982. Affinity chromatography and related techniques. Amsterdam: Elsevier.
- Wulff G, Gross T, Schönfeld R. 1997. Enzyme models based on molecularly imprinted polymers with strong esterase activity. Angew. Chem. Int. Ed. Engl. 36:1962–1964.
- Yavuz H, Karakoc V, Turkmen D, Say R, Denizli A. 2007. Synthesis of cholesterol ımprinted polymeric particles. Int. J. Bıol. Macromol. 41:8–15.
- Yılmaz F, Bereli N, Yavuz H, Denizli A. 2009. Supermacroporous hydrophobic affinity cryogels for protein chromatography. Bıochem. Eng. J. 43:272–279.