Abstract
The present work aims at the development of plant asparaginase-based asparagine biosensor for leukemia. It is a novel diagnostic for monitoring asparagine levels in patients suffering from acute lymphoblastic leukemia (ALL). Various immobilization strategies have been applied to improve the stability of the asparaginase. The latest and updated information including some new techniques of immobilization related to L-asparaginase such as gelatin, agarose, agar, and calcium alginate methods are described in detail along with response time studies and comparative data. Furthermore these immobilization techniques have been applied for the detection of asparagine in normal and leukemia serum samples.
Keywords::
Introduction
The enzyme L-asparaginase is widely used as antitumoral agent for the treatment of acute lymphoblastic leukemia and lymphosarcoma (Schemer and Holcenberg Citation1981). Normal cell grows well in the absence of L-asparagine, whereas tumor cells need this essential amino acid for their growth because these cells lack the enzyme asparagine synthetase that synthesizes L-asparagine (Asselin Citation1999) and in the presence of L-asparaginase, tumor cells cannot survive due to unavailability of important growth factor (Muller and Boos Citation1998). Lang (Citation1904) was the first person to detect asparaginase activity in beef tissues. Kidd (Citation1953) reported antitumor properties of Guinea pig serum, which was later attributed to asparaginase activity (Broome Citation1961). L-asparaginase is the first enzyme with antitumor activity to be studied in human beings. Some diseases, such as melanosarcoma, reticlesarcoma, and hodgkin disease, can also be treated well (Stecher et al. Citation1999). Thus ALL and lymphosarcoma are effectively treated by L-asparaginase and has been clinically accepted as antitumor agent (Mashburn and Wriston Citation1964).
The enzyme L-asparaginase is produced by a variety of microorganisms such as Erwinia cartovora (Maladkar et al. Citation1993), Escherichia coli (Derst et al. Citation1994), Candida utilis (Kil et al. Citation1995) and Thermus thermophilus (Prista and Kyriakidis Citation2001). Among various plants species, production of L asparaginase has been reported. Withania somnifera was identified as potential source of L-asparaginase due to high specific activity (Oza et al. Citation2009). The presence of an amidase in barley roots capable of hydrolyzing L-asparagine studied the distribution of L-asparaginase (Grover and Chibnall, Citation1927). L-asparaginase was also produced in large amount from root nodules of soyabean (Streeter Citation1977). Capsicum annum and Tamarindus indica contain appreciable amount of L-asparaginase (Bano and Sivaramakrishnan Citation1980) and was also detected in young leaves of Pisum sativum (Siechiechowicz and Ireland Citation1989). L-aparaginase activity was also detected from two more plants Lupin arboreus and L. angustiplius (Borek et al. Citation1999).
Fabrication of asparaginase biosensor is a promising technology to detect L-asparagine. Garlic tissue electrode is used to determine L-asparagine where garlic tissue cells were employed for conversion of L-asparagine into ammonia and ammonium gas electrode was used as detector (Kim et al. Citation1995). A thermostable recombinant asparaginase from Archaeoglobus fulgidus was cloned and expressed in E.coli as a fusion protein and the immobilized enzyme was used with an ammonium selective electrode to develop a biosensor for L-asparaginase (Wang et al. Citation2002). A garlic (Allium sativum L.) peroxidase biosensor for hydrogen peroxidase monitoring, which was immobilized on chitosan matrix, was formed (El Ichi et al. Citation2008). Petunia punctata, Alternanthera sessilis and Amoora chittagonga extracts showed cytotoxicity screening against three pancreatic cancer lines-adenocarcinoma cell line Panc-1, Mia-Pacca-2, capan-1 using label free biosensor assay (George et al. Citation2010). Amperometric oxalate biosensor based on sorghum leaf oxalate oxidase, immobilized on carboxylated multiwalled carbon nanotubes, conducting polymers, and polyaniline composite film was constructed (Yadav et al. Citation2011). The current study presents the development of a novel, diagnostic and cost-effective plant L-asparaginase-based biosensor for leukemia blood samples. Color visualization approach has been optimized to monitor asparagine levels.
Materials and methods
The enzyme L-asparaginase that was used for the fabrication of biosensor to monitor asparagine levels in blood serum samples of normal healthy person and in patients suffering from acute lymphoblastic leukemia and lymphosarcoma was extracted from plant, Withania somnifera (L.) Dunal. The obtained crude extract (L-asparaginase) was coimmobilized with phenol red indicator that changes color from red to violet (red color was due to phenol red indicator). When the enzyme L-asparaginase come in contact with substrate (asparagine), deamination reaction takes place in which asparagine break down into aspartic acid and NH4+ ions which were responsible for change in color. Asparagine concentrations ranging from 10‐10210‐1 M were studied by different techniques through change in color by visualization approach. In biosensor construction strategies, L-asparaginase was coimmobilized with phenol red indicator by gelatin method, agarose method, agar method, and calcium alginate beads formation method. Storage stability of immobilized plant L-asparaginase was studied.
Immobilization techniques
Gelatin method
Dissolve 1.0 g gelatin in 10 ml of water to prepare a 10% aqueous solution. Heat the solution gently to facilitate the dissolution process. Approximately 20 μl of enzyme (0.5 U) and 2 ml of hardening solution (20% Formaldehyde, 50% Ethanol, 30% Water) were added followed by 10 μl of phenol red indicator to the solution. Then pour it into a mold and allow it to freeze at ‐20°C for 4 hours to facilitate the gel formation. When the gel is set, warm the gel to room temperature. Then cut the gel into small blocks of approximately 3 mm per side (Alteriis et al. Citation1985). Put these blocks into varying concentration of L-asparagine and the response time is noted for change in color of blocks from partly orange to dark purple.
Agarose method
Agarose solution (1.5%) is prepared in 25 mM Tris- acetate buffer (pH 7.2) containing 2 mM CaCl2 by heating for 10vminutes. Then 20 μl enzyme (0.5 U)/10 ml above solution is added followed by 10 μl phenol red indicator. Solution is poured into petriplate and allowed to solidify. The gel is then cut into small pieces of 1.0 × 1.0 cm (Prakash et al. Citation2007). The gel pieces are put into varying concentration of L-asparagine (10‐10–10‐1 M) and the response time is noted for change in color of small pieces from partly orange to dark purple.
Agar method
A solution of 4% agar is prepared. Boil it and allow it to cool at 45–50°C. 20 μl enzyme (0.5 U) and 10 μl phenol red indicator is added to the solution. Mix it thoroughly and pour it into petriplate and allow it to solidify. The gel is then cut into square cakes of 1.0 × 1.0 cm with the help of knife or spatula (Mahajan et al. Citation2010). Then the cakes are put into varying concentration of L-asparagine and the response time is noted for change in color of cakes from partly orange to dark purple. Detection limit of L-asparagine achieved was 10‐10–10‐1 M.
Calcium alginate beads
Slurry of 3% sodium alginate with 20 μl of the enzyme solution (0.5 U) is formed and 10 μl of phenol red indicator are added to this slurry. This solution is then poured drop wise through a glass syringe into a beaker containing 0.075 M chilled CaCl2 with gentle stirring on a magnetic stirrer. Orange color beads (partly orange color of the beads was due to phenol red indicator) are made with the help of 2.5 ml syringe without needle (Johnsen and Flink Citation1986). Harden the beads by placing it for half an hour at room temperature. 5 to 6 beads are put into varying concentrations of L-asparagine (10‐10–10‐1 M) solutions. The response time for change in color of beads from partly orange to bright purple is then noted.
For monitoring asparagine levels in normal and leukemia blood serum samples, few beads of calcium alginate are put into both the samples. Response time for color change of beads is noted and compared with change in response time with in concentration levels.
Storage stability
To know the storage stability of biocomponent, gelatin gel blocks, agarose pieces, agar cakes, and calcium alginate beads blocks were kept in refrigerator. The activities of immobilized biocomponents were checked.
Results and discussion
Gelatin method
For gelatin method, visual color change was observed. shows comparison of color of gel blocks before and after the reaction. Detection limit of asparagine achieved was 10‐10–10‐1 M. For concentration level of 10‐1 M L-asparagine, response time detected was 22 seconds and for the concentration level of 10‐10–10‐2 M L-asparagine, response time detected was in the range of 10–20 seconds (Graph 1). Response time decreased with decrease in concentration of asparagine indicating more of NH4+ ion produced after hydrolysis.
Graph 1. Performance of biosensor with L-asparagine standards (10‐1–10‐10 M) using different matrix.
Figure 1. (A) Comparison of color of gelatin blocks (Before and after the reaction) (B) Leukemic Blood Sample.
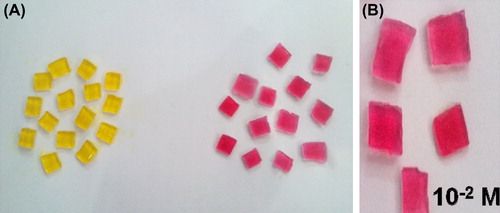
Therefore, these gel blocks have been used for subsequent experiments of optimization of the response time and monitoring asparagine levels in normal and leukemia serum samples. Response time for change in color of blocks was 16 seconds for normal blood sample. The L-asparagine concentration level was 10‐4 M. For leukemic blood samples, response time for change in color of blocks was 19 ± 0.5 seconds corresponding to 10‐2 M L-asparagine.
Agarose method
For agarose method, visual color change was observed. shows comparison of color of the gel blocks before and after the reaction. Detection limit of L-asparagine achieved was 10‐10 – 10‐1 M. For concentration level of 10‐1 M L-asparagine response time detected was 17 seconds and for the concentration level of 10‐10–10‐2 M L-asparagine, response time detected was in the range of 10–15 seconds (Graph 1). The response time for change in color was found to be directly proportional to the asparagine concentration levels.
Figure 2. (A) Comparison of color of agarose gel pieces (Before and after the reaction) (B) Leukemic Blood Sample.
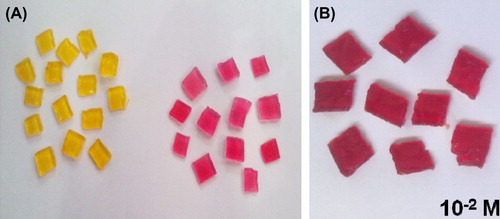
Response time for change in color of gel pieces was 13 seconds for normal blood sample. The L-asparagine concentration level was 10‐4 M. For leukemic blood samples, response time for change in color of gel pieces was 15 seconds corresponding to 10‐2 M L-asparagine.
Agar method
Detection limit of L-asparagine achieved was 10‐10–10‐1 M. For concentration level of 10‐1 M asparagine, response time detected was 14 seconds and for the concentration level of 10‐10–10‐2 M L-asparagine response time detected was in the range of 7–12 seconds (Graph 1). With decrease in concentration of asparagine, the response time for color change increased. Visual color change was observed in .
Figure 3. (A) Comparison of color of agar blocks (Before and after the reaction) (B) Leukemic Blood Sample.
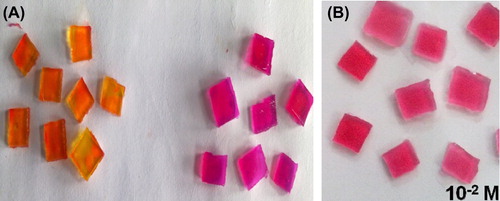
Response time for change in color of gel blocks was 11 seconds for normal blood sample. The L-asparagine concentration level was 10‐4 M. For leukemic blood samples, response time for change in color was 12 seconds corresponding to 10‐2 M L-asparagine.
Calcium alginate beads
For calcium alginate beads, visual color change was observed. shows comparison of the color of beads before and after the reaction. Detection limit of L-asparagine achieved was 10‐10–10‐1 M. For concentration level of 10‐1 M L-asparagine, response time detected was 12 seconds and for the concentration level of 10‐10–10‐2 M L-asparagine, response time detected was in the range of 7–11 seconds (Graph 1). This is directly related to decrease in NH4+ ions produced after the reaction due to increasingly lesser concentration of the reactant.
Figure 4. (A) Comparison of color of Calcium alginate beads (Before and after the reaction) (B) Leukemic Blood Sample.
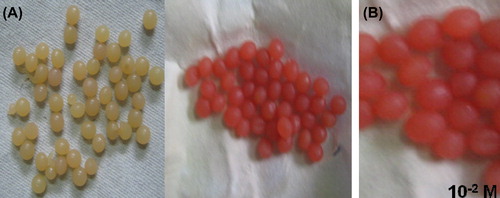
Response time for change in color of beads was 9.3 seconds for normal blood sample. The L-asparagine concentration level was 10‐4 M. For leukemic blood samples, response time for change in color of beads was 11 seconds corresponding to 10‐2 M L-asparagine.
Storage stability of the biocomponent
The biocomponent was found to be active. Biocomponent in immobilized gelatin gel blocks, agarose pieces, agar cakes, and calcium alginate beads was found to be stable for long time that is more than 4 days, 12 days, 4 days and 2 months respectively. Thus immobilization in calcium alginate beads was considered to be the most reliable and effective method.
Conclusion
The developed biosensor using various immobilization techniques was able to detect asparagine levels from 10‐10 to 10‐1 M and further it was used for the detection of asparagine levels in normal and leukemia blood serum samples. Out of all the four immobilization techniques, calcium alginate bead method was found to be best among them. As the observable response time was 12 seconds, which is least in all the four techniques. In comparison with E. coli K-12 asparaginase-based asparagine biosensor developed by Verma et al. (Citation2007) could detect asparagine levels of 10‐9 M while some earlier efforts could detect levels up to 10‐5 M only (Borek et al. Citation1999). Plant biosensor is found to be better. This is because the biosensor formed with E. coli K-12 gives more response time as compared to plant biosensor. Thus, the developed plant-based biosensor is novel, diagnostic, very rapid, easy to use, inexpensive, portable, and capable of nanolevel asparagine detection.
Acknowledgement
The authors wish to thank Modi Education Society and Dr. Satish K. Bhardwaj, Principal, M.M. Modi College, Patiala for their encouragement.
Declaration of interest
The authors report no conflicts of interest. The authors alone are responsible for the content and writing of the article.
The present work was supported by University Grant Commission [F.No.8-3(223)/2011 (MRP/NRCB)].
References
- Alteriis ED, Parascandola P, Salvadore S, Sardi V. 1985.Enzyme immobilization within insolubilized gelatin.J Chem Tech Biotechnol.35:60.
- Asselin BL. 1999.The three asparaginases.Comparative pharmacology and optimal use in childhood leukemia. Adv Exp Med Biol.457:621–629.
- Bano M, Sivaramakrishnan VM. 1980.Preparation and properties of L-asparaginase from green chillies (Capsicum annum L).J Biosci.2:291–297.
- Borek D, Podkowinski J, Kisiel A, Jaskolski M. 1999.Isolation and characterization of cDNA encoding L-asparaginase from Lupinus luteus.Plant Physiol.119:1568–1570.
- Broome JD. 1961.Evidence that the L-asparaginase activity in guinea pig serum is responsible for its antilymphoma effects.Nature.191:1114–1115.
- Derst C, Wehner A, Specht V, Röhm KH. 1994.States and functions of tyrosine residues in Escherichia coli asparaginase II.Eur J Biochem.224:533–540.
- El Ichi S, Abdelghani A, Hadji I, Helali S, Limam F, Marzouki MN. 2008.A new peroxidase from garlic (Allium sativum) bulb: Its use in H2O2 biosensing.Biotechnol Appl Biochem. 51:33–41.
- George S, Bhalerao SV, Lidstone EA, Ahmad IS, Abbasi A, Cunningham BTet al. 2010.Cytotoxicity screening of Bangladeshi medicinal plant extracts on pancreatic cancer cells.BMC Complement Altern Med10:52.
- Grover CE, Chibnall AC. 1927.The enzymic deamidation of asparagine in the higher plants.Biochem J.21:857–868.
- Johnsen A, Flink JM. 1986.Influence of alginate properties and gel reinforcement on fermentation characteristics of immobilized yeast cells.Enz Microb Tech.8:737–748.
- Kidd J. 1953.Regression of transplanted lymphomas induced in vivo by means of normal guinea pig serum.J Biol Chem.98:565.
- Kil JO, Kim GN, Park I. 1995.Extraction of extracellular L-asparaginase from Candida utilis.Biosci Biotechnol Biochem.59:749–750.
- Kim SJ, Kim GM, Bae YJ, Lee EY, Hur MH, Ahn MK. 1995.Determination of L-asparagine using a garlic tissue electrode.Yakhak Hoeji.39:113–117.
- Lang S. 1904.Uber desamidierung im Tierkorper.Beitr Chem Physiol Pathol.5:321–345.
- Mahajan R, Gupta VK, Sharma J. 2010.Comparison and suitability of gel matrix for entrapping higher content of enzyme for commercial applications.Ind J Pharma Sci.72: 223–228.
- Maladkar NK, Singh VK, Naik SR. 1993.Fermentative production and isolation of L-asparaginase from Erwinia carotovora.Hindustan Antibiotics Bul.35:77–86.
- Mashburn L, Wriston J. 1964.Tumour inhibitory effect of L-asparaginase from Escherichia coli.Arch Biochem Biophy.104: 450–452.
- Muller HJ, Boos J. 1998.Use of L-asparaginase in childhood ALL.Crit Rev Oncol/Hematol. 28:97–113.
- Oza VP, Trivedi SD, Parmar PP, Subramanian RB. 2009.Withania somnifera (ashwagandha): Novel source of L-asparaginase.J Integ Plant Biol.51:201–206.
- Prakash O, Puliga S, Upadhyay LSB. 2007.Immobilization of watermelon (Citrus vulgaris) urease in agarose gel for urea estimation.Biotech Biopro Engg.12:131–135.
- Prista AA, Kyriakidis DA. 2001.L-asparaginase of thermus thermophilus: purification, properties and identification of essential amino acids for its catalytic activity.Mol Cell Biochem.216:93–101.
- Schemer G, Holcenberg JS. 1981. Enzyme as Drugs. New York: Wiley Inter Science, pp. 455–473.
- Stecher AL, Morgantetti de Deus P, Polikarpov I, Abraha˜o-Neto J. 1999.Stability of L-asparaginase: an enzyme used in leukemia treatment.Pharm Acta Helv.74:1–9.
- Streeter JG. 1977.Asparaginase and asparagine transaminase in soybean leaves and root nodules.Plant Physiol.60:235–239.
- Siechiechowicz K, Ireland R. 1989.Isolation and properties of an asparaginase from leaves of Pisum sativum.Phytochem.28:2275.
- Verma N, Kumar K, Kaur G, Anand S. 2007.E. coli K-12 asparaginase-based asparagine biosensor for leukemia.Artif Cells Blood Substit Biotechnol.35:449–456.
- Wang J, Li J, Bachas LG. 2002.Biosensor for asparagines using a thermostable recombinant asparaginase from Archaeoglobus fulgidus.Anal Chem.74:3336–3341.
- Yadav S, Devi R, Kumari S, Yadav S, Pundir CS. 2011.An amperometric oxalate biosensor based on sorghum oxalate oxidase bound carboxylated multiwalled carbon nanotubes–polyaniline composite film.J Biotechnol.151:212–217.