Abstract
Poly(2-hydroxyethyl methacrylate)/3-(2-imidazoline-1-yl)propyl(triethoxysilane) (PHEMA/IMEO) nanoparticles were attached on surface plasmon resonance (SPR) sensor for the real-time detection of human immunoglobulin G (IgG) in human serum. The PHEMA/IMEO nanoparticles–attached SPR sensor was characterized by Fourier transform infrared spectroscopy (FTIR), atomic force microscopy (AFM), and contact angle measurements. IgG detection studies were performed using aqueous IgG solutions at different concentrations. In order to show the selectivity and specificity of the SPR sensor, competitive kinetic analyses were performed using IgG, albumin, hemoglobin in singular and competitive manner. Finally, IgG detection in human serum was carried out.
Introduction
Nanotechnology offers a variety of nanoparticles with special interests for sensing and diagnostic applications. Studies of nanoparticles are crucial by reason of shape- and size- dependent physical, chemical, and electrochemical properties that make them functional in sensing applications (Rosi and Mirkin Citation2005). Investigations of nanoparticles in sensor technology are extremely related to properties of nanoparticles such as synthesis procedures, chemical and biological modifications (surface coating with antibodies, proteins, DNA, cell, and chemicals) (Parak et al. Citation2003). Nanoparticle-based strategies for sensors with special optical and electrochemical properties are widely used in numerous fields such as clinical analysis (Merkoçi Citation2010), drug discovery (Patskovsky et al. Citation2008), process industry, security, and defense (Sharma et al. Citation2003).
Immunoglobulins have a crucial role in diagnosis, therapy, and biotechnology (Chailyan et al. Citation2012). Use of immunoglobulins in in vivo diagnostics is getting intensive attention among health authorities over the world (Reichert et al. Citation2005). Immunoglobulin (IgG), total molecular weight of approximately 150 kDa with two identical heavy and two identical light chains bonded via interchain disulfide linkages to form Y-shaped biomolecule (Hamilton and Ambli Citation2001), is frequently used as a biological element during biosensor preparation (Lee et al. Citation2011). IgG molecules are routinely measured by enzyme-linked immunosorbent assay (ELISA) and radioimmunoassay (RIA) (Pålsson et al. Citation2000). However, these methods are expensive and time-consuming (Shen et al. Citation2005). Immunosensors have been successfully used for biochemical sensing and monitoring for recent years. A great deal of signal transduction platforms have been designed as: amperometric immunosensing, impedance spectroscopy, QCM-based immunosensors, and surface plasmon resonance (SPR)-based immunosensors (Tsai and Pai Citation2009). SPR-based immunosensors have been widely employed for lots of biomolecular mechanisms such as protein–protein, antibody–antigen, nucleic acid–nucleic acid, protein–nucleic acid, and ligand–receptor (Jin et al. Citation2011) in real-time measurement, high sensitivity and selectivity, and without the need to labeling (Ertürk et al. Citation2011). SPR biosensors are used in the fields of biotechnology and biomedicine (Ertürk et al. Citation2011), food technology (Taylor et al. Citation2006), environmental interests (Nakamura et al. Citation2003, Miura et al. Citation2003), diagnosis (Uzun et al. Citation2009, Ladd et al. Citation2004).
In this article, we report the poly(2-hydroxyethyl methacrylate)/3-(2-imidazoline-1-yl)propyl (triethoxysilane) (PHEMA/IMEO) nanoparticles–attached SPR sensor to detect IgG in real time. Prior to SPR studies, we prepared the PHEMA nanoparticles via two-phase miniemulsion polymerization; then IMEO molecules were attached on the nanoparticles to obtain PHEMA/IMEO nanoparticles. After that, these nanoparticles were attached onto the SPR chip. After this, surface characterization of modified SPR chip was performed. Then, the real-time detections of IgG in aqueous solution at different concentrations and human serum were carried out. The specificity and selectivity of the SPR sensor were determined and kinetics and isotherm parameters were determined by applying association kinetics analysis, Scatchard, Langmuir, Freundlich, and Langmuir–Freundlich isotherms.
Experimental
Materials
Hydroxyethyl methacrylate (HEMA) was purchased from Sigma Chem. Co. (St. Louis, USA). Ethylene glycol dimethacrylate (EGDMA) was supplied by Aldrich (Munich, Germany). HEMA contains residual methacrylic acid and crosslinkers due to fabrication process. The polymerization inhibitor 4-methoxyphenol also needs to be removed. HEMA and EGDMA were distilled under reduce pressure (0.01 mBar, 70°C). Purified monomers were stored at 4°C until use. 3-(2-Imidazoline-1-yl) propyl(triethoxysilane) (IMEO, molecular weight: 274.43 g/mol) was purchased from Sigma. Poly(vinyl alcohol) (PVAL) was purchased from Sigma. Potassium persulphate (KPS) was supplied from Aldrich. Human-immunoglobulin G (IgG) was obtained from Sigma. All other chemicals were of highest purity commercially available and were used without further purification. All water used in the experiments was purified using a Barnstead (Dubuque, IA) ROpure LP® reverse osmosis unit with a high flow cellulose acetate membrane (Barnstead D2731) followed by a Barnstead D3804 NANOpure® organic/colloid removal and ion exchange packed bed system.
Synthesis of PHEMA nanoparticles
The PHEMA nanoparticles were prepared by two phase miniemulsion polymerization method (Şener et al. Citation2010). First, liquid phase includes PVA (0.187 g), sodium dodecyl sulfate (SDS) (28.9 mg), and sodium bicarbonate (23.4 mg) in 10 mL deionized water. Secondly, liquid phase was obtained by dissolving of PVA (0.1 g) and SDS (0.1 g) in 200 mL deionized water. Monomer phase was prepared with the use of HEMA (1 ml) and EGDMA (2 ml). The monomer phase was added to first liquid phase and this mixture was homogenized to obtain miniemulsion at 25.000 rpm (T10, Ika Labortechnik, Germany). Then, the obtained miniemulsion was added to second liquid phase and this combination was transferred to the sealed-cylindrical polymerization reactor. The reaction mixture was stirred mechanically and heated up to 40°C. Finally, sodium bisulfide (0.115 g) and ammonium persulfate (0.126 g) were added to the solution and polymerization was carried out at 40°C for 24 h. The PHEMA nanoparticles were washed with deionized water and ethyl alcohol to remove unreacted monomers, surfactant, and initiators. For each washing step, samples were centrifuged at 29.000 rpm for 2 h (Allegra-64R Beckman Coulter, USA). Then, the nanoparticles were dispersed in fresh deionized water containing 0.3% sodium azide and stored at 4°C.
IMEO immobilization on PHEMA nanoparticles
For immobilizing IMEO groups onto the PHEMA nanoparticles, the PHEMA nanoparticles and IMEO (mol ratio 1:10) were mixed and stirred at 25°C for about 4 days (Öztürk et al. Citation2007, Türkmen et al. Citation2009). After this period, stirring was stopped. The IMEO immobilization reaction took place at 25°C without any catalyst. The resulting PHEMA/IMEO nanoparticles were centrifuged and washed with dichloromethane, then resuspended in distilled water. For the degree of IMEO immobilization onto the PHEMA nanoparticles, the modified nanoparticles were subjected to silicium analysis by using flame atomizer atomic absorption spectrometer (Analyst 800, Perkin Elmer, Bodenseewerk, USA).
Characterization studies of PHEMA/IMEO nanoparticles
The average nanoparticle size and size distribution were determined by Zeta Sizer (Malvern Instruments, Model 3000 HSA, England). The size distribution of the nanoparticles was examined by transmission electron microscopy (TEM, FEI, Tecnai G2 F30, Oregon, USA). First, the PHEMA/IMEO nanoparticles were dropped on carbon coated copper grid and dried at room temperature. Then, digital photographs were taken at 200 kV by TEM. Fourier transform infrared spectroscopy (FTIR) spectra of the nanoparticles were obtained using a FTIR spectrophotometer (Varian FTS 7000, USA). The dry nanoparticles (about 0.1 g) were mixed with KBr (0.1 g, IR Grade, Merck, Germany) and pressed into a tablet form and the spectrum was recorded. In order to evaluate the amount of IMEO onto the nanoparticles, PHEMA/IMEO nanoparticles were subjected to elemental analysis using Elemental Analyzer (Leco, CHNS-932, USA).
Surface modification of SPR chip with allyl mercaptan
SPR chip modification with allyl mercaptan (CH2CHCH2SH) was described elsewhere (Uzun et al. Citation2009). The chip was immersed in 20 mL of acidic piranha solution (3:1 H2SO4:H2O2, v/v) for 20 s and washed with pure ethanol and dried in vacuum oven (200 mmHg, 40°C) for 3 h. Then, the chip was immersed in ethanol/water (4:1, v/v) solution for 12 h. Finally, it was rinsed with ethanol and dried with N2 under vacuum (200 mmHg, 40°C).
Nanoparticle attachment on SPR chip surface
First, PHEMA/IMEO nanoparticles solution (5 µL) was dropped onto the surface of SPR chip. Then, polymerization on the golden surface of chip was initiated by UV light at room temperature (100 W, 365 nm) under nitrogen atmosphere for 30 min.
Surface characterizations of modified SPR chip
FTIR-ATR spectrophotometer (Thermo Fisher Scientific, Nicolet iS10, Waltham, MA, USA) was used for the surface characterization of the modified SPR chip. Total light reflection from the chip surface was measured in a wave number range of 400–4000 cm−1 at 2 cm−1 resolution. Eighteen replicated FTIR-ATR spectra were obtained and baseline correction was done due to Ge window.
In order to characterize the surface of the modified SPR chip, atomic force microscope (AFM) was used in tapping mode (Nanomagnetics Instruments, Oxford, UK). AFM system can perform measurements in high resolution (4096 × 4096 pixels) because of the cantilever interferometer. SPR chip was attached on a sample holder by using double-sided carbon strip. Oscillation frequency (341.30 Hz), vibration amplitude (1 VRMS), and free vibration amplitude (2 VRMS) were the experimental parameters. Imaging studies were made in 2 µm/s scanning rate and 256 × 256 pixels resolution.
Contact angle measurements of the surface of SPR chip were also performed with KRUSS DSA100 (Hamburg, Germany) instrument to characterize the chip surface. Contact angle of the modified SPR chip was measured with sessile drop method using water as liquid phase. Ten separate photographs were taken from the different parts of the SPR chip surface and its contact angle values were measured for each drop. The reported contact angle values were calculated as average of the left contact angle, the angles from the left contact point of the droplet with solid, and the right contact angle, the angles from the right contact point of the droplet with solid. The average of the results was reported.
Kinetic studies of SPR chip
After the preparation and characterization steps of the SPR chip, the SPR chip was used for real-time detection of IgG molecules in aqueous solution by attaching it to SPR system (GenOptics, SPRiLab, Orsay, France). The SPR chip was washed with 20 mM phosphate buffer (pH: 7.4, 50 mL, 2.0 mL/min flow rate) and deionized water (50 mL, 2.0 mL/min flow rate). Then, the aqueous IgG solutions at different concentrations, in the range of 0.05–2.0 mg/mL, were applied to SPR system (10 mL, 2.0 mL/min flow rate). Reflectivity (%) change in resonance frequency was monitored instantly and reached to plateau value in 40 min for IgG, approximately. After each adsorption studies, desorption was achieved by applying 1 M NaCl (pH: 7.4, 20 mM phosphate buffer, 10 ml, 2.0 mL/min flow rate). At the end of the desorption step, the SPR chip was washed with phosphate buffer (pH: 7.4, 20 mM) and deionized water (50 mL, 2.0 mL/min flow rate). For each aqueous solution, adsorption–desorption cleaning steps were repeated. SPR1001 software (GenOptics, Orsay, France) was used to analyze the kinetic data obtained. To show the specificity and selectivity of the SPR chip, the response of the sensor was monitored while applying albumin, hemoglobin, and IgG solutions in singular manner and mixed solutions including IgG/albumin, IgG/hemoglobin, albumin/hemoglobin, IgG/albumin/hemoglobin in competitive manner.
The kinetic studies in human serum were also performed as second confirmation of the specificity of the modified SPR chip. For this aim, the blood samples were taken into EDTA containing tubes and, then, centrifuged at 1500 rpm at room temperature for 15 min. The serum samples diluted with isotonic solution (0.9% NaCl) in different ratios between 1/500 and 1/25.000 were applied to SPR system and kinetics measurements were performed.
Results and discussion
Characterization of PHEMA/IMEO nanoparticles
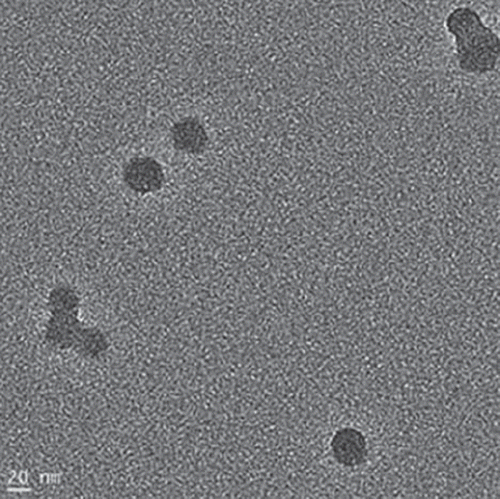
The PHEMA nanoparticles were produced by miniemulsion polymerization with an average size of 54.6 nm in diameter with a polydispersity index of 0.21 (). It is clear that the PHEMA nanoparticles are spherical with a relatively smooth surface and uniform as shown by the TEM image (). The small polydispersity index indicates that nucleation step is fast compared to particle growth and in addition to this, the absence of a secondary nucleation step (Karakoç et al. Citation2009). The PHEMA nanoparticles were highly dispersive in water by ultrasonication because of hydroxyl groups on the surface of nanoparticles. The dispersion state of the nanoparticles was confirmed visually by the observed white color of the suspension. The aqueous dispersion of nanoparticles was stable for several weeks.
Figure 1. Size distribution of PHEMA nanoparticles.
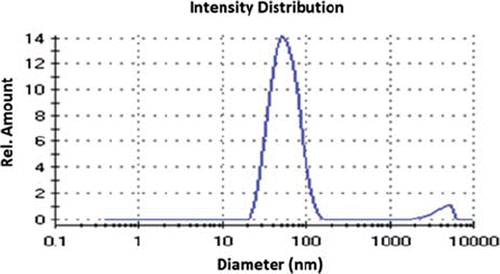
Figure 2. TEM image of PHEMA nanoparticles.
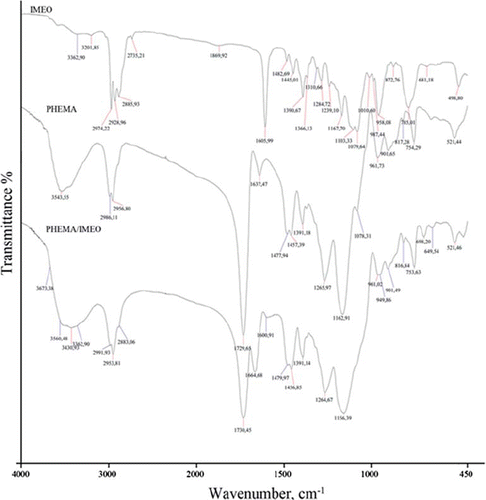
In the FTIR spectrum of the IMEO, the strong absorption bands at 1605 cm−1 assigned to the characteristic n(C–N) vibrations and indicated a strong band at 2928 and 2974 cm−1 n(C–H) (). For the FTIR spectrum of PHEMA nanoparticles, there is a strong band at 1729 cm−1 due to n(C = O) group and the 2956 cm−1 n(C–H) stretching of CH3, the 1265 cm−1 n(C–O) stretching vibration. The characteristic n(C = O), n(C = N), and n(C–H) stretching vibration bands of the PHEMA/IMEO nanoparticles are observed at 1730 cm−1, 1664 cm−1, 2953 cm−1, respectively. Beside these, the n(Si–O–C) vibration band is observed in the 1264 cm−1. As a result, the peak position of 1264 cm−1 is related to n(Si–O–C) and the observance of C = N bands of the PHEMA/IMEO at 1664 cm−1, the shifts of the C = N vibration to higher frequencies of 1664 cm−1 due to the IMEO binding onto the nanoparticles.
Figure 3. FTIR spectra of IMEO, PHEMA nanoparticles, and PHEMA/IMEO nanoparticles.
Surface characterization of modified SPR chip
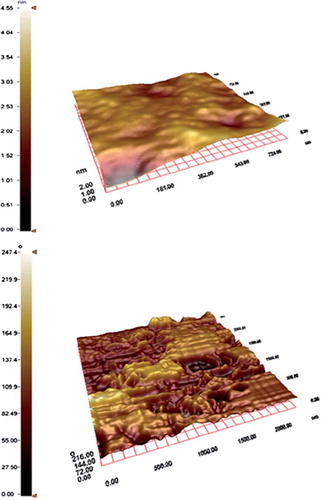
After immobilizing the PHEMA/IMEO nanoparticles onto the surface of SPR chip, the SPR chip was characterized by AFM, FTIR-ATR, and contact angle measurements. The specific n(C = O) band of the nanoparticle structure was determined at 1727 cm − 1. AFM images of the SPR chip were given in Figures 4A and 4B. It is clear from the figure that a rough polymeric layer was formed on the SPR chip due to polymerization process. The surface deepness of the SPR chip was increased from 4.55 to 58.23 nm after polymerization determined by AFM.
Figure 4. AFM images of SPR chip surface.
Kinetic studies with modified SPR sensor
The PHEMA/IMEO nanoparticles–attached SPR sensor was used to real-time monitoring of the interactions between the nanoparticle surface and IgG molecules in aqueous solutions. The SPR sensor was interacted with aqueous IgG solution at different concentrations in the range of 0.05– 2.0 mg/mL. As seen in , all steps including equilibration–adsorption–desorption–regeneration were almost completed in 50 min for IgG molecules. Increase in concentration leads to increase in sensor response. Meanwhile, reflectivity change increased from 0.3 to 2.5 in parallel to IgG concentration increased from 0.05 to 2.0 mg/mL.
Figure 5. Kinetic studies with PHEMA/IMEO nanoparticles attached on SPR chip.
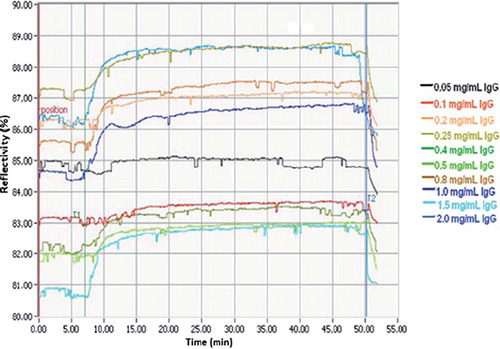
also shows the concentration dependency of PHEMA/IMEO nanoparticles–attached SPR sensor based on aqueous IgG solutions. As usual, the increase in concentration caused also an increase in sensor response. The binding tendencies of PHEMA/IMEO nanoparticles–attached SPR sensor to IgG molecules have high linearity and affinities with regression constants as 96.3% for former situation and 95.4% for latter one, respectively.
Mathematical analysis of kinetic data
To describe the detection system between the PHEMA/IMEO nanoparticles and the analyte molecules, and to analyze the interaction kinetic, five models including association kinetic analysis, Scatchard, Langmuir, Freundlich, and Langmuir–Freundlich models were applied to biosensing data.
where dΔR/dt is the rate of change of the SPR response signal, ΔR and ΔRmax are experimental and theoretical maximum sensor responses measured while binding of analyte molecule (reflectivity%/s), C is the injected concentration (mg/mL), ka is the association rate constant (mL/mg.s), kd is the dissociation rate constant (1/s), 1/n is Freundlich heterogeneity index. Binding constant, that is association constant KA, may be calculated as KA = ka/kd (mL/mg) and dissociation constant, KD (mg/mL), is equal to 1/KA.
The adsorption models are used to determine the recognition ability, interaction selectivity, and surface homogeneity in biosensors (Lin et al. Citation2005, Li and Husson Citation2006). Association kinetic analysis is an approach based on pseudo-first-order adsorption kinetic (Uzun et al. Citation2009, Krishnamoorthy et al. Citation2010). Scatchard model is generally used to analyze the data for freely reversible host/guest binding interactions and calculate the total number of binding sites the host has in equilibrium situation (Şener et al. Citation2010). Langmuir model depends on the acceptation of homogeneous distribution of interaction points with equal energy and no lateral interactions (Sari et al. Citation2011). Freundlich model is well fitted to heterogeneous surfaces (Wei et al. Citation2005). Mixed model, Langmuir–Freundlich can be applied to a system that is full fitted to both systems, provides heterogeneity information on adsorption behavior over wide concentration regions (Şener et al. Citation2010). The parameters calculated for all models were summarized in . The best fitted model to explain the interaction between the SPR chip and the analyte molecules is Langmuir isotherm (R2 = 0.9776). The linear fit with the Langmuir equation means that the binding of analyte molecules onto SPR chip is monolayer. Due to the results, KA and KD values were determined as 3.0 mg/mL and 0.334 mL/mg, respectively.
Table I. Kinetic and isotherm parameters for PHEMA/IMEO nanoparticles–attached SPR sensor.
Selectivity and specificity of PHEMA/IMEO nanoparticles–attached SPR chip
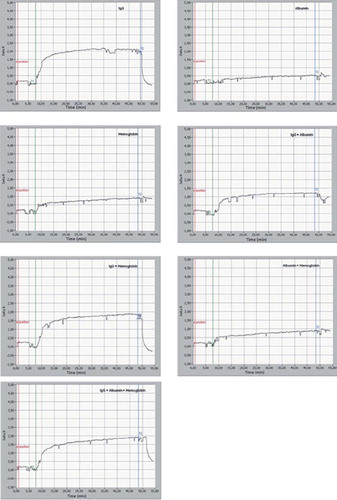
In order to determine the selectivity and specificity of the PHEMA/IMEO nanoparticles–attached SPR sensor, the real-time monitoring of interactions between the aqueous solutions of IgG, albumin, hemoglobin molecules and premixed protein solutions including IgG/albumin, IgG/hemoglobin, albumin/hemoglobin and IgG/albumin/hemoglobin molecules, and the SPR sensor was also investigated (). For this purpose, IgG, albumin, and hemoglobin solutions (1.0 mg/mL, pH: 7.4, phosphate buffer) were injected to modified SPR chip. shows that the SPR chip did not give any response to albumin and hemoglobin solutions while giving specific responses to IgG molecules with higher affinity. As a second selectivity confirmation of modified SPR chip, we applied the premixed protein solutions containing IgG (1.0 mg/mL)/albumin (1.0 mg/mL), IgG (1.0 mg/mL)/hemoglobin (1.0 mg/mL), albumin (1.0 mg/mL)/hemoglobin (1.0 mg/ mL), and IgG (1.0 mg/mL)/albumin (1.0 mg/mL)/ hemoglobin (1.0 mg/mL). Although premixed protein solutions (i.e., IgG/albumin, IgG/hemoglobin, and IgG/albumin/hemoglobin) cause lower SPR response arose from competitive and antagonistic effects of albumin and hemoglobin molecules, the PHEMA/IMEO nanoparticles–attached SPR sensor has still high affinity to IgG molecules under these competitive conditions. In , the PHEMA/IMEO nanoparticles–attached SPR sensor specifically detects IgG molecules in both singular manner and competitive one. For IgG molecule, the selectivity coefficients were calculated and the results are summarized in . As seen in , it is clear that the PHEMA/IMEO nanoparticles–attached SPR sensor specifically recognizes the IgG molecules. The selectivity coefficients calculated as ΔRIgG/ΔRcompetitor of the SPR chip for IgG molecules are 4.26 and 2.37 according to albumin and hemoglobin molecules, respectively.
Table II. Selectivity coefficients (SC) of PHEMA nanoparticles–attached SPR chip for IgG molecules.
Figure 6. Selectivity and specificity studies of modified SPR chip.
IgG detection in human serum
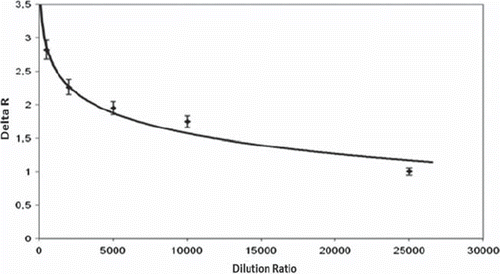
Serum samples were diluted in the range of 1/500–1/25.000 (). As expected in , the decrease in dilution ratio (in other words, the increase in IgG concentration) caused an increase in SPR sensor response. The PHEMA/IMEO nanoparticles–attached SPR sensor has a response even if 25.000 times diluted human serum sample was applied to the sensor. In conclusion, the PHEMA/IMEO nanoparticles–attached SPR sensor has the ability to detect IgG molecules in human serum (91% water, 7% proteins, 2% ions, gases, wastes, and hormones) and can be classified as a promising alternative to conventional detection systems.
Figure 7. SPR chip response in human serum.
Declaration of interest
The authors report no conflicts of interest. The authors alone are responsible for the content and writing of the article.
References
- Chailyan A, Tramontano A, Marcatili P. 2012. A database of immunoglobulins with integrated tolls: DIGIT. Nucleic Acids Res. 40:D1230–D1234.
- Ertürk G, Uzun L, Tümer MA, Say R, Denizli A. 2011. Fab fragments imprinted SPR biosensor for real-time human immunoglobulin G detection. Biosens Bioelectron. 28:97–104.
- Hamilton RG, Ambli D. 2001. The human IgG subclasses. Darmsstadt, Germany: CalBioChem-NovaBioChem.
- Jin J, Wang C, Tao Y, Tan Y, Yang D, Gu Y, et al. 2011. Determination of 3-nitrotyrosine in human urine samples by surface plasmon resonance immunoassay. Sensor Actuat B Chem. 153:164–169.
- Karakoç V, Yılmaz E, Türkmen D, Öztürk N, Akgöl S, Denizli A. 2009. Selective separation of human serum albumin with copper(II) chelated poly(hydroxyethyl methacrylate) based nanoparticles. Int J Biol Macromol. 45:188–193.
- Krishnamoorthy G, Carlen ET, van den Berg A, Schasfoort RBM. 2010. Surface plasmon resonance imaging based multiplex biosensor: Integration of biomolecular screening, detection and kinetics estimation. Sens Actuat B Chem. 148:511–521.
- Ladd J, Boozer C, Yu Q, Chen S, Homola J, Jiang S. 2004. DNA-directed protein immobilization on mixed self-assembled monolayers via a Streptavidin bridge. Langmuir. 20:8090–8095.
- Lee I, Luo X, Cui XT, Yun M. 2011. Highly sensitive single polyaniline nanowire biosensor for the detection of immunoglobulin G and myoglobin. Biosens Bioelectron. 26:3297–3302.
- Li X, Husson SM. 2006. Adsorption of dansylated amino acids on molecularly imprinted surfaces: A surface plasmon resonance study. Biosens Bioelectron. 22:336–348.
- Lin LP, Huang LS, Lin CW, Lee CK, Chen JL, Hsu SM, et al. 2005. Determination of binding constant of DNA-binding drug to target DNA by surface plasmon resonance biosensor technology. Curr Drug Target. 5:61–72.
- Merkoçi A. 2010. Nanoparticles-based strategies for DNA, protein and cell sensors. Biosens Bioelectron. 26:1164–1177.
- Miura N, Sasaki M, Gobi KV, Kataoka C, Shoyama Y. 2003. Highly sensitive and selective surface plasmon resonance sensor for detection of sub-ppb levels of benzo[a]pyrene by indirect competitive immunoreaction method. Biosens Bioelectron. 18:953–959.
- Nakamura C, Hasegawa M, Nakamura N, Miyake J. 2003. Rapid and specific detection of herbicides using a self-assembled photosynthetic reaction center from purple bacterium on an SPR chip. Biosens Bioelectron. 18:599–603.
- Öztürk N, Akgöl S, Günay ME, Denizli A. 2007. Silane-modified magnetic beads: application to immunoglobulin G separation separation. Biotechnol Prog. 23:1149–1156.
- Parak WJ, Gerion D, Pellegrino T, Zanchet D, Micheel C, Williams SC, et al. 2003. Biological applications of colloidal nanocrystals. Nanotechnology. 14:R15–R27.
- Patskovsky S, Jacquemart R, Meunier M, De Crescenzo G, Kabashin AV. 2008. Phase-sensitive spatially-modulated surface plasmon resonance polarimetry for detection of biomolecular interactions. Sensor Actuat B Chem. 133:628–631.
- Pålsson E, Nandakumar MP, Mattiasson B, Larsson PO. 2000. Miniaturised expanded-bed column with low dispersion suitable for fast flow-ELISA analyses. Biotechnol Lett. 22:245–250.
- Reichert JM, Rosensweig CJ, Faden LB, Dewitz MC. 2005. Monoclonal antibody successes in the clinic. Nat Biotechnol. 23:1073–1078.
- Rosi NL, Mirkin CA. 2005. Nanostructures in biodiagnostics. Chem Rev. 105:1547–1562.
- Sari MM, Armutcu C, Bereli N, Uzun L, Denizli A. 2011. Monosize microbeads for pseudo-affinity adsorption of human insulin. Colloid Surf B. 84:140–147.
- Şener G, Özgür E, Yılmaz E, Uzun L, Say R, Denizli A. 2010. Quartz crystal microbalance based nanosensor for lysozyme detection with lysozyme imprinted nanoparticles. Biosens Bioelectron. 26: 815–821.
- Sharma SK, Sehgal N, Kumar A. 2003. Biomolecules for development of biosensors and their applications. Curr Appl Phys. 3:307–316.
- Shen GY, Wang H, Deng T, Shen GL, Yu RQ. 2005. A novel piezoelectric immunosensor for the detection of carcinoembryonic antigen. Talanta. 67:217–220.
- Taylor AD, Ladd J, Yu Q, Chen S, Homola J, Jiang S. 2006. Quantitative and simultaneous detection of four foodborne bacterial pathogens with a multi-channel SPR sensor. Biosens Bioelectron. 22:752–758.
- Tsai WC, Pai PJR. 2009. Surface plasmon resonance —based immunosensor with oriented immobilized antibody fragments on a self-assembled monolayer for the determination of staphylococcal enterotoxin B. Microchim Acta. 166:115–122.
- Türkmen D, Yılmaz E, Öztürk N, Akgöl S, Denizli A. 2009. Poly(hydroxyethyl methacrylate) nanobeads containing imidazole groups for removal of Cu(II) ions. Mater Sci Eng C. 29:2072–2078.
- Uzun L, Say R, Ünal S, Denizli A. 2009. Production of surface plasmon resonance based assay kit for hepatitis diagnosis. Biosens Bioelectron. 24:2878–2884.
- Wei X, Samadi A, Husson SM. 2005. Synthesis and characterization of molecularly imprinted polymers for chromatographic separations. Sep Sci Technol. 40:109–129.