Abstract
Objective: Solid tumors are being treated using radiofrequency (RF) ablation under interventional magnetic resonance imaging (MRI) guidance. We are investigating the ability of MRI to monitor ablation treatments by comparing MR images of thermal lesions to histologically assayed tissue damage.
Material and Methods: An open MRI system was used to guide an ablation electrode into five rabbit thigh muscles and acquire post-ablation MR image volumes. We developed a methodology using a 3D computer registration to make spatial correlations. After MR and histology images were registered with an accuracy of 1.32 ± 0.39 mm (mean ± SD), a boundary of necrosis identified in the histology was compared with the outer boundary of the hyperintense region in MR images.
Results: For 14 T2-weighted MR images, the absolute distance between boundaries was 0.96 ± 0.34 mm (mean ± SD). Since the small discrepancy between boundaries is comparable to our registration accuracy, the boundaries may match exactly. Similar correlations to histology were obtained with a deformable model segmentation method.
Conclusions: This is good evidence that MR thermal lesion images can be used during RF ablation treatments to accurately localize the zone of necrosis at the lesion margin.
Introduction
Solid tumors and other pathologies can be treated using radiofrequency (RF) thermal ablation under magnetic resonance imaging (MRI) guidance Citation[1–5]. MRI has several advantages, including lack of ionizing radiation, excellent soft-tissue discrimination, sensitivity to blood flow and temperature, and the ability to image at any angle Citation[6], Citation[7]. In addition, MRI appears to be more accurate than ultrasound or computed tomography for monitoring the hyperacute effects of thermal ablation treatment Citation[8], Citation[9]. The major contribution of MRI is its potential to monitor the zone of thermal tissue destruction during the procedure. To monitor an ablation procedure, MRI can intermittently measure temperature during heating and provide structural images during and after treatment. Over several years, we have investigated this unique ability to monitor treatment by comparing MR lesion images acquired approximately 45 min post-treatment to tissue damage as seen histologically using 3D registration techniques. The ability of these MR images to accurately predict the region of eventual cell death would allow complete destruction of the disease tissue volume, including the margin, while avoiding the destruction of nearby normal tissue of critical importance.
The ability to determine the region of tissue destruction in near real time would be of significant value. With an assessment of the treatment soon after ablation, the therapy could be adjusted to compensate for deviations from pre-procedural predictions. One can apply treatment at multiple locations, and RF ablation procedures could be extended to the safe destruction of tumor adjacent to vital structures that might be damaged by heating.
Previous studies have indicated that regions of low MR signal in images obtained minutes after thermal ablation correlate with regions of tissue damage Citation[8], Citation[10], Citation[11]. Analysis was typically done using geometric measurements without alignment of histology to MR images Citation[8], Citation[10]. For example, in normal in vivo rabbit liver, Lee et al. Citation[10] manually measured diameters of T2-weighted and gadolinium contrast-enhanced (CE) T1-weighted MR lesion images and diameters of color changes in sectioned fresh tissue. In 6 lesions, diameters agreed within 3 mm. The typical response was a central hypointense region surrounded by a hyperintense rim. Lewin et al. Citation[8] manually estimated axial dimensions and used an ellipsoidal model to estimate tumor and thermal lesion volumes in humans with no tissue confirmation. From these studies, there is evidence that MR thermal lesion images reflect tissue damage. However, a careful regional correlation requires the alignment of histology to MR images. Our studies will carefully examine the relationship between cell damage and MR images on a voxel-by-voxel basis.
Our careful analysis of post-ablation MR images with respect to the tissue response has several advantages. First, it could allow for better understanding of the mechanism responsible for the MR signal changes. These signal changes could be due to different zones of necrosis or different zones of increased extracellular space. Second, this would allow one to compare the mechanism and pattern of tissue destruction of RF with those of other ablation techniques such as laser, even though similar MR observations are found. Finally, it could better explain the macroscopic tissue color changes used by several investigators to assess tissue damage Citation[8], Citation[10].
In this study we correlated hyperacute T2-weighted in vivo MR images with the tissue response. Using a rabbit thigh muscle model, we performed RF ablations and related MR to histological images using a 3D registration method. Changes in MR magnitude signals were compared with histopathological observations. We examined the hypothesis that the hyperintense region observed in T2-weighted MR thermal lesion images is a good predictor of eventual cell death. We present several experimental results showing the accuracy of MR images in reflecting the tissue response.
Materials and methods
Following a protocol approved by the Institutional Animal Research Committee, rabbits were anesthetized. After shaving each animal's abdomen and left thigh, we placed the rabbits in the prone position within the gantry of a clinical 0.2-T C-arm MRI system (MAGNETOM OPEN, Siemens, Erlangen, Germany). The legs of each rabbit were secured to a customized Plexiglas support to prevent movement of the thighs. After positioning two wire-mesh grounding pads coated with conductive gel on each rabbit's abdomen, we placed the thighs within a 12-cm-diameter multi-turn solenoid receive-only coil.
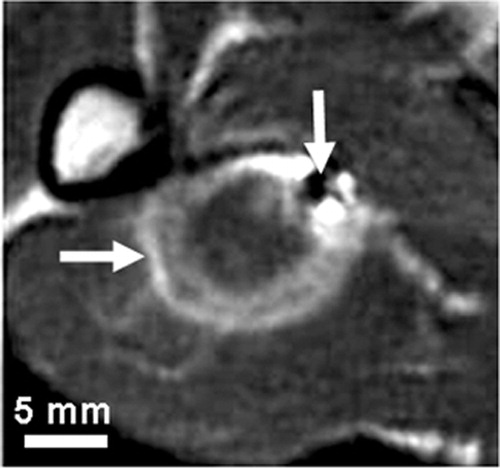
Under MR guidance, we inserted an MR-compatible titanium RF electrode with a 10-mm exposed tip (Radionics, Burlington, MA) percutaneously into the thigh muscle. Lesion formation was achieved by increasing the local temperature by delivering RF electric current between the electrode tip and ground pads. We applied RF energy for 2 min using a 100-W RF generator operating at 500 kHz (RFG-3C, Radionics, Burlington, MA). The tip of the RF electrode was maintained at a temperature of 90 ± 2°C using a thermistor within the electrode tip. Immediately after ablation, two MR-compatible fiducial needles were inserted into the thigh near the thermal lesion. Approximately 10 min after ablation, we acquired MRI volumes of the thigh. A T2-weighted MR sequence was applied to yield 0.70 × 0.70 × 3.0-mm voxels oriented to give the highest resolution for slices perpendicular to the RF electrode. shows a typical T2-weighted MR image acquired minutes after ablation. To examine latent tissue changes in response to the interventional procedure, the rabbits were sacrificed approximately 45 min after the ablation. After fixation, we removed the thigh from the bone for gross pathological and histological examination.
Figure 1. A typical T2-weighted in vivo MR image acquired minutes after ablation. The thermal lesion (horizontal arrow) is the bright elliptical region that has an isointense inner region surrounded by a hyperintense outer region. The small dark region (vertical arrow) is an MR image artifact of a fiducial needle inserted after the ablation, which was used to align the MR and tissue image volumes.
We obtained 3-mm tissue slices by using a specially designed apparatus that included a tissue platform, a digital camera (DSC-D770, Sony, Japan), and a linear displacement device (Rack and Pinion Slide, Edmund Scientific, Barrington, NJ) for accurate stepping of the platform in small increments. To orient the specimen and reduce deformation during slicing, we embedded the specimen in tissue embedding wax (50–54°C Parablast X-tra, Oxford Labware, St. Louis, MO). Tissue slicing was done in planes approximately perpendicular to a fiducial needle. We sliced the specimen with a tissue-slicing knife (Tissue-Tek Accu-Edge Semi-Disposable Autopsy Knife System, Sakura Finetek, Japan) using vertical supports of the apparatus as a guide. Repeatedly, we photographed the tissue-block face, advanced the platform by 3 mm, and sliced the tissue until the specimen was traversed. The tips of the fiducial needles were exposed at the tissue-block face for easy identification in each photograph, and stepped back slightly beyond the plane of the next tissue slice. We calibrated these macroscopic tissue images using a ruler in the plane of the tissue slice. The tissue images yielded square pixels that were typically 0.17 mm on each side. We embedded the tissue in paraffin and obtained hematoxylin and eosin (H&E) and Masson trichrome (MT) stained histological samples. Histology slides were digitized using a video microcopy system that consisted of a light microscope (BX60, Olympus, Japan), a video camera (DXC-390, Sony, Japan), a position-encoded motorized stage (ProScan, Prior Scientific, Rockland, MA), and controller software (Image-Pro with Scope-Pro, Media Cybernetics, Silver Spring, MD). To obtain an image of the entire slide, we used a software function that formed a large tiled map image with pixels that were typically 5.21 µm on each side. Using the video microscopy system and software program, we determined the location of tissue-damage boundaries on the slide, and marked the appropriate position on the map image. Cellular damage was defined by loss of the muscle's naturally occurring birefringence, which has been shown to be a reliable indicator of irreversible cell damage Citation[12], Citation[13]. Birefringence properties were determined by examining the slide under polarized light. A distinct boundary was marked, one where the tissue showed a loss of birefringence. The end result of this marking process was a histology image with a cell-damage boundary that could be compared with lesion boundaries seen in MR images.
We previously developed a method using 3D registration to align the histological and in vivo MR image data Citation[14], Citation[15]. Briefly, we used the macroscopic tissue images as the reference and registered histology and MR images to them using two different computer alignment steps. First, the MR volume was aligned to the volume of tissue images by registering the fiducial needles placed near the lesion. Second, we registered the histology images with the tissue images using a 2D warping technique that aligned internal features and the outside boundary of histology and tissue images. The above steps allowed us to match a pixel in a histology image with an interpolated sample from the in vivo MR image volume. This registration method has been validated Citation[14], and the accuracy determined from displacement of needle fiducials was estimated to be 1.32 ± 0.39 mm (mean ± SD).
We previously created a 12-parameter, 3D, globally deformable model with quadric surfaces that describes lesion boundaries Citation[16]. The model was automatically fitted to the grayscale MR volume through minimization of an objective function that simultaneously considers both 3D lesion geometry and 3D grayscale boundaries. The method attempts to place the inner and outer surfaces such that they intersect the greatest average dark-to-light and light-to-dark transitions, respectively. We applied this method to the T2-weighted MR images and compared the results to manually segmented MR and 3D-registered histological boundaries of cellular damage.
To evaluate the ability of MR images to predict tissue response, we compared the tissue-damage boundary identified in histology with boundaries marked by an observer in MR images. The observer manually segmented the outer boundary of the hyperintense region in the T2-weighted MR images. Segmentation was performed using a freehand region-of-interest tool in Analyze (Analyze Direct, Lenexa, KS), an image-analysis software. For each tissue slice, an automatic algorithm determined equally spaced points, 0.25 mm apart, along a spline interpolated along the histology boundary. For each such point, the algorithm found the closest point along a continuous spline interpolated from the corresponding MR boundary. A signed 2D Euclidean distance between each point-pair was determined such that if the MR point was closer to the boundary centroid than the histology point, the distance was negative; else it was positive. This allowed us to determine if one boundary was interior or exterior to the other.
Results
In we show bright-field histology images of skeletal muscle from a rabbit sacrificed approximately 45 min post-ablation. The histological samples were obtained approximately perpendicular to the RF needle. A distinct thermal lesion can be seen surrounding the RF needle track.
Figure 2. Typical Masson trichrome-stained histology images show a zonal response. The image of the entire histology slide (top left) was formed by tiling a series of pictures as described in the Materials and methods section. Magnified (100 × ) histology images (zones A, B and C) show characteristics following RF ablation in rabbit thigh muscle. The labeled boxes in the entire histology image show the location of the magnified histology images. A distinct thermal lesion can be seen as an elliptical region stained light purple. In the central zone of the lesion (zone A), the RF needle track is seen as an empty cavity. The figure is reproduced in colour in the online issue of Computer Aided Surgery.
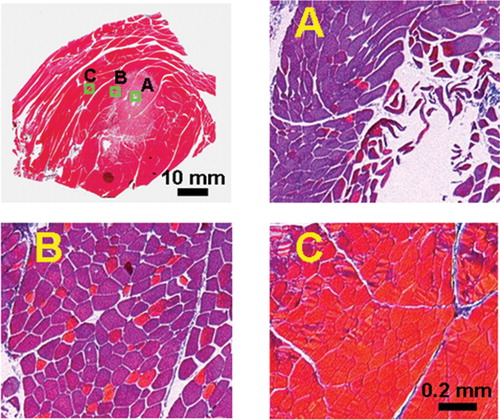
In the central region of the lesion (zone A), the majority of the cell nuclei are smaller and somewhat pyknotic, and the cytoplasm shows evidence of contraction band necrosis (focal band-like coagulation of contractile elements). The cytoplasm of the skeletal muscle cells is metachromatic rather than red on MT staining. Under polarized light, the cells are dark due to a significant loss of birefringence.
Further from the lesion center, there is a well-demarcated transition zone (zone B) with both metachromatic and red cells on MT staining, and more extracellular space than normal muscle. The cells show evidence of contraction band necrosis, lack nuclei, are shrunken and distorted with a wavy or fragmented appearance, and are associated with marked interstitial edema. We sometimes found pools of red blood cells indicative of hemorrhage. Under polarized light, there are both dark and bright cells due to a partial loss of birefringence.
This tissue response is very sharply delimited against adjacent normal muscle tissue (zone C). The normal cells appear bright under polarized light since they are completely birefringent. Results were remarkably similar in other experiments.
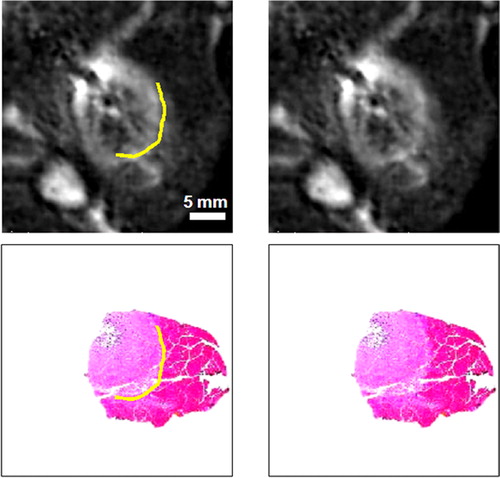
In , we copied the outer boundary of zone B, identified manually in the histological samples, to the registered MR images. This cell-death boundary matched closely to the outer boundary of the hyperintense region in the MR images. In some slices, histology sections were intact over the entire lesion; here we show a histology fragment that was again registered using the 3D registration steps. This fragment was chosen because of the clear staining. Results were remarkably similar across several adjoining images.
Figure 3. Comparison of the cell-death boundary identified in histology with the MR image features. The registered images at left and right are identical except for graphical overlays on the left-hand images showing the cell-death boundary (in yellow). The upper images are in vivo T2-weighted MR lesion images; the lower pair are Masson trichrome-stained histology images. The boundary corresponds to a region of decreased stain uptake and a loss of the muscle's birefringence. The boundary is marked on the histology image with a graphical overlay and copied to the registered MR image, where it matches the outer boundary of the hyperintense region in the MR image. Other white regions in the MR images are streaks of fat and the elliptical femur bone in the lower left corner. The figure is reproduced in colour in the online issue of Computer Aided Surgery.
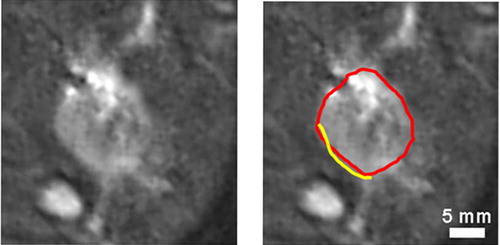
To further investigate the correlation of MR and histology images, we compared the necrotic boundary with the outer boundary of the hyperintense region marked by an observer in the registered T2-weighted MR images, as shown in . For five rabbit experiments, the boundaries were well aligned in 14 registered histology slices with an absolute distance of 0.96 ± 0.34 mm (mean ± SD). The signed distances were not significantly different from zero (p = 0.142), which is good evidence of insignificant bias between the boundaries. Once again, 3D registration was independently achieved using fiducial needles. Furthermore, we compared the necrotic boundary identified manually in histological sections with the outer boundary of the hyperintense region automatically segmented in MR images. The histology and MR boundaries matched closely in all registered histology slices.
Figure 4. Comparison of the cell-death boundary with the outer boundary of the hyperintense region in the MR image. Post-ablation T2-weighted MR images at left and right are identical except for graphical overlays on the right-hand image showing the cell-death boundary (in yellow) and the outer boundary of the hyperintense region (in red). The MR boundary is manually marked with a graphical overlay. The cell-death boundary is marked on the registered histology image with a graphical overlay and copied to the MR image. The white regions in the MR images are strips of fat and the elliptical femur bone in the lower left corner. The figure is reproduced in colour in the online issue of Computer Aided Surgery.
Discussion
Our results suggest that it is possible for hyperacute MR lesion images (i.e., acquired within minutes) to predict the tissue response. Features such as 3D registration of in vivo MR images to histology images and accurate segmentation of tissue-damage boundaries on a large histology image are important steps in accurately correlating the tissue response to in vivo MR thermal lesion images. For these experiments, we determined that the outer boundary of the hyperintense region in MR images and the boundary of necrosis in histology are well correlated. The mean difference between the boundaries for T2-weighted images was 0.96 mm. This value compares favorably to the MR in-plane voxel width (0.70 mm) and thickness (3.00 mm).
Histology images showed a distinct central region characterized by muscle cells with total loss of birefringence and contraction band necrosis. Surrounding this was an exceptionally well-demarcated peripheral region having increased extracellular spaces and cells with damaged contractile elements, partial loss of birefringence, and contraction band necrosis. This tissue response was very sharply delimited against adjacent normal tissue. It is believed that the central and peripheral regions correspond to the region of eventual necrosis.
Although the exact determination of cell viability is difficult, proliferative contraction band necrosis within the region of birefringence loss suggests that it is most likely non-viable. Upon thermal injury, a loss of birefringence occurs due to the disarray of the regular matrix of the actin and myosin molecules, and this has been previously shown to correspond to a region of eventual necrosis Citation[12], Citation[13].
A comparison of MR and tissue response 45 min post-ablation showed that the outer boundary of the hyperintense region in MR images closely corresponds to the region of dead or irreversibly damaged cells in histology. These results are consistent with our findings from experiments with rabbits sacrificed 4 days post-ablation, which show the complete extent of the cell death in a well-demarcated region of necrosis in histology. A correlation of histology and MR images 4 days post-ablation showed that the boundary of cell death closely corresponds to the outer boundary of the hyperintense region, with a mean absolute distance for 20 tissue slices of 0.95 ± 0.34 mm for T2-weighted MR images Citation[17]. To relate the outer boundary of the hyperintense region in MR images at 4 days and 45 min post-ablation, we developed a 3D ellipsoidal model that is described in detail and validated elsewhere Citation[16]. We fitted this model to the outer boundary of the hyperintense region in both MR volumes for 10 lesions. The longest radius of the ellipsoid corresponds to the direction of the RF electrode. Since we slice our tissue approximately perpendicular to the RF electrode, we compared the two short radii of the ellipsoid at 45 min and 4 days post-ablation. At 45 min post-ablation, the mean lengths of the two short radii were not statistically different, indicating a circularly symmetric lesion along the RF electrode. Similar results were obtained at 4 days post-ablation. Furthermore, the mean lengths of the two short radii at 45 min and 4 days post-ablation were not significantly different. The mean length of the longest radius increased by typically 3.5 mm between 45 min and 4 days post-ablation. Therefore, we can infer that the outer boundary of the hyperintense region in the MR images at 45 min post-ablation is a reliable marker of cell death with no evidence of cell recovery.
It is possible that the MR and histology boundaries match exactly and that the small measured differences are due to limitations of our methodology. There are a variety of reasons why this might occur. First, registration error might arise from both the alignment of the MR volume with the tissue sections and the warping of histological sections to the tissue sections. Second, we note that, although registration was performed in 3D, distance calculations were performed on a 2D basis due to the slice nature of histological sections. This approach tends to overestimate distance errors, as, for a given point along a histology border, the closest point along the MR boundary may be slightly out-of-plane. Third, the in-plane resolution of the histological images (pixel width 0.17 mm) was approximately four times that of the acquired MR slices (voxel width 0.7 mm). This allows partial volume effects to blur several histological pixels into a single MR voxel. In addition, the 3D registration and re-slicing procedure may further reduce the effective in-plane MR resolution through out-of-plane tilting, as the MR slice thickness was greater than the in-plane resolution. However, this effect was minimized by acquiring both histological and MR data approximately perpendicular to the electrode path. Overall, given the above considerations, the small differences detected between corresponding histology and MR boundaries are most likely insignificant; the outer boundary of the hyperintense region in MR probably corresponds to cell death.
We conclude that our 3D methodology can be used to accurately map tissue response to MR thermal lesion images. Results show that, in rabbit thigh muscle, the outer boundary of the hyperintense region in T2-weighted MR images obtained minutes after RF ablation closely corresponds to the region of cell damage. This is good evidence that iMRI thermal lesion images can be used for real-time feedback during thermal RF ablation treatments.
Acknowledgments
The authors thank Perrin Cheung, B.S., for assistance with rabbit ablation experiments and acquisition of histology images; Miyuki Breen, B.S., for assistance with statistical analysis; and Maryann Fitzmaurice, M.D., for histological analysis. This research was supported by NIH grants R01-CA84433, R01-CA81431 and R01-EB001052. Dr. Breen is supported, in part, by an NIH training grant. Dr. Lazebnik is supported by a Whitaker Foundation graduate fellowship and the CWRU Medical Scientist Training Program.
References
- Lo H W, Tsai Y J, Chen P H, Chen H Y, Ker C G, Juan C C. Radiofrequency ablation for treatment of hepatocellular carcinoma with cirrhosis. Hepatogastroenterology 2003; 50: 645–50
- Ghanem I, Collet L M, Kharrat, K, Samaha E, Deramon H, Mertl, P, Dagher F. Percutaneous radiofrequency coagulation of osteoid osteoma in children and adolescents. J Pediatr Orthop B 2003; 12: 244–52
- Livraghi T, Solbiati, L, Meloni F, Ierace T, Goldberg S N, Gazelle G S. Percutaneous radiofrequency ablation of liver metastases in potential candidates for resection: the “test-of-time approach”. Cancer 2003; 97: 3027–35
- Farrell M A, Charboneau W J, DiMarco D S, Chow G K, Zincke, H, Callstrom M R, Lewis B D, Lee R A, Reading C C. Imaging-guided radiofrequency ablation of solid renal tumors. AJR Am J Roentgenol 2003; 180: 1509–13
- Mirza A N, Fornage B D, Sneige N, Kuerer H M, Newman L A, Ames F C, Singletary S E. Radiofrequency ablation of solid tumors. Cancer J 2001; 7: 95–102
- Schenck J F, Jolesz F A, Roemer P B, Cline H E, Lorensen W E, Kikinis R, Silverman S G, Hardy C J, Barber W D, Laskaris E T. Superconducting open-configuration MR imaging system for image-guided therapy. Radiology 1995; 195: 805–14
- Cline H E, Schenck J F, Watkins R D, Hynynen K, Jolesz F A. Magnetic resonance-guided thermal surgery. Magn Reson Med 1993; 30: 98–106
- Lewin J S, Connell C F, Duerk J L. Interactive MRI-guided radiofrequency interstitial ablation of abdominal tumor: Clinical safety and feasibility. J Magn Reson Imaging 1998; 8: 40–7
- Gazelle G S, Goldberg S N, Solbati L, Livraghi T. Tumor ablation with radiofrequency energy. Radiology 2000; 217: 633–46
- Lee J D, Lee J M, Kim S W, Kim C S, Mun W S. MR imaging-histopathologic correlation of radiofrequency thermal ablation lesion in a rabbit liver model: observation during acute and chronic stages. Korean J Radiol 2001; 2: 151–8
- Morrison P R, Jolesz F A, Charous D, Mulkern R V, Hushek S G, Margolis, R, Fried M P. MRI of laser-induced interstitial thermal injury in an in vivo animal liver model with histologic correlation. J Magn Reson Imaging 1998; 8: 57–63
- Thomsen S, Pearce J A, Cheong W F. Changes in birefringence as markers of thermal damage in tissues. IEEE Trans Biomed Eng 1989; 36: 1174–9
- Thomsen S. Pathologic analysis of photothermal and photomechanical effects of laser-tissue interactions. Photochem Photobiol 1991; 53: 825–35
- Breen M S, Lancaster T L, Lazebnik R S, Nour S G, Lewin J S, Wilson D L. Three dimensional method for comparing in vivo interventional MR images of thermally ablated tissue with tissue response. J Magn Reson Imaging 2003; 18: 90–102
- Lazebnik R S, Lancaster T L, Breen M S, Lewin J S, Wilson D L. Volume registration using needle paths and point landmarks for evaluation of interventional MRI treatments. IEEE Trans Med Imaging 2003; 22: 653–60
- Lazebnik R S, Weinberg B D, Breen M S, Lewin J S, Wilson D L. Three-dimensional model of lesion geometry for evaluation of MR-guided thermal ablation therapy. Acad Radiol 2002; 9: 1128–38
- Lazebnik R S, Breen M S, Fitzmaurice M, Nour S G, Lewin J S, Wilson D L. Radiofrequency-induced thermal lesions: subacute magnetic resonance appearance and histological correlation. J Magn Reson Imaging 2003; 18: 487–95