Abstract
Objective: The Op3D visualization system allows, for the first time, a surgeon in the operating theatre to interrogate patient-specific medical data sets rendered in three dimensions using high-performance computing. The hypothesis of this research is that the success rate of hepato-pancreatic surgical resections can be improved by replacing the light box with an interactive 3D representation of the medical data in the operating theatre.
Materials and Methods: A laptop serves as the client computer and an easy-to-use interface has been developed for the surgeon to interact with and interrogate the patient data. To date, 16 patients have had 3D reconstructions of their DICOM data sets, including preoperative interrogation and planning of surgery.
Results: Interrogation of the 3D images live in theatre and comparison with the surgeons' operative findings (including intraoperative ultrasound) led to the operation being abandoned in 25% of cases, adoption of an alternative surgical approach in 25% of cases, and helpful image guidance for successful resection in 50% of cases.
Conclusions: The clinical value of the latest generation of scanners and digital imaging techniques cannot be realized unless appropriate dissemination of the images takes place. This project has succeeded in translating the image technology into a user-friendly form and delivers 3D reconstructions of patient-specific data to the “sharp end”—the surgeon undertaking the tumor resection in theatre, in a manner that allows interaction and interpretation. More time interrogating the 3D data sets preoperatively would help reduce the incidence of abandoned operations—this is part of the surgeons' learning curve. We have developed one of the first practical applications to benefit from remote visualization, and certainly the first medical visualization application of this kind.
Introduction
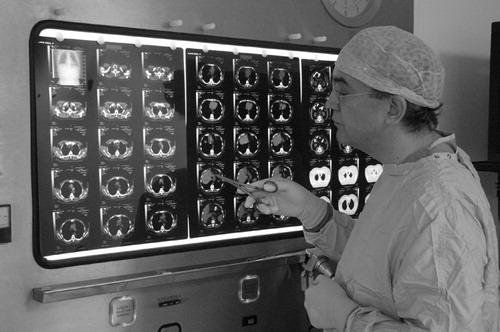
The common practice in an operating theatre is to interrogate the patient's medical scan data on film using a light-box display (). This environment has several limitations, in particular:
The latest generation of medical scanners—such as multislice/multidetector-row CT, or high-gradient MR scanners—are capable of producing large numbers of high-resolution images with fast acquisition times, so that series of 700 images or more are becoming the norm. However, only a fraction of such an image series can be displayed on the light box, and much information is never seen by the surgeon.
The surgeons must use the relatively small number of two-dimensional images displayed on the light box (50–60) and rely on their visual-cerebral capabilities to translate the image “slices” into 3D anatomy and memorize them as they turn to the operating table. This is not an easy skill to acquire.
Figure 1. Surgeon interrogating the 2D images using a light box.
This paper provides a detailed description of the Op3D system and discusses the clinical benefits that have been obtained. Our first steps, which are described below, have focused on volume visualization. However, we have created a framework that can be used for the delivery of other advanced functionality that requires high-performance computing, such as physiology modeling.
Materials and methods
The aim of the project has been to provide a fully functional high-performance 3D visualization tool for the surgeon. The research and development activities have focused on two main areas:
Technology integration: data handling, volume-rendering code, resource allocation, and user interface and input/output peripherals.
Clinical case studies.
These are explained below. A more complete technical description of Op3D can be found elsewhere Citation[1].
Volume rendering
Levoy Citation[2] first demonstrated the ability to produce high-quality 3D visualizations of medical data using volume rendering. This technique has now become well established, and has recently been reviewed Citation[3]. The object is represented as a 3D array of voxels. Volume visualization methods define a function that will transform the volume onto the screen in a way that maintains the true representation of the desired details despite the suppression of one dimension. A key advantage of volume rendering is that all the data is used and presented to the clinician in an intuitive manner. Scanner manufacturers do provide high-end workstations that support such 3D visualization, and these workstations are commonplace in radiology departments. Frustratingly, however, this facility has not yet been delivered to the sharp end of surgical practice—the hospital operating theatre. Even if it were to be made available, the application software is complex and not suited to rapid intuitive interaction by a non-radiological specialist. This is the initial goal for the Op3D system.
A drawback of volume rendering is that it is a compute-intensive task and it can take many minutes to generate a 3D rendering. However, interactive volume rendering is possible with computer graphics hardware support. Special-purpose hardware has been built Citation[4] and provides good results. Bailey Citation[5] has demonstrated how the commercially available VolumePro PC card (TeraRecon, Inc., San Mateo, CA) can be used for volume rendering of medical data, and his system has recently been used to aid in cancer research. The latest version of the VolumePro hardware can deliver up to 30 fps for 512 × 512 × 512 voxel data. Only a few hospitals currently have access to PCs with VolumePro cards, however, and these were not available for the Op3D project.
Another well-known hardware acceleration technique is to use texture-mapping hardware Citation[6]. This is often called volume slicing, and has been used successfully in several clinical applications. The best performance is obtained on high-performance SGI (Mountain View, CA) workstations, where 3D texture hardware is available and data sets of 512 MB or greater can be loaded into the dedicated texture memory. This is more than sufficient to cope with the size of data sets from today's modern scanners. Hardware look-up tables are used to apply color and opacity to the visualization. SGI provide an application programming interface called OpenGL Volumizer (http://www.sgi.com/software/volumizer/) that enables a software developer to take advantage of texture hardware support. High-end SGI workstations cannot easily be deployed in an operating theatre, however.
The texture-mapping technique can also be adapted for more commonly available 2D texture hardware. In this case, three copies of the voxel data are required, sampled across the three orthographic projections. Only one data set is used for the rendering stage at any one time, and as the volume-rendered data is rotated it is necessary to switch between the three data sets used in the rendering calculation. This quickly becomes a significant overhead as the texture memory requirement is three times the size of the data set. More recently, standard PC graphics boards have become capable of implementing the volume slicing technique Citation[7],Citation[8]. The size of the volume that can be manipulated is limited by the amount of dedicated graphics memory available, and currently this can easily become a bottleneck when dealing with medium/large data sets. Texture data must be fetched via the Accelerated Graphics Port (AGP) from the main memory of the PC, and this prevents interactive performance from being achieved.
Remote visualization
Recent developments in high-performance visualization have made it possible to run an application on a visualization server and deliver the results in real time across the computer network to a client workstation. This is achieved by streaming the contents of the frame buffer on the server (where the graphics primitives are rendered) in a similar fashion to how MPEG movie files are streamed across the internet.
OpenGL Vizserver (http://www.sgi.com/software/vizserver/) from SGI was the first product to support remote visualization. Other products are now starting to appear that provide similar functionality, such as AquariusNET from TeraRecon that uses a visualization server with a VolumePro card (http://www.terarecon.com/products/aq_net_1_prod.html). All these products require good bandwidth on the data network to ensure interactive updates on the client—typically 100 Mb/s is a minimum requirement. Remote visualization can be used to facilitate volume rendering of large data sets on a high-end workstation, with the results being sent to a laptop client.
Technology integration
Medical data of the patient in the standard DICOM format is transmitted to a visualization server located at the Manchester Visualization Centre. We are primarily using CT data of the patient's abdomen—typically up to 700 slices at 512 × 512 pixel resolution, with a pixel size of 0.78 mm and an inter-slice distance of 1 mm. We have written software to extract the raw image data from the DICOM format and store it locally.
An easy-to-use medical visualization application has been written using OpenGL Volumizer. The raw image data is processed using the volume slicing technique described above. The volume reconstruction is then delivered across the network to the operating theatre in the Manchester Royal Infirmary—1 km distant from the server. Remote visualization is facilitated by the OpenGL Vizserver software. shows a system diagram for Op3D.
Figure 2. Op3D system diagram.
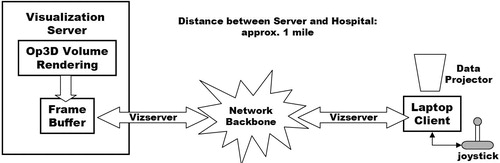
The visualization server is connected to the university's Gigabit network backbone. A 100baseT Ethernet link was installed from the backbone to the operating theatre in the hospital. Although Vizserver supports compression of the frame buffer image, this was undesirable for Op3D. The surgeon requires the highest-quality images to aid his interpretation and planning. The potential bottleneck was the 100 Mb/s connection to the hospital. However, after configuring the network routing so that no other users were allowed to share this connection, the network bandwidth was sufficient to allow uncompressed images to be streamed to the operating theatre.
Each Vizserver session is allocated exclusive access to up to two of the graphics pipes on the SGI server. Only one pipe is required by Op3D, as the dedicated 3D texture memory on a single pipe is sufficient for the data sets currently being obtained. A booking mechanism is included with the Vizserver software so that the needed resource can be guaranteed for the time of the operation.
Using Op3D
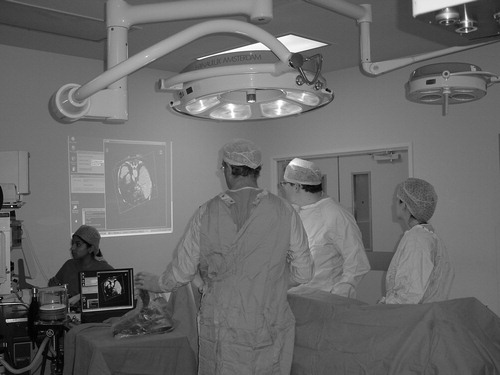
The Op3D client is a standard laptop computer located in the operating theatre. Large volume-rendered images of the patient data are then projected onto the theatre wall using a data projector attached to the laptop. A “computer game” joystick allows the surgeon to easily interact with the 3D reconstructions. The joystick was covered with a sterile amputation bag (), but this did not affect the ability of the surgeon to use the device. Other peripherals such as mice and trackballs were also experimented with, but would not function correctly when inside a sterile bag.
Figure 3. The Op3D system in use.
An important part of the design of Op3D is to optimize its functionality and user interface for use in an operating theatre. The surgeon works in a sterile environment, wears surgical gloves, and is surrounded by other theatre staff and a variety of equipment. It was therefore important that the software be easy to use and offer no distractions from the procedure being performed. In contrast to the existing comprehensive software supplied by scanner manufacturers, no menus were used within the Op3D system and all interaction could be performed with just a button click on the joystick. The patient data set was selected when the application started. We also studied the way in which the surgeon interacted with the 3D data and found that he invariably followed a regular pattern: he would rotate the volume, change transparency settings, zoom into an area of interest, and then manipulate a clip plane to look inside the volume. Clip plane manipulation involves rotation of the clip plane, translation of the clip plane, and rotation of the volume currently being displayed. An “interaction profile” of the surgeon emerged and was encoded and stored in a text file. The profile could then be automatically loaded into Op3D at start-up and used to control the state changes within the software. Using the above profile, the surgeon was able to rotate the volume initially. A button click resulted in the operation mode being changed to transparency manipulation, the next button press selected zoom mode, and so on. A small icon was used to provide the surgeon with visual confirmation of the current mode of operation. Intra-operative ultrasound was also used in theatre, and the ultrasound images were used in tandem with the 3D visualization to help verify the surgeon's diagnosis.
Note that the Op3D software is also regularly used pre-operatively to assist with diagnosis and surgery planning. Any optimum view of the volume data identified by the surgeon can be saved as a “bookmark”. In theatre, these views can be recalled by a simple button press. As well as particular views, the surgeon can also select volumes of interest—“targets”—that he may want to focus on during the operation. To do this, the surgeon can select a point on the bounding box of the volume or on the clipping plane through the volume by a mouse click. A semi-transparent sphere is displayed at the point click and the radius of this sphere is then adjusted by holding down and dragging the mouse button. The size of the sphere is used to determine how close the camera can get to the target. Several targets can be stored (e.g., on the front and rear of the volume), with the transition between them being automated as described below. During the navigation stage the target spheres are not visible.
A further innovation with the user interface was to apply physical properties to the movements of the virtual camera through which the Op3D scene is viewed. This part of the project was carried out in collaboration with SGI, who provided access to prototype navigational agent technology. SGI have a goal of providing a natural and intuitive eye-point control system for navigation in all types of virtual environments, harnessing the laws of physics, and resulting in a cinematic, but interactive style of navigation through the scene. Within the context of Op3D, we want to provide the surgeon with automatic smooth navigation between the volume targets that he has selected. Instead of a simple interpolation technique, this new approach involves using simulated forces and torques applied to the camera motion. shows two examples of motion paths for the camera designed to move around but not through the volume.
Figure 4. Camera navigation in Op3D.
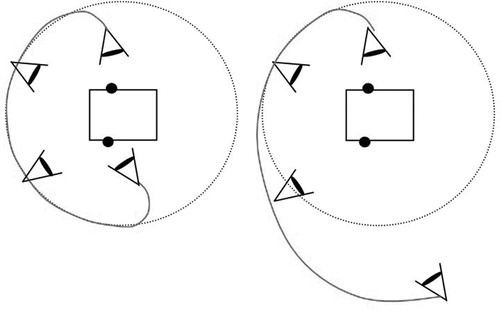
A spring model is used to “tether” the camera to the target. An appropriate force is calculated and applied to the camera to take it on a path around the volume, and a torque is applied to rotate the camera so that it faces the target from its front. The result is the desired smooth motion. A drawback is the extra overhead involved in calculating the forces and torques. In the current implementation of Op3D, the calculation of the motion path is too slow. However, this initial use of navigational agents has been shown to be of value to the surgeon and is being developed further.
Results
To date, 16 patients have had 3D reconstructions of their DICOM data sets, including preoperative interrogation and planning of surgery. Examples of the results obtained are presented below. The sequence of images in Figures, and have been taken from interrogations using Op3D.
Figure 5. An inoperable cancer of the head of pancreas.
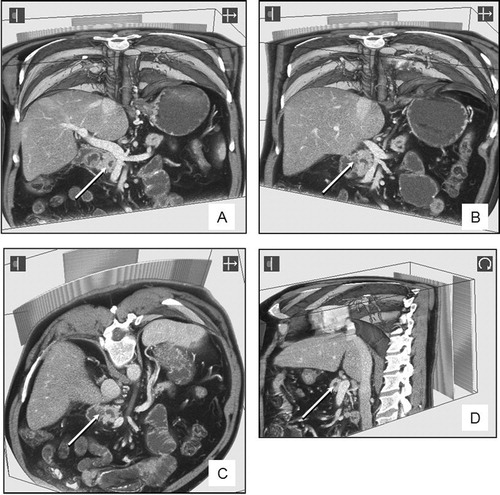
Figure 6. Two small cysts in the tail of the pancreas.
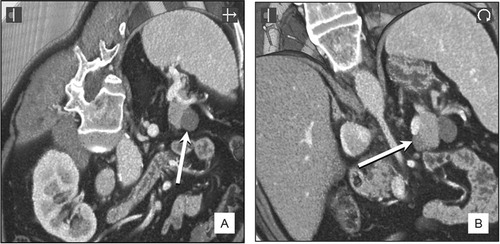
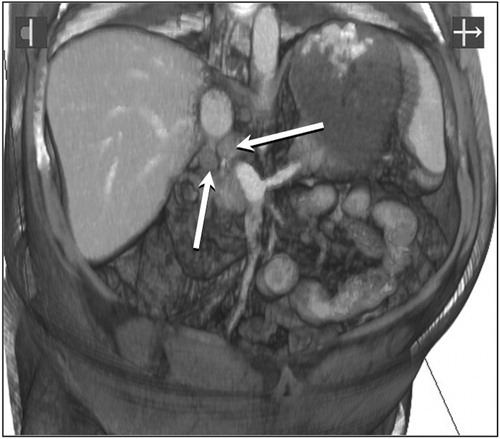
Figure 7. Enlarged lymph nodes at the neck of the pancreas in a patient with familial polyposis.
Pre-operative planning
Interaction with the 3D reconstructions can be used for pre-operative planning, which includes assessment of potential inoperability. Viewing the data set from different clip planes, especially the vertical or oblique views, can demonstrate that a patient may have an inoperable tumor and thus avoid unnecessary surgery.
–D were part of a pre-operative review of a dataset from a patient with a previously inoperable pancreatic cancer involving the second part of the duodenum and the portal vein. The tumor is indicated by an arrow. shows a vertical clip plane and the relationship with the mesenteric and portal veins (white with intravenous contrast). The relationship between the tumor can be viewed from different angles by tilting the clip plane to the right () or obliquely (). Further interrogation of the data set (viewed from the left side in ) demonstrates that the tumor is still inoperable and crossing to the left of the portal vein (outside the field of the planned surgical resection).
In another patient who was thought to have an endocrine tumor near the tail of the pancreas, pre-operative interrogation of the CT dataset confirmed the presence of two small peri-pancreatic cysts (indicated by arrows on and ). Surgery was not required, but had it been undertaken, intra-operative “live” 3D demonstration of the cyst (indicated by an arrow in 6B) and its immediate relationship to the splenic vein (the bright structure just above the arrowed cyst in 6B) would have been helpful in improving surgical accuracy and safety.
Intra-operative interrogation
Intra-operative interrogation of data sets was performed by the surgeon using a sterile interface whilst viewing the 3D data set projected on the wall of the operating theatre with a XVGA data projector from the laptop computer linked to the computer server (see ).
shows two potentially malignant lymph nodes lying just behind the portal vein, above the neck of the pancreas (arrowed) in a patient with familial polyposis and duodenal polyps. Vertical and oblique clip-plane manipulations of the data set by the surgeon, whilst operating in that area, helped in the accurate localization of the glands that were excised for biopsy.
Discussion
The clinical value of the latest generation of scanners and digital imaging techniques cannot be realized unless appropriate dissemination of the images takes place. This project has succeeded in translating the image technology into a user-friendly form and delivers 3D reconstructions of patient-specific data to the “sharp end”—the surgeon undertaking the tumor resection in theatre—in a manner that allows interaction and interpretation. The ability of the surgeon to locate and resect tumors in the liver and pancreas has certainly been improved in terms of reduced time taken and accuracy of the results. This in turn has benefits for the patient, including less time in theatre and reduced recovery times. Twenty-five percent of operations in this series were abandoned when the tumor was found to be inoperable. In retrospect, this was due to the surgeons' learning curve in using Op3D and gaining experience of the aspects from which the images should be viewed. Furthermore, in this pilot series of patients, definitive decisions on patient management were not going to be made until the accuracy of the visualizations had been tested against the gold standard of operative findings. The use of high-resolution CT data sets—currently 0.625-mm voxels—has improved the accuracy of the surgical interpretation.
Current work is extending Op3D to take advantage of the fast-emerging computational Grid infrastructure Citation[9]. This will provide the necessary environment for job scheduling and security of data. This low-level functionality will be made transparent to the surgeon. We also plan to introduce collaboration support so that consultation with an expert located elsewhere on the network can be done from the operating theatre using Op3D images. Op3D also provides the infrastructure needed to use high-performance computing so that physiology modeling or augmented surgery applications can be exploited in the operating theatre. Recent work by Bornik et al. Citation[10], for example, has shown the potential of using computer-augmented liver surgery planning to support finding the optimal treatment strategy for each patient. The computational demands of applications such as these will remain beyond the capabilities of a desktop PC or laptop for some time to come. We plan to use the Op3D infrastructure for early investigation of how the new generation of computer tools can be delivered to surgical environments. To date, we have developed one of the first practical applications to benefit from remote visualization, and certainly the first medical visualization application of this kind.
Part of this research was previously presented at the 17th International Congress on Computer Assisted Radiology and Surgery (CARS 2003), held in London, June 2003.
References
- John N W. High performance visualization in a hospital operating theatre. Proceedings of Theory and Practice of Computer Graphics (TPCG03). IEEE Press, 2003; 170–5
- Levoy M. Efficient ray tracing of volume data. ACM Transaction on Graphics 1990; 9(3)245–61
- John N W. Volume rendering. Medical Radiology—Diagnostic Imaging, 3D Image Processing. Technique and Clinical Applications, D Caramella, C Bartolozzi. Springer, Berlin 2002; 35–41
- Pfister H, Kaufman A. Cube-4 – a scalable architecture for real-time volume rendering. Proceedings of ACM/IEEE Symposium on Volume Rendering. 1996; 47–54
- Bailey M. Interacting with direct volume rendering. IEEE Computer Graphics & Applications 2001; 21(1)10–12
- Cabral B, Cam N, Foran J. Accelerated volume rendering and tomographic reconstruction using texture mapping hardware. Proceedings of ACM/IEEE Symposium on Volume Visualization. 1995; 91–8
- Meissner M, Hoffmann U, Strasser W. Enabling classification and shading for 3D texture mapping based volume rendering using OpenGL and extensions. Proceedings of IEEE Visualization. 1999; 207–14
- Roettger S, Guthe S, Weiskopf D, Ertl T, Strasser W. Smart hardware accelerated volume rendering. Proceedings of Joint EUROGRAPHICS-IEEE TCVG Symposium on Visualization. 2003; 231–8
- Foster I, Kesselman C. The Grid: Blueprint for a New Computing Infrastructure. I Foster, C Kesselman. Morgan-Kaufmann, San Francisco 1999
- Bornik A, Beichel R, Reitinger B, Sorantin E, Werkgartner G, Leberl F, Sonka M. Augmented reality based liver surgery planning. Medical Prize Competition-winning entry at Eurographics 2003. Computer Graphics Forum 2003; 22(4)795–6