Abstract
Objective: Methods of evaluating surgical performance are mainly subjective. This study introduces a method of evaluating surgical performance using a quantitative analysis of tool tip kinematics.
Methods: One experienced surgeon performed eight rat microvascular anastomoses over a 2-day interval. An optoelectronic motion analysis system acquired tool tip trajectories at frequencies of 30 Hz. On the basis of a hierarchical decomposition, the procedure was segmented into specific surgical subtasks (free space movement, needle placement and knot throws) from which characteristic measures of performance (tool tip trajectory, excursion and velocity) were evaluated. Comparisons of performance measures across each procedure were indexed (D scale) using the Kolmogorov–Smirnov statistic.
Results: Despite the marker occlusions, tool tip data were obtained 92 ± 7% (mean ± SD) of the time during manipulation tasks. Missing data segments were interpolated across gaps of less than 10 sample points with errors less than 0.4 mm. The anastomoses were completed in 27 ± 4 min (range 20.5–31.4 min) with 100% patency. Tool tip trajectories and excursions were comparable for each hand, while right and left hand differences were found for velocity. Performance measures comparisons across each procedure established the benchmark for an experienced surgeon. The D-scale range was between 0 and 0.5.
Conclusion: The study establishes a reproducible method of quantitating surgical performance. This may enhance assessment of surgical trainees at various levels of training.
Introduction
Quantitative performance evaluation in surgery may be important for evaluating the progress of surgical residents Citation[1] and validation of surgical simulations, and for the design and evaluation of new instrumentation including robotics. There is a need for objective methods to evaluate surgical performance, as current methods of evaluation are mainly subjective and are potentially unreliable Citation[2]. In the past, neurosurgical performance has been linked to outcomes such as extracranial–intracranial (EC/IC) bypass patency rates Citation[3], stroke frequency following carotid endarterectomy Citation[4] and perioperative morbidity/mortality. Resident training has been based, to a large extent, on an apprenticeship model, with individual surgeons graduating from simple to more complex tasks Citation[5]. Although this has been a reasonable approach, the introduction of increasingly sophisticated surgical technologies, together with decreased individual case volume, may require alternative methods of training. Several general surgery groups are working to develop methods to objectively evaluate surgeon performance during minimally invasive surgery Citation[1], Citation[6], Citation[7]. Task completion time has been identified as a useful measure of surgical performance Citation[2], Citation[6],Citation[8–14]. Although easily quantifiable, time may not be a good indicator of overall performance. As a result, alternative quantifiable measures have been identified. A useful assessment technique based on a penalty scoring system where scores are assigned for various errors executed such as tool tip deviations, presence of bleeding and excess suturing, has been developed Citation[10]. Other groups have identified frequency of errors, force/torque signatures and tool tip positioning as useful measures for evaluation of performance Citation[6], Citation[8], Citation[11], Citation[14], Citation[15]. Despite these advances in general surgery, little has been done in neurosurgery.
In this study, a technique incorporating multiple kinematic measures of tool motion is presented. The purpose of this study was to identify a feasible method of measuring kinematic data and to assess intra-subject variability across multiple evaluations based on a unique application of a comparative statistical analysis method. A rat vascular anastomosis paradigm was selected to simulate an EC/IC bypass procedure.
Materials and methods
Equipment
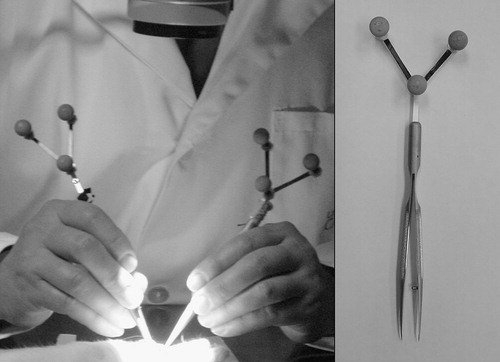
Two standard hand-held microsurgical tools, including forceps (S&T FRC-15 RM-8, Germany) and a needle driver (Storz E-3843, Germany), were equipped with custom-designed marker arrays (9.2 g each) fitted with retro-reflective markers (). An optoelectronic motion analysis system (Polaris-Northern Digital, Inc., Waterloo, ON, Canada) and video recordings were used to acquire tool tip trajectories at frequencies of 30 Hz with a positional accuracy of ∼0.2 mm. The Polaris system was connected to a standard PC (900 MHz Pentium III) running custom-designed data-acquisition software written in Matlab. Time-stamped video recordings of each experiment were archived and used to determine the stage of the surgical task and correlate it with the motion measurements. A Zeiss laboratory microscope (1–10 magnification range) was used for visualization of the operative site.
Figure 1. Left: Standard microsurgical tools equipped with trackable marker arrays (during a rat microvascular anastomosis). Right: Marker array equipped with retro-reflective markers attached to forceps handle.
Experimental protocol
All animals used in this study were treated in accordance with the guidelines of the Canadian Council on Animal Care and local institutional animal care standards. Male Sprague–Dawley rats weighing 300–400 g were anesthetized using 0.1 cc/100 g sodium pentobarbital (65 mg/cc) administered intraperitoneally. Additional boluses of 0.1 cc were used to maintain adequate anesthesia. An experienced microvascular surgeon conducted eight anastomoses (four femoral and four carotid) over a 2-day interval using conventional microsurgical tools, each equipped with marker arrays. Ethilon 9/0 monofilament suture was used in each case. To control the effect of the instrumented tools on performance, two additional anastomoses were completed by the same surgeon using the same tool set without the marker arrays attached. The surgeon was instructed to complete the anastomosis using standard surgical technique. After initial dissection and exposure of the artery, the surgical site was localized using a point probe equipped with a marker array. At the completion of the anastomosis, the clamps were removed and bleeding and patency evaluated at 5 min following clamp removal. Patency was confirmed by visual inspection using a ‘strip’ method. Each anastomosis was evaluated for the presence of thrombus and bleeding. At the conclusion of the experiment, all animals were euthanized with an intraperitoneal injection of sodium pentobarbital.
Hierarchical decomposition
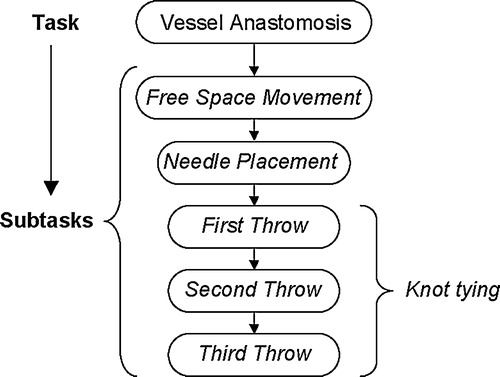
The microvascular anastomosis task was deconstructed according to various subtasks required for successful completion (). This technique was based on the decomposition approach originally described by Cao Citation[16]. Using this procedural breakdown, the anastomosis task was considered as a subcomponent within any particular phase of the vascular surgical procedure. The hierarchical decomposition provided the foundation for the quantitative analysis of selected kinematic performance measures, as it allowed quantification of standard aspects of the procedure. It also provided a uniform framework for making intra-subject comparisons of selected performance measures, many of which were only able to be defined for low-level movement segments.
Figure 2. Microvascular anastomosis hierarchical decomposition.
Data formatting
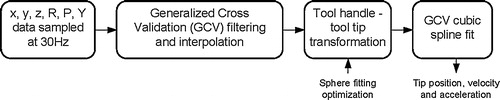
The recorded marker array position and orientation data were segmented according to the hierarchical decomposition using the time-stamped video data. Missing data due to the inherent line-of-sight limitations of the optoelectronic system were evaluated for length and then interpolated across if the gap was less than 10 samples. This length was chosen to keep interpolation errors below 0.4 mm. Data segments with greater than 10% missing data were omitted from the analysis. Each segment was filtered using a generalized cross validation (GCV) filtering technique Citation[17]. The sequence of data formatting is shown in . To ensure the absence of aliasing affects (distortion caused by low sampling rates) a fast Fourier transform (FFT) analysis was conducted on the sampled data.
Figure 3. Data formatting steps.
Performance measures
On the basis of an understanding of surgical technique, completion time, tool tip trajectory distance, tool tip excursion distance from worksite and tool tip velocity were selected as potentially useful measures for evaluating performance. Using archived video recordings, the kinematic data was segmented and used to evaluate each performance measure. The operational definitions of each performance measure are described in .
Table I. Kinematic performance measure definitions.
Comparative analysis
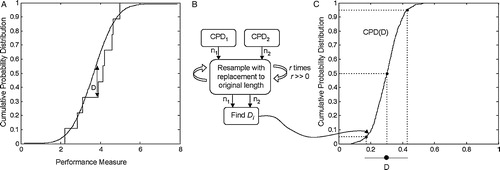
To demonstrate intra-subject performance repeatability, the differences between the distributions of kinematic measures obtained in each procedure were determined. The differences were assessed by comparing the distribution of performance measures obtained from multiple executions of a particular subtask. The Kolmogorov–Smirnov (K–S) statistic was selected to measure the difference between the two distributions as it provides an index value that quantifies the level of differences between distributions Citation[18]. Using the K–S statistic, the difference measure, D, was evaluated by comparing the distribution of a particular performance measure from one procedure to the concatenated (grouping of data sets) distribution of the remaining seven procedures. A subsequent grouping of D-value distributions for each procedure comparison was conducted to evaluate the overall procedural variability of D for each performance measure of each subtask.
The D-value represents the maximum vertical difference between pairs of cumulative probability distribution (CPD) functions as shown in . In this application the K–S statistic is computed on the basis of two finite sets of measures, resulting in an estimate of the true difference between the two sets. A bootstrapping approach was used to estimate the 90% confidence bound on the estimate of D. identifies the steps of the bootstrapping method. The associated P-value expresses the probability that the two measured distributions arise from the same underlying distribution.
Figure 4. A: A comparison of CPD functions of any arbitrary performance measure using the K–S statistic. B: Bootstrapping approach based on resampling of two finite sets. C: Using the CPD of D from resampling to establish confidence bounds on D.
Results
Feasibility of data collection
A certain amount of position data was lost during the course of the procedures because of marker obscuration. Archived video data was used to segment manipulation from non-manipulation tasks. On the basis of this segmentation, the majority of missing data were attributed to non-manipulation tasks. Using the GCV filtering technique, the data were filtered and missing data segments interpolated across. The FFT analysis indicated a cut-off frequency of ∼4 Hz. On the basis of the segmentation and interpolation of the data, the right and left tools were tracked 92 ± 7% and 89 ± 4% of the time, respectively. shows a summary of the data collection results. When the marker arrays were removed, the mean completion time of each suturing task was not significantly affected (P > 0.05).
Table II. Summary of tool tracking and anastomosis results.
Kinematic measures
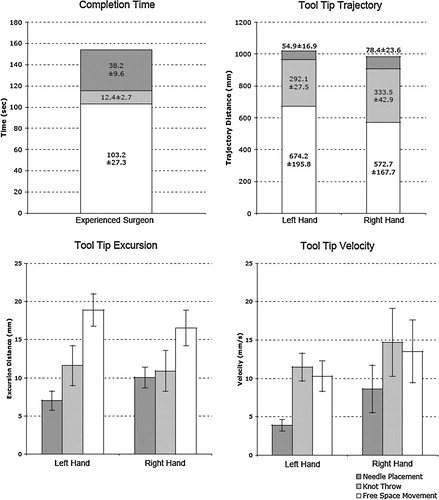
The surgeon completed all eight anastomoses in 27 ± 4 min (range 20.5–31.4 min), with 100% patency. shows a sample tool tip trajectory and an excursion distance profile for a knot throw. It demonstrates the capability of the system to track the right and left tools in real time, and how tool tip excursion varies with time. The measured and calculated values of the kinematic performance measures for the right- and left-hand tools are shown in . Sixty-seven percent of the procedure time was for free space movement, 25% for needle placement and 8% for knot tying. For both tool tip trajectory and tip excursion, the free space movement valve was significantly greater than those for needle placement and knot throw for both the right and left tools (P > 0.05 in each case). Statistically similar values for all three subtasks are shown for both right and left tools. In contrast, the mean tool tip velocity was greater for the right hand in all three subtasks. Needle placement velocity (Lt: 3.9 mm/s; Rt: 8.6 mm/s) was slower than knot tying velocity (Lt: 11.5 mm/s; Rt: 14.7 mm/s), and free space velocity (Lt: 10.3 mm/s; Rt: 13.5 mm/s) was slightly less than knot tying velocity. The variability in mean tool tip velocity was greater in the right tool when compared with the left.
Figure 5. Sample of a three-dimensional tool tip trajectory (left) and a tool tip excursion profile (right) for a knot-throwing subtask.
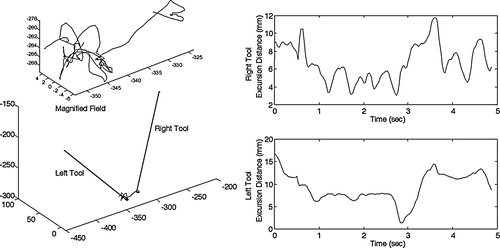
Figure 6. Performance measure results for an experienced surgeon. The error bars represent the plus or minus standard deviation.
Comparative analysis
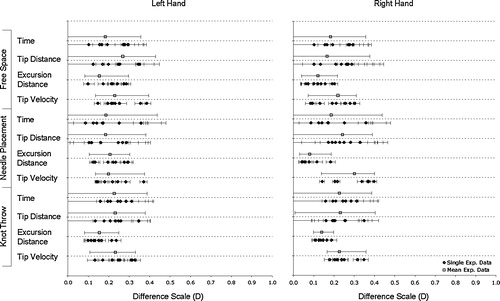
shows the range of D-values for each subtask performance measure for the right and left tools. The 90% confidence boundary intervals of D-values are shown for each procedure comparison and the subsequent grouping of each procedure to provide a cumulative D distribution. The confidence bounds on the cumulative D distributions are greater for time and tip distance than for excursion distance and tip velocity. The lower bound of the cumulative D distribution for time and tip distance for each subtask is zero. All D-values are less than 0.5.
Figure 7. K–S difference statistic of performance measures for the right and left tools at the subtask level. The confidence intervals marked indicate a 90% confidence bound and are based on a bootstrap estimate.
Discussion
A microvascular anastomosis is a complex task requiring high precision and dexterity for successful outcome. Quantitative performance assessment of microvascular surgeons is needed to enhance surgical training and improve evaluation methods. Kinematic measures of tool tip motion have been identified as a potentially useful technique for evaluating performance Citation[15]. In combination with other measures such as force/torque signatures, these methods will help optimize surgical performance evaluation. The objective of this study was to identify a feasible method to measure tool tip kinematics and to present a novel methodology to evaluate surgeon performance and quantify intra-subject repeatability.
Data collection
This study demonstrates a feasible method to quantitatively measure surgeon performance using an optoelectronic motion capture system. The system was effectively used to monitor tool tip kinematic data during surgical procedures, despite the line-of-sight limitations. Tool tip data was successfully recorded 92 ± 7% of the time during manipulation tasks. Using a GCV interpolation technique, it was possible to interpolate across gaps of missing data with root mean squared (RMS) errors of less than 0.4 mm. There was no indication of aliasing as the cut-off frequency of ∼4 Hz was well below the sampling rate of 30 Hz. The lightweight marker arrays had no significant effect on surgeon performance as measured by mean completion time (P > 0.05). However, the surgeon did comment on the slight awkwardness of the instrumented tools during the first anastomosis. To obtain complete data sets, it may be necessary to consider other tracking modalities such as electromagnetic- Citation[19] or accelerometer-based Citation[20] systems. The drawback of these alternatives is the requirement for an active connection, which may potentially limit tool movement. Despite this limitation, an electromagnetic system was successfully used to track hand movements during suturing tasks Citation[19]. Accelerometer-based systems would be useful for investigating alternative higher-order kinematics measures such as jerk Citation[21].
Performance measures
Completion time is commonly used to evaluate performance but does not necessarily capture all aspects of motor performance. Surgeons with different skill levels will likely accomplish the same task in different ways. For example, a skilled surgeon might make smoother or more accurate movements, with lower tissue-interaction forces, than a less skilled surgeon. Within the proposed kinematic measures, trajectory distance and tip excursion both represent economy of motion. As our surgeon is experienced and successfully completed each procedure, we would expect both these measures to represent a benchmark of efficient movement. Analysis of less experienced surgeons would likely reveal longer tip trajectories and greater excursion distances. As neurosurgical procedures become less invasive, tool excursion may increase inadvertent collisions with surrounding tissue. This exemplifies the need to measure tool tip velocity, as higher tool velocities may result in greater tissue damage during collisions. Our results indicate smaller velocity profiles during fine manipulation and greater velocities for free space excursions. A review of the literature identified no published kinematic data for tool tip movement during an anastomosis task. However, completion times are consistent with published values for microvascular surgeons of a similar skill level Citation[22], Citation[23].
Comparative analysis
The proposed methodology used to evaluate intra-subject reliability is based on a comparative analysis of performance measure distributions using the K–S statistic. This statistic is useful because it is non-dimensional, makes no a priori assumptions about the statistical distributions of the data and is comparatively insensitive to the presence of outliers Citation[18]. The application of the K–S statistic to index performance measure comparisons is unique and represents the basis of our analysis technique. An alternative approach to performance evaluation was recently demonstrated on a porcine model and is based on an analysis of tool tip force/torque signatures Citation[15]. In this study a Markov modeling technique was used in conjunction with a structured classification of tool actions to assess surgeon performance. The results suggest force/torque measurements are useful in differentiating surgeons of different experience levels. However, one potential limitation of Rosen's sequencing work is the inability to reveal high-level procedural details of surgeon performance. Using the hierarchical decomposition approach, the proposed methodology allows analysis at various levels.
The intra-subject comparison of performance measures using the K–S statistic provides an indication of procedural variability and the potential reliability of the selected performance measures. Owing to the procedural variability, there is an expectation to see some degree of difference between distributions of various performance parameters. The low values of D with relatively small confidence bounds suggest the surgeon performed consistently over multiple procedures. Most notably, procedural variability had little effect on the excursion distance and tool tip velocity distributions. The performance parameters most likely affected by procedural variability appeared to be time and the tool tip trajectory distance. There are only small differences between how the right-handed surgeon manipulated the right- and left-hand tools. The variability of performance measures was low for both the left- and right-hand tools with D-values for both in a similar range. As the surgeon was fully trained, these values represent the minimum variations expected from procedure to procedure when using the same surgical tool. To accurately determine inter-subject reliability of the performance measures, it will be necessary to examine surgeons at various skill levels. Experiments are already underway to investigate the performance of surgical residents at different levels of training. On the basis of the described methodology of measuring performance differences, the D-values will provide additional context to the difference scale. These results will be published in a future report.
Conclusion
During vascular anastomoses, an automated tool tracking system to measure tool tip trajectories and identify kinematic features of specific surgical subtasks was developed. The results demonstrate that optoelectronic and video motion analyses are useful methods for recording kinematic data. It was shown that an experienced surgeon performs specific tasks consistently from case to case. The presented performance measures will form the basis for quantifying surgical skill in the laboratory and should prove useful in validating surgical simulations for use in training, certifying surgeons and designing and evaluating new surgical instrumentation.
Acknowledgements
The authors would like to acknowledge Dr. Antony Hodgson from the University of British Columbia for his contributions to this methodology. This work was supported by a grant from the Heart and Stroke Foundation of Alberta, Northwest Territories and Nunavut.
References
- Winckel C. P., Reznick R. K., Cohen R., Taylor B. Reliability and construct validity of a structured technical skills assessment form. Am J Surg 1994; 167(4)423–427
- Starkes J. L., Payk I., Jennen P., Leclair D. A stitch in time: Cognitive issues in microsurgery. Cognitive issues in motor expertise, J. L. Starkes, F. Allard. North Holland;, New York, NY 1993; 225–240
- EC/IC Bypass Study Group. Failure of extracranial–intracranial arterial bypass to reduce the risk of ischaemic stroke: results of an international randomized trial. N Engl J Med 1985; 313: 1191–1200
- Ferguson G. G., Eliasziw M., Barr H. W., Clagett G. P., Barnes R. W., Wallace M. C., Taylor D. W., Haynes R. B., Finan J. W., Hachinski V. C., Barnett H. J. The North American Symptomatic Carotid Endarterectomy Trial: surgical results in 1415 patients. Stroke 1999; 30(9)1745–1750
- Périssat J. Laparoscopic surgery in gastroenterology: an overview of recent publications. Endoscopy 1995; 27: 106–118
- Hodgson A. J., Person J. G., Salcudean S. E., Nagy A. G. The effects of physical constraints in laparoscopic surgery. Med Image Anal 1999; 3(3)275–283
- Tendick F., Mori T., Way L. W. Future of laparoscopic surgery. Fundamentals of laparoscopic surgery, L. W. Way, S. Bhoyrul, T. Mori. Churchill Livingstone Inc.;, New York 1995; 235–252
- Chung J. Y., Sackier J. M. A method of objectively evaluating improvements in laparoscopic skills. Surg Endosc 1998; 12: 1111–1116
- Derossis A. M., Fried G. M., Abrahamowicz M., Sigman H. H., Barkun J. S., Meakins J. L. Development of a model for training and evaluation of laparoscopic skills. Am J Surg 1998; 175: 482–487
- Fried G. M., Derossis A. M., Bothwell J., Sigman H. H. Comparison of laparoscopic performance in vivo with performance measured in a laparoscopic simulator. Surg Endosc 1999; 13: 1077–1081
- Hanna G. B., Drew T., Clinch P., Hunter B., Cuschieri A. Computer-controlled endoscopic performance assessment system. Surg Endosc 1998; 12: 997–1000
- Keyser E. J., Derossis A. M., Antoniuk M., Sigman H. H., Fried G. M. A simplified simulator for the training and evaluation of laparoscopic skills. Surg Endosc 2000; 14(2)149–153
- Rosser J. C., Rosser L. E., Savalgi R. S. Objective evaluation of a laparoscopic surgical skill program for residents and senior surgeons. Arch Surgery 1998; 133(2)657–661
- Taffinder N., Darzi A., Smith S. Assessing operative skill. Needs to become more objective. BMJ 1999; 318(7188)887–888
- Rosen J., Hannaford B., Richards C. G., Sinanan M. N. Markov modeling of minimally invasive surgery based on tool/tissue interaction and force/torque signatures for evaluating surgical skill. IEEE Trans Biomed Eng 2001; 48(5)579–591
- Cao C. G.L., MacKenzie C. L., Ibbotson J. A., Turner L. J., Blair N. P., Nagy A. G. Hierarchical decomposition of laparoscopic procedures. Proceedings of Medicine Meets Virtual Reality. IOS Press, Amsterdam 1999; 7: 1999
- Woltring H. J. A Fortran package for generalized, cross-validatory spline smoothing and differentiation. Adv Eng Software 1986; 8(2)142–151
- Press W. H., Teukolsky S. A., Vetterling W. T., Flannery B. P. Numerical recipes in C. 2nd ed. Cambridge University Press;. 1992
- Khan M. S., Bann S. D., Darzi A., Butler P. E. Use of suturing as a measure of technical competence. Ann Plast Surg 2003; 50(3)304–308
- Mayagoitia R. E., Nene A. V., Veltink P. H. Accelerometer and rate gyroscope measurement of kinematics: an inexpensive alternative to optical motion analysis systems. J Biomech 2002; 35(4)537–542
- Nelson W. L. Physical principles for economies of skilled movements. Biol Cybernetics 1983; 46: 135–147
- Starkes J. L. Eye-hand coordination in experts: from athletes to microsurgeons. Development of eye–hand coordination across the life span, C. Bard, M. Fleury, L. Hay. University of South Carolina Press, Columbia, SC; 1991; 309–326
- Starkes J. L., Payk I., Hodges N. J. Developing a standardized test for the assessment of suturing skill in novice microsurgeons. Microsurgery 1998; 18(1)19–22